DOI:
10.1039/C6RA28805G
(Paper)
RSC Adv., 2017,
7, 32020-32026
Economical, facile synthesis of network-like carbon nanosheets and their use as an enhanced electrode material for sensitive detection of ascorbic acid†
Received
30th December 2016
, Accepted 25th May 2017
First published on 23rd June 2017
Abstract
A highly sensitive electrochemical sensor for the detection of ascorbic acid (AA) was first fabricated using network-like carbon nanosheets (NCN) as an enhanced electrode modifier. Novel carbon nanosheets were synthesized from willow catkin via a high temperature carbonization and chemical activation process with the aid of potassium hydroxide (KOH). The formation of porous and interconnected structures of the resulting product was characterized by various experiment techniques including scanning electron microscopy (SEM), transmission electron microscopy (TEM), Raman spectroscopy and nitrogen isothermal adsorption–desorption technique. The network-like carbon nanosheet modified glassy carbon electrode (NCN/GCE) exhibited excellent electrocatalytic activity for the electrochemical oxidation of ascorbic acid owing to the unique network-like and partially graphitic structure. The amperometric curve of AA on the NCN/GCE showed a quick current response, a fine linear consistency of the peak current with the concentration of AA, a low detection limit and an excellent selectivity. Based on these excellent properties, a new sensing platform was developed and verified by the determination of ascorbic acid in commercial injections.
1. Introduction
Ascorbic acid, also known as vitamin C, is a water-soluble vitamin and commonly used as an antioxidant. As one of the most important nutrients needed for humans, ascorbic acid supports a healthy immune system and has been widely used to prevent or treat the common cold, cancer, infertility and mental illness.1,2 Furthermore, ascorbic acid content is a key determinant of the eating quality of various foods such as fruits and vegetables. Thus, it is necessary to establish a quantitative analysis method for AA determination with high sensitivity and accuracy. Among the different types of methods, electrochemical methods are receiving significant attention due to their sensitivity, rapidity, accuracy, and low cost.3–6 Unfortunately, direct oxidation of AA at conventional electrodes is a sluggish kinetics process, which results in a high overpotential, poor sensitivity and low selectivity.7–10 Thus, the development of new electrode modifiers with excellent electrochemical performance is a key factor to solve the above-mentioned problems.
Recently, graphene has been suggested as the best-known electrode material for constructing high-sensitivity sensor due to its high specific surface area, superior conductivity and good biocompatibility.11–14 Although the synthesis of graphene has been successfully carried out,15–17 complicated synthesis procedure and high cost greatly limit its wider applicability in the future. One of the many ways to overcome these challenges is nature-inspired nanomaterials with novel structures and performances, which exhibited potential applications in multiple areas including supercapacitors,18–20 gas storage,21 catalyst,22 and analytical sensing.23,24 Willow catkin abounds with cellulose and is easily available in spring. It has been reported that advantageous carbon nanomaterials containing unique structure can be prepared via carbonization of cellulose.25–28 Herein, we synthesized the novel graphene-like carbon nanosheets using willow catkin as the precursor through a simple pyrolysis and activation. The as-synthesized carbon nanosheets were first used as an enhanced electrode material for the analysis of AA. Impressively, the carbon nanosheets modified glass carbon electrode exhibited outstanding electrocatalytic activity, high sensitivity and perfect selectivity towards the detection of AA, which should be attributed to the unique porous and interconnected structure. The carbon nanosheets-based electrochemical sensor, with easy synthesis, simple fabricating process, excellent electrochemical performance and low cost, holds great promise for the determination of AA in practical applications.
2. Experimental
2.1. Reagents and instruments
AA and KOH were purchased from Yongda Chemical Reagent Company of Tianjin. Other chemical reagents were analytical grade and used as received without further purification. Phosphate buffer solution (PBS) was prepared using Na2HPO4 (0.1 mol L−1) and NaH2PO4 (0.1 mol L−1). Willow catkin was collected in Heilongjiang province, China.
SEM images were acquired on a JEOL JSM-6480 spectrophotometer, whereas TEM images were obtained on a FEI Tecnai G2 S-Twin microscope with an accelerating voltage of 200 kV. Raman spectroscopy analysis was carried out on a Jobin-Yvon HR800 Raman spectrometer. The N2 adsorption–desorption isotherms were determined with a Micromeritics ASAP 2020 sorptometer at 77 K. Electrochemical impedance spectroscopy (EIS) experiments were performed on a ZAHNER ZENNIUM electrochemical workstation. Other electrochemical measurements were made on a CHI 900C electrochemical analyzer (CH Instruments, Chenhua Co., Shanghai, China).
2.2. Synthesis of NCN
Network-like carbon nanosheets were obtained by pyrolysis and activation of willow catkin.27,29 Typically, the willow catkin was sequentially rinsed with acetone and distilled water before use. The mixture of 5 g willow catkin and 5 g potassium hydroxide was added into a certain amount of water under stirring. Then, the mixture was heated at 80 °C for 6 h to remove the water and the solid was collected. Next, the solid was pyrolysed at 400 °C for 3 h and then further heated to 750 °C for 2 h under a continuous argon flow. The resulting mixture was filtered, washed thoroughly with HCl and water several times until the pH value of the filtrate became neutral. After being dried in an oven, the network-like carbon nanosheets were obtained. A simplified schematic description of the whole process is given in Scheme 1. Finally, the carbon nanosheets were dispersed in dimethylformamide and ultrasonicated for at least 1 h to form a 1 mg mL−1 uniform suspension.
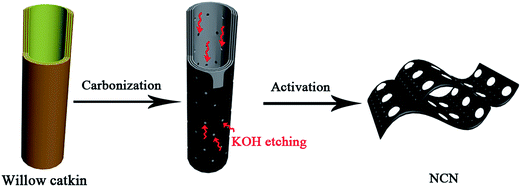 |
| | Scheme 1 Illustration of the synthesis process for the network-like carbon nanosheets. | |
2.3. Electrochemical experiments
Electrochemical experiments for determination of AA were carried out using a typical three-electrode electrochemical system. The working electrode was a bare or the modified GCE, the counter electrode was Pt wire and a saturated calomel electrode (SCE) served as the reference electrode. Prior to modification, bare GCE was sequentially polished with 0.3 and 0.05 μm alumina slurry, washed ultrasonically in nitric acid and distilled water respectively for 3 min and then dried under nitrogen stream. The modified GCE was obtained by dropping 9 μL of the prepared suspension onto the surface of bare electrode and dried under infrared lamp.
3. Results and discussion
3.1. Characterization of NCN
Scanning electron microscopy and transmission electron microscopy were employed to characterize the surface morphology of the carbon nanosheets. It is clearly seen in Fig. 1a that the willow catkin has a hollow, tube-like structure. The SEM image (Fig. 1b) displays that the carbon nanosheets derived from willow catkin possess a highly interconnected network-like structure. Moreover, from the TEM images (Fig. 1c and S1†), we can clearly observe the lattice fringes on the porous carbon nanosheets, which demonstrates the partially ordered structure. Further detailed structure information was inspected by Raman spectroscopy analysis. As shown in Fig. 1d, the D band appeared at ∼1350 cm−1 is related to the disordered and defective portions in the structure, while the G band located at ∼1580 cm−1 is ascribed to the degree of graphitization.30,31 The integral intensity ratio (IG/ID) is 0.75, confirming that the carbon nanosheets are partially graphitized, which is crucial for improving the electrical conductivity in carbon-based electrodes.32
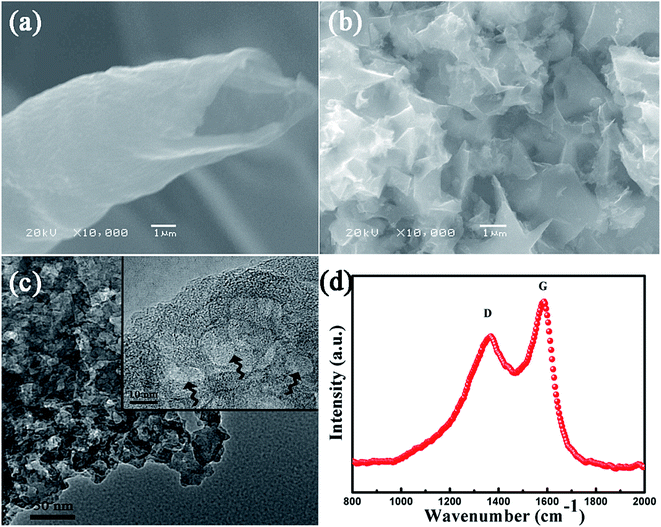 |
| | Fig. 1 The SEM images of willow catkin (a) and NCN (b). The TEM image of NCN (c). The Raman spectra of NCN (d). | |
Nitrogen adsorption–desorption analysis was used to study the porosity of the resultant carbon materials. As shown in Fig. 2A, the carbon nanosheets show the isotherm for type-I, indicating the significant existence of micropores (<2 nm) in the materials. The pore size distribution of NCN was further recognized by density functional theory (DFT) model (Fig. 2B). It is easy to discover that its pore size distribution mainly focuses on the range of 1.5–1.8 nm. Impressively, the prepared carbon materials show a high specific surface area of 1589 m2 g−1, which demonstrates the sufficient pore openness due to the activation of KOH. Thus, the carbon nanosheets can be directly used as an enhanced electrode material for the analysis of AA owing to the partially graphitic and network-like structure.
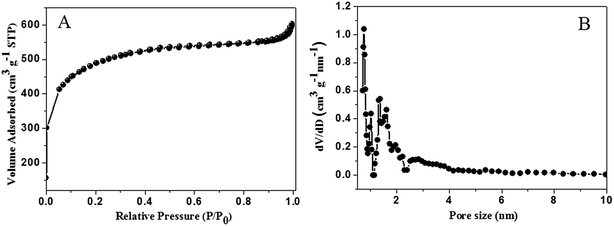 |
| | Fig. 2 The N2 adsorption–desorption isotherm (A) and pore size distribution (B) of NCN. | |
3.2. Electroactivity of NCN
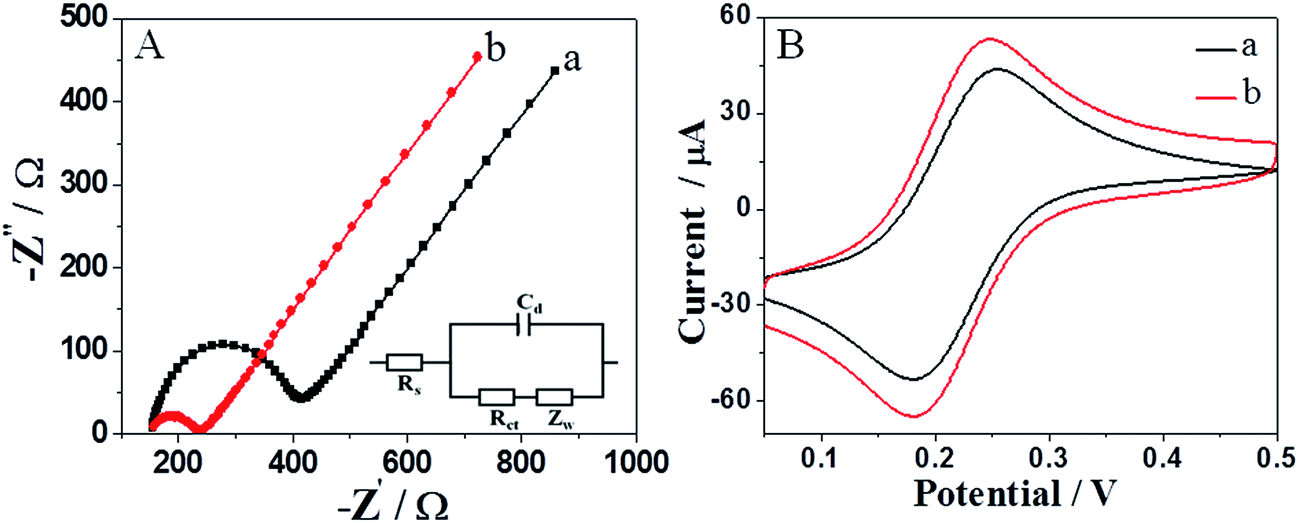
EIS was used to reveal the favorable performance of the carbon nanosheets modified electrode. Fig. 3A provides the Nyquist plots of the different electrodes in a solution of 5 mM Fe(CN)63−/4− in 0.1 M KCl. As we all know, the charge transfer resistance (Rct) corresponds to the diameter of the semicircular region, which can be used to describe the electron-transfer kinetics of the modified electrode.33,34 The larger the semicircle portion, the higher the electron transfer resistance. As shown in Fig. 3A, the Rct of the NCN/GCE is calculated to be 119 Ω in fact, much lower than that of the bare electrode (ca. 281 Ω). The result demonstrates that the carbon nanosheets significantly decrease the electron transfer resistance and facilitate the electrical conductivity.
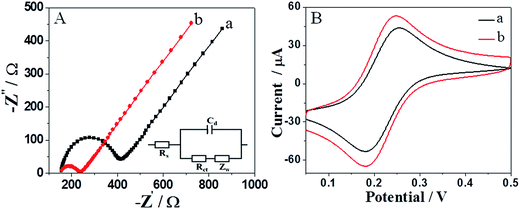 |
| | Fig. 3 (A) Nyquist plots for a bare GCE (a) and a NCN/GCE (b) in a 5 mM Fe(CN)63−/4− solution containing 0.1 M KCl. Inset is the equivalent circuit; (B) CVs of bare GCE (a) and NCN/GCE (b) in a 5 mM Fe(CN)63−/4− solution containing 0.1 M KCl. Scan rate: 0.05 V s−1. | |
The electrochemical property of the prepared NCN/GCE was further evaluated by CV using Fe(CN)63−/4− as redox probe. As shown in Fig. 3B, the bare GCE displayed a pair of quasi-reversible redox peaks with a peak separation (ΔEp) of 75 mV. According to the literature,35 the ΔEp is the function of the electron transfer rate. After bare GCE was modified with NCN, the peak current of the system was increased, while the ΔEp decreased by 7 mV. The changes were consistent with the discussion of EIS, which further confirmed that the carbon nanosheets possess superior electrical conductivity and are expected to be a promising material towards AA determination.
3.3. Electrocatalytic oxidation of AA
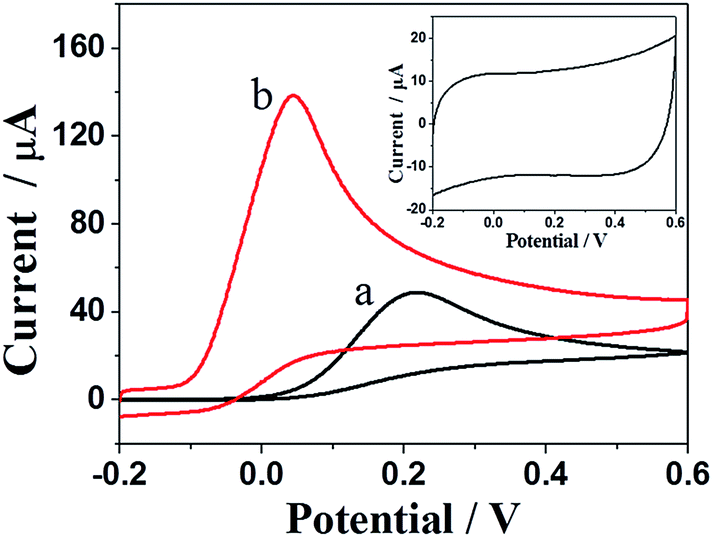
To examine the electrocatalytic performance of the carbon nanosheets, the oxidation of 5 mM AA at different electrodes was conducted using cyclic voltammetry and the results are shown in Fig. 4. Both bare GCE and NCN/GCE exhibited one oxidation peak in the test potential range, indicating the irreversible electrochemical process of AA on the electrodes. As expected, after being decorated with the carbon nanosheets, the oxidation peak potential of AA greatly reduced to 0.045 V and the anodic current was much higher (ca. 2-folds) than that of the bare GCE. The smaller overpotential and the higher peak current offer forceful evidence for the electrocatalytic effect of NCN towards AA. The increased electrocatalytic activity can be partly attributed to the formation of the network-like structure which provides a pathway for rapid electron transfer.36 On the other hand, a high specific surface area can offer more active sites to catalyze analyte, which results in an improvement of electrocatalytic performance.37,38
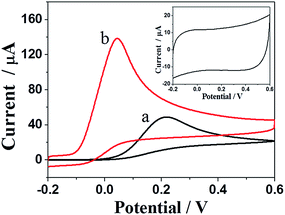 |
| | Fig. 4 CVs of 5 mM AA in 0.1 M PBS (pH 6.5) with a bare GCE (a) and a NCN/GCE (b). Inset: CV curve of a NCN/GCE in 0.1 M PBS (pH 6.5). Scan rate: 0.1 V s−1. | |
For an electrochemical sensor, the pH value of supporting electrolyte is an important operation parameter which could affect the current response of analyte. The relationship between the oxidation current of AA and the pH value was investigated by differential pulse voltammetry (DPV) at different pH values (pH: 5–8). As shown in Fig. 5A, the electrochemical response of ascorbic acid is dependent on the pH value of PBS and reaches a maximum at pH = 6.5, which may be attributed to the effect of pH on the charge density and charge property of AA and NCN.39,40 Accordingly, a pH value of 6.5 was chosen for the determination of AA.
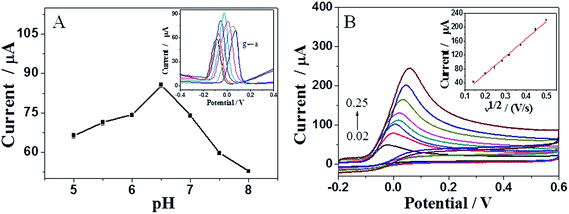 |
| | Fig. 5 (A) Effect of pH value on the oxidation current response of 2.5 mM AA at NCN/GCE. Inset: DPVs of 2.5 mM AA at NCN/GCE with different pH values (a → g: 5, 5.5, 6, 6.5, 7, 7.5, 8); (B) CVs of 5 mM AA in 0.1 M PBS (pH 6.5) at NCN/GCE with different scan rates (0.02, 0.04, 0.06, 0.08, 0.10, 0.14, 0.2 and 0.25 V s−1). Inset: the oxidation peak current of AA vs. the square root of the scan rate. | |
Fig. 5B depicts cyclic voltammograms of NCN/GCE in 0.1 M PBS containing 5 mM AA acquired at different scan rates, which can explore the reaction mechanism. It is easy to discover that the peak potential (Epa) shifts positively with increasing scan rate in CV measurements, manifesting a kinetic limitation of AA oxidation at NCN/GCE.41 The relationship between Epa and the natural logarithm of scan rate (ln![[thin space (1/6-em)]](https://www.rsc.org/images/entities/char_2009.gif) v) can be expressed as the equation: Epa (V) = 0.0946 + 0.0299lnv (R2 = 0.9953). Based on the well-known Laviron's equation, the slope of Epa versus lnv graph is equal to RT/anF. Thus, electron transfer number (n) is calculated to be 2, indicating that the electrochemical reaction of AA at NCN/GCE is a two-electron transfer process. As shown in the inset of Fig. 5B, the anodic current of AA is linear to the square root of scan rate in the range of 0.02–0.25 V s−1, demonstrating that the reaction of AA at the modified electrode is controlled by diffusion.42,43
v) can be expressed as the equation: Epa (V) = 0.0946 + 0.0299lnv (R2 = 0.9953). Based on the well-known Laviron's equation, the slope of Epa versus lnv graph is equal to RT/anF. Thus, electron transfer number (n) is calculated to be 2, indicating that the electrochemical reaction of AA at NCN/GCE is a two-electron transfer process. As shown in the inset of Fig. 5B, the anodic current of AA is linear to the square root of scan rate in the range of 0.02–0.25 V s−1, demonstrating that the reaction of AA at the modified electrode is controlled by diffusion.42,43
3.4. Amperometric response of AA on the NCN/GCE
Typical amperometric plot of the NCN/GCE with successive additions of AA at 0.05 V is depicted in Fig. 6. As ascorbic acid was injected into the stirring PBS, stepwise increase of current response was achieved within 5 s. Furthermore, the oxidation peak current of AA has a good linear relation with its concentration (inset of Fig. 5) in the range from 7.5 μM to 0.64 mM, with a detection limit of 1.2 μM (S/N = 3). The linear regression equation can be expressed as ipa (μA) = 0.0903–0.02cAA (μM) (R2 = 0.9976). The sensitivity of the proposed sensor is 282.94 μA mM−1 cm−2, which is calculated from the slope of calibration plot and the active electrode surface area.3,44
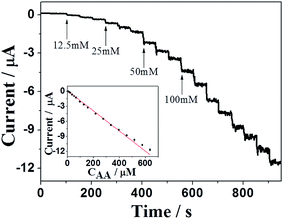 |
| | Fig. 6 The amperometric current response of the NCN/GCE upon successive injection of various concentrations of AA into stirred PBS (pH 6.5). Applied potential: 0.05 V. Inset: the plot of electrocatalytic current of AA versus its concentration. | |
To further evaluate the analytical performance of the NCN/GCE for AA detection, different comparison aspects including applied potential, linear range and detection limit are listed in Table 1. The proposed method exhibits better than or comparable performance to those of the previous reports,34,45–48 suggesting that the carbon nanosheets can be directly used as an enhanced material for sensitive determination of AA.
Table 1 Comparison of analytical performance at various electrodes for the determination of AA
| Electrodes |
Applied potential (V) |
Linear range |
Detection limit (μM) |
References |
| AsOx/c-MWCNT/PANI/Au |
0.6 |
2–206 μM |
0.9 |
45 |
| AMWCNT/PcCo/GCE |
0.05 |
10 μM to 1.2 mM |
4 |
46 |
| PB film/GCE |
0.27 |
5 × 10⁻⁶ to 1.0 × 10⁻³ M |
2.49 |
47 |
| PLL-GA-Mo(CN)84−/GCE |
0.575 |
5 × 10⁻⁵ to 1.2 × 10⁻³ M |
— |
48 |
| — |
5 × 10⁻⁴ to 1.5 × 10⁻² M |
— |
|
| Pd NWs/GCE |
0 |
25 μM to 0.9 mM |
0.2 |
34 |
| NCN/GCE |
0.05 |
7.5 μM to 0.64 mM |
1.2 |
Present work |
3.5. Selectivity, reproducibility and stability
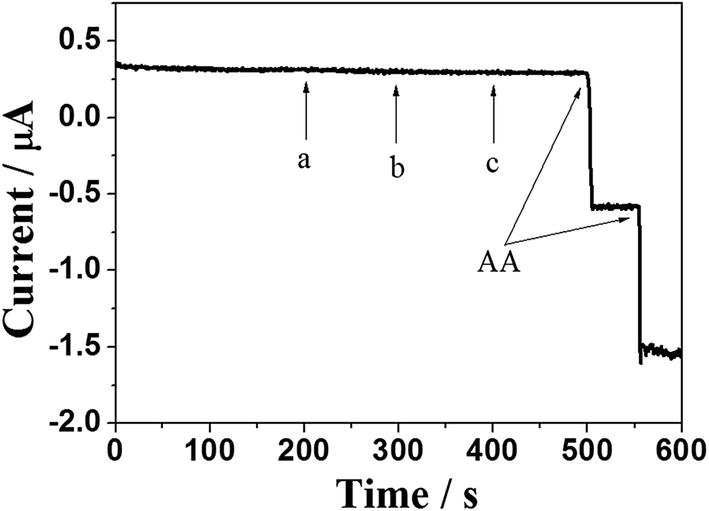
The selectivity of the NCN/GCE towards the oxidation of AA was also investigated by amperometric method. Some coexisted electrochemical biomolecules such as dopamine (DA), uric acid (UA) and glucose were added into the PBS solution, which generally introduce serious interference to the determination of AA. As shown in Fig. 7, compared with a sensitive amperometric response to AA, the addition of common electroactive species did not show any interferential response under an applied potential of 0.05 V. This phenomenon illustrates the high selectivity of the NCN/GCE towards AA oxidation. Furthermore, the reproducibility and long term stability of the carbon nanosheets modified GCE were systematically investigated through CV measurement. The relative standard deviation (RSD) is found to be 4.18% for six repeated measurements of 0.1 mM AA with the same electrode, indicating the good reproducibility of the NCN/GCE. After 1 month storage in PBS at room temperature, there is only about 7.5% loss in the current response of the NCN/GCE towards AA, confirming the suitable stability of the NCN/GCE. These results demonstrate that the as-prepared NCN/GCE possesses notable electrochemical performance for determination of AA.
 |
| | Fig. 7 The amperometric current response at the NCN/GCE upon successive injections of 20 mM DA (a), 20 mM UA (b), 50 mM glucose (c), 50 mM AA and 50 mM AA into stirred PBS (pH 6.5). Applied potential: 0.05 V. | |
3.6. Practical sample analysis
After above electrochemical tests, to verify the applicability, the carbon nanosheets modified GCE was used to determine AA content in samples of vitamin C injection. The vitamin C injection (0.25 g/2 mL) was diluted 10 times with 0.1 M PBS, then 3 μL of the diluted samples was injected into the stirring PBS solution at 0.05 V. The injection of AA was analyzed using standard addition method and the results are shown in Table 2. There is a satisfactory agreement between the amount determined and amount labeled on the bottle, and the recoveries lie in the range of 97.9–104.8%. The results indicate that the proposed AA sensor has promising applications in real samples.
Table 2 Determination of AA in vitamin C injection samples
| Samples |
Determined (μM) |
Added (μM) |
Found (μM) |
RSD (n = 3, %) |
Recovery (%) |
| 1 |
|
15 |
59.2 |
3.9 |
104.8 |
| 2 |
41.5 |
30 |
70 |
2.8 |
97.9 |
| 3 |
|
60 |
102.7 |
2.2 |
101.2 |
4. Conclusion
In summary, the carbon nanosheets with porous and network-like were successfully designed and synthesized for use as an enhanced electrode material in the field of AA determination. Benefitting from the novel structure, the fabricated electrochemical sensor exhibited excellent electrochemical performance for AA oxidation in terms of the reduction of the overpotential, high sensitivity and good selectivity. Particularly, the carbon nanosheets modified electrode showed a wide linear range and low detection limit. The exact determination of AA in vitamin C injection further confirmed that the network-like carbon nanosheets are undoubtedly a good choice for conducting AA sensor.
Acknowledgements
This work was supported by the National Natural Science Foundation of China (51572052), the Scientific Research Foundation of Mudanjiang Normal University (QG2014004) and the Undergraduate Innovation Program of Heilongjiang Province (201610233028).
References
- O. Arrigori and C. D. Tullio, Biochim. Biophys. Acta, 2002, 1569, 1–9 CrossRef.
- N. F. Atta, M. F. El-Kady and G. Ahmed, Anal. Biochem., 2010, 400, 78–88 CrossRef CAS PubMed.
- H. Ruan, B. Liu and H. Li, RSC Adv., 2015, 5, 21242–21248 RSC.
- L. Pei, N. Lin, T. Wei, H. Liu and H. Yu, J. Mater. Chem. A, 2015, 3, 2690–2700 CAS.
- V. K. Gupta, A. K. Jain and S. K. Shoora, Electrochim. Acta, 2013, 93, 248–253 CrossRef CAS.
- S. A. Kumar, P. H. Lo and S. M. Chen, Biosens. Bioelectron., 2008, 24, 518–523 CrossRef CAS PubMed.
- L. Tian, L. Chen, L. Liu, N. Lu, W. B. Song and H. D. Xu, Sens. Actuators, B, 2006, 113, 150–155 CrossRef CAS.
- S. B. Khoo and F. Chen, Anal. Chem., 2002, 74, 5734–5741 CrossRef CAS PubMed.
- M. Rueda, A. Aldaz and F. Sanchez-Burgos, Electrochim. Acta, 1978, 23, 419–424 CrossRef CAS.
- R. Zhang, S. Liu, L. Wang and G. Yang, Measurement, 2013, 46, 1089–1093 CrossRef.
- Y. Kim, S. Bong, Y. Kang, Y. Yang, R. Mahajan, J. Kim and H. Kim, Biosens. Bioelectron., 2010, 25, 2366–2369 CrossRef CAS PubMed.
- L. X. Chen, J. N. Zheng, A. J. Wang, L. J. Wu, J. R. Chen and J. J. Feng, Analyst, 2015, 140, 3183–3192 RSC.
- S. Zhao, H. Yin, L. Du, G. Yin, Z. Tang and S. Liu, J. Mater. Chem. A, 2014, 2, 3719–3724 CAS.
- H. Teymourian, A. Salimi and S. Khezrian, Biosens. Bioelectron., 2013, 49, 1–8 CrossRef CAS PubMed.
- D. Wei, Y. Liu, H. Zhang, L. Huang, B. Wu, J. Chen and G. Yu, J. Am. Chem. Soc., 2009, 131, 11147–11154 CrossRef CAS PubMed.
- X. Zhang, K. Li, H. Li, J. Lu, Q. Fu and Y. Chu, Synth. Met., 2014, 193, 132–138 CrossRef CAS.
- J. Yang and S. Gunasekaran, Carbon, 2013, 51, 36–44 CrossRef CAS.
- S. Hu, S. Zhang, N. Pan and Y.-L. Hsieh, J. Power Sources, 2014, 270, 106–112 CrossRef CAS.
- X. Liu, M. Zheng, Y. Xiao, Y. Yang, L. Yang, Y. Liu, B. Lei, H. Dong, H. Zhang and H. Fu, ACS Appl. Mater. Interfaces, 2013, 5, 4667–4677 CAS.
- H. Wang, Z. Li, J. K. Tak, C. M. B. Holt, X. Tan, Z. Xu, B. S. Amirkhiz, D. Harfield, A. Anyia, T. Stephenson and D. Mitlin, Carbon, 2013, 57, 317–328 CrossRef CAS.
- A. Ganesan, R. Mukherjee, J. Raj and M. M. Shaijumon, J. Porous Mater., 2014, 21, 839–847 CrossRef CAS.
- Y. Zhai, C. Zhu, E. Wang and S. Dong, Nanoscale, 2014, 6, 2964–2970 RSC.
- S. Liu, J. Tian, L. Wang, Y. Zhang, X. Qin, Y. Luo, A. M. Asiri, A. O. Al-Youbi and X. Sun, Adv. Mater., 2012, 24, 2037–2041 CrossRef CAS PubMed.
- W. Lu, X. Qin, S. Liu, G. Chang, Y. Zhang, Y. Luo, A. M. Asiri, A. O. Al-Youbi and X. Sun, Anal. Chem., 2012, 84, 5351–5357 CrossRef CAS PubMed.
- M. H. Park, Y. S. Yun, S. Y. Cho, N. R. Kim and H. J. Jin, Carbon Letters, 2016, 19, 66–71 CrossRef.
- D. Guo, C. Zheng, W. Deng, X. Chen, H. Wei, M. Liu and S. Huang, J. Solid State Electrochem., 2017, 21, 1165–1174 CrossRef CAS.
- Y. Li, N. Yu, P. Yan, Y. Li, X. Zhou, S. Chen, G. Wang, T. Wei and Z. Fan, J. Power Sources, 2015, 300, 309–317 CrossRef CAS.
- S. Swarnalatha, A. G. Kumar and G. Sekaran, J. Porous Mater., 2009, 16, 239–245 CrossRef CAS.
- M. Sevilla, W. Gu, C. Falco, M. M. Titirici, A. B. Fuertes and G. Yushin, J. Power Sources, 2014, 267, 26–32 CrossRef CAS.
- C. Bommier, R. Xu, W. Wang, X. Wang, D. Wen, J. Lu and X. Ji, Nano Energy, 2015, 13, 709–717 CrossRef CAS.
- K. Krishnamoorthy, G. S. Kim and S. J. Kim, Ultrason. Sonochem., 2013, 20, 644–649 CrossRef CAS PubMed.
- H. Wang, Z. Xu, A. Kohandehghan, Z. Li, K. Cui, X. Tan, T. J. Stephenson, C. K. King'ondu, C. M. B. Holt, B. C. Olsen, J. K. Tak, D. Harfield, A. O. Anyia and D. Mitlin, ACS Nano, 2013, 7, 5131–5141 CrossRef CAS PubMed.
- Q. Wang, J. E. Moser and M. Grätzel, J. Phys. Chem. B, 2005, 109, 14945–14953 CrossRef CAS PubMed.
- D. Wen, S. Guo, S. Dong and E. Wang, Biosens. Bioelectron., 2010, 26, 1056–1061 CrossRef CAS PubMed.
- X. Zhang, W. Yan, J. Zhang, Y. Li, W. Tang and Q. Xu, RSC Adv., 2015, 5, 65532–65539 RSC.
- J. Dai, D. Deng, Y. Yuan, J. Zhang, F. Deng and S. He, Microchim. Acta, 2016, 183, 1553–1561 CrossRef CAS.
- J. Li, D. Kuang, Y. Feng, F. Zhang, Z. Xu, M. Liu and D. Wang, Biosens. Bioelectron., 2013, 42, 198–206 CrossRef CAS PubMed.
- C. Lee, S. Lee, M. Cho and Y. Lee, Microchim. Acta, 2016, 183, 3285–3292 CrossRef CAS.
- X. Liu, L. Luo, Y. Ding and D. Ye, Bioelectrochemistry, 2011, 82, 38–45 CrossRef CAS PubMed.
- T. Thomas, R. J. Mascarenhas, O. J. D. '. Souza, S. Detriche, Z. Mekhalif and P. Martis, Talanta, 2014, 125, 352–360 CrossRef CAS PubMed.
- S. Boonchiangma, S. Srijaranai, T. Tuntulani and W. Ngeontae, J. Appl. Polym. Sci., 2014, 131, 2928–2935 CrossRef.
- Q. Lian, Z. He, Q. He, A. Luo, K. Yan, D. Zhang, X. Lu and X. Zhou, Anal. Chim. Acta, 2014, 823, 32–39 CrossRef CAS PubMed.
- Z. H. Sheng, X. Q. Zheng, J. Y. Xu, W. J. Bao, F. B. Wang and X. H. Xia, Biosens. Bioelectron., 2012, 34, 125–131 CrossRef CAS PubMed.
- J. Li, D. Kuang, Y. Feng, F. Zhang, Z. Xu, M. Liu and D. Wang, Biosens. Bioelectron., 2013, 42, 198–206 CrossRef CAS PubMed.
- N. Chauhan, J. Narang and C. S. Pundir, Analyst, 2011, 136, 1938–1945 RSC.
- M. Shi, Z. Chen, L. Guo, X. Liang, J. Zhang, C. He, B. Wang and Y. Wu, J. Mater. Chem. B, 2014, 2, 4876–4882 RSC.
- S. S. L. Castro, V. R. Bxalbo, P. J. S. Barbeira and N. R. Stradiotto, Talanta, 2001, 55, 249–254 CrossRef CAS PubMed.
- R. Thangamuthu, Y. C. Wu and S. M. Chen, Electroanalysis, 2009, 21, 165–171 CrossRef CAS.
Footnotes |
| † Electronic supplementary information (ESI) available. See DOI: 10.1039/c6ra28805g |
| ‡ Junfeng Han and Yiju Li contributed equally to this work. |
|
| This journal is © The Royal Society of Chemistry 2017 |
Click here to see how this site uses Cookies. View our privacy policy here. 
 Open Access Article
 This Open Access Article is licensed under a
  a,
Kui Cheng
a,
Kui Cheng