 Open Access Article
Concentration-dependent spectroscopic properties and temperature sensing of YNbO4:Er3+ phosphors
Xin Wanga,
Xiangping Li *a,
Lihong Chenga,
Sai Xua,
Jiashi Suna,
Jinsu Zhanga,
Xizhen Zhanga,
Xiaotian Yangb and
Baojiu Chen*a
aDepartment of Physics, Dalian Maritime University, Dalian, Liaoning 116026, PR China. E-mail: lixp@dlmu.edu.cn; chenmbj@sohu.com
bJilin Provincial Key Laboratory of Architectural Electricity & Comprehensive Energy Saving, Jilin Jianzhu University, Changchun 130118, China
First published on 3rd May 2017
Abstract
A series of YNbO4:Er3+ phosphors with various Er3+ concentrations was synthesized via a traditional high temperature, solid-state reaction method. XRD Rietveld refinements based on the XRD data were carried out to study the phase purity and crystal structure of the as-prepared samples. The results revealed that single monoclinic phase YNbO4 phosphors were obtained. The influence of the Er3+ concentration on the spectroscopic properties and temperature sensing in YNbO4:Er3+ phosphors were systematically studied. Different quenching concentrations were found in down-conversion and up-conversion luminescence processes. From lasers working current dependent up-conversion luminescence spectra, it was confirmed that two and three photon processes were responsible for both the green and the red up-conversion emissions, respectively, excited by 980 and 1550 nm lasers, which have no apparent dependence on Er3+ ion concentration. However, the Er3+ concentration had significant influences on the temperature sensing sensitivity of Er3+ ions, and the results showed that YNbO4 phosphors doped with low concentrations of Er3+ ions had high temperature sensing sensitivity and could be applied in temperature detection applications, particularly in high temperature environments.
1. Introduction
In recent years, rare earth (RE) ion-doped, luminescent materials have received great interest due to their potential applications in several fields, such as display devices, solid-state lasers, sensors, and optoelectronic devices.1–4 The application of RE ion-doped luminescent materials, as optical temperature sensors, has become increasingly popular due to the fact that their non-contact temperature measurement is carried out by probing the temperature dependence of the fluorescence intensities ratio (FIR) from the two thermally coupled emitting energy levels. Real-time temperature detection can be achieved by analyzing the changes in the FIR values caused by the change in sample temperature.5 Compared with traditional temperature monitoring devices, the FIR technique for temperature measurement can effectively reduce the influence of measuring conditions and improve the temperature resolution.6–8 In order to obtain high temperature sensitivity using RE3+ as the temperature sensing units, the energy separation between the two emitting energy levels of RE3+ must be moderate. It should neither be too small (<200 cm−1) to avoid strong overlap of the two emissions nor too large (>2000 cm−1) to ensure the upper level possess enough population of optically active ions in a certain temperature range.9 Among a large number of RE3+ ions, Er3+ is expected to be an effective temperature sensing unit with high sensing sensitivity due to its two thermally coupled emitting energy levels 2H11/2 and 4S3/2, which have a proper energy gap of around 770 cm−1 and can obtain two significant green emissions.10Usually, fluorides are promising host materials for up-conversion (UC) luminescence due to their low phonon energy, which is beneficial to high UC luminescence efficiency. However, compared with fluorides, oxide matrix materials are much more suitable to be used in high temperature environments due to their good chemical and physical stabilities and have received extensive attention in recent years.11 Among various oxide matrixes, ANbO4 (A = La, Gd, Y) compounds with a fergusonite structure are good choices as the matrixes of UC luminescent phosphors due to their lower phonon frequencies than other oxide compounds.12–14 Recently, some investigations on the UC luminescence and temperature sensing properties of Er3+ in ANbO4 have been reported. B. N. Tian et al. pointed out that the UC luminescence intensity and temperature sensing sensitivity can be enhanced by introducing Mo6+ into a LuNbO4:Er3+ phosphor.15 Y. Y. Tian et al. reported that the Yb3+ concentration has a significant influence on the UC luminescence and temperature sensing behavior of Er3+ in Yb3+/Er3+ co-doped YNbO4.14 Singh et al. reported a dual mode Y0.977Yb0.02Er0.003NbO4 phosphor demonstrating both down-conversion (DC) and UC emission, and this type of phosphor could be an exceptional choice for next generation, luminescence-based, temperature sensing devices.16 However, Er3+ acts as a temperature sensing unit, and its doping concentration may have significant influences on the spectroscopic and temperature sensing properties in ANbO4. Therefore, it is necessary to conduct a study on the influence of Er3+ concentration on the spectroscopic and temperature sensing behavior of Er3+ in ANbO4 phosphors.
In this study, YNbO4:Er3+ phosphors with various Er3+ concentrations were prepared by a traditional high temperature solid-state reaction method. Er3+ concentration-dependent DC, UC luminescence and temperature sensing properties were systematically studied.
2. Experimental
A series of Y1−xErxNbO4 phosphors (x = 0.5, 1, 3, 5, 7, 9, 12, 15, 20, 30, 40, 60 and 80%, in molar) were synthesized via a traditional high temperature solid-state reaction method. First, the starting materials including Y2O3 (99.99%), Nb2O5 (99.99%) and Er2O3 (99.99%) were weighed according to a certain stoichiometric ratio, and then they were uniformly mixed in an agate mortar. Furthermore, the mixture was delivered into a crucible, it was put into a muffle furnace and calcined at 1300 °C for 4 h. Last, the final products were obtained after the furnace naturally cooled to room temperature.17The crystal structures of the samples were analyzed on a Shimadzu XRD-6000 diffractometer (Japan) equipped with Cu Kα1 as the radiation source (λ = 0.15406 nm). Both UC and DC luminescence spectra were measured using a Hitachi F-4600 spectrophotometer. The former measurements were achieved using two externally introduced lasers with wavelengths of 980 and 1550 nm, but the latter one was performed with the spectrophotometer built-in excitation source (150 W xenon lamp). The sample temperatures were controlled by a self-manufactured temperature control system, DMU TC-450, with a controlling accuracy of about ±0.5 °C.
3. Results and discussion
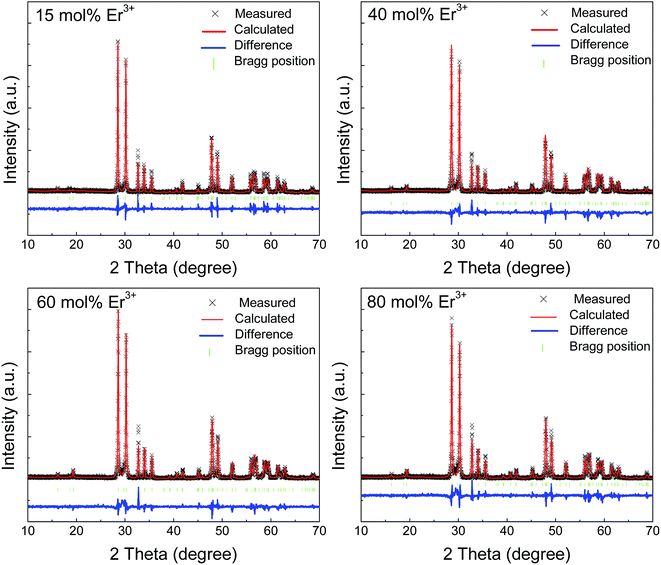
In order to identify the crystal structure of the final products, XRD measurements were performed on all the samples, and all of them almost had the same diffraction patterns. Fig. 1 shows the XRD patterns of x mol% Er3+-doped YNbO4 (x = 15, 40, 60 and 80) as representatives. In order to better study the effect of Er3+ doping on the crystal structure of YNbO4, a Rietveld refinement procedure was carried out with a non-commercial software, GSAS.18,19 In the fitting process, the crystallographic data of monoclinic YNbO4 (space group of C2/c (15), see JPCDS card no. 83-1319) were used as the initial crystal structure model. The measured, calculated results, Bragg position, and the difference between experimental and theoretical diffraction patterns are also shown in Fig. 1. It can be seen that all the diffraction peaks in the experimental data can be fitted well by the Rietveld theoretical model, and the differences between experimental and theoretical data seem to be acceptable. The cell parameters and the Rietveld refinement results are shown in Table 1, which demonstrate that all the observed diffraction peaks satisfy the reflection conditions, and our as-prepared samples are of single monoclinic phase.| Formula | Y0.85Er0.15NbO4 | Y0.6Er0.4NbO4 | Y0.4Er0.6NbO4 | Y0.2Er0.8NbO4 |
| Radiation type | Cu Kα1 radiation with λ = 1.5406 Å | |||
| 2θ range | 10–70° | |||
| Symmetry | Monoclinic system | |||
| Space group | C2/c (15) | |||
| Cell parameters | a = 7.608 Å | a = 7.602 Å | a = 7.598 Å | a = 7.588 Å |
| b = 10.934 Å | b = 10.922 Å | b = 10.916 Å | b = 10.905 Å | |
| c = 5.291 Å | c = 5.285 Å | c = 5.281 Å | c = 5.275 Å | |
| α = γ = 90° | α = γ = 90° | α = γ = 90° | α = γ = 90° | |
| β = 138.416° | β = 138.389° | β = 138.370° | β = 138.357° | |
| V = 292.131 Å3 | V = 291.430 Å3 | V = 290.958 Å3 | V = 290.057 Å3 | |
| Reliability factors | χ2 = 1.744 | χ2 = 2.196 | χ2 = 2.003 | χ2 = 2.304 |
| Rwp = 21.69% | Rwp = 22.69%, | Rwp = 21.07% | Rwp = 22.27% | |
| Rp = 15.37% | Rp = 15.99% | Rp = 14.31% | Rp = 15.62% | |
Fig. 2 shows the excitation spectra of YNbO4 samples doped with various Er3+ concentrations monitored at a 555 nm emission corresponding to the 4S3/2 → 4I15/2 transition of Er3+. As can be seen, each spectrum comprises of two parts. One is a broad band ranging from 200 to 300 nm corresponding to the absorption of NbO44−.20 Another part is composed of some narrow peaks belonging to the characteristic f–f transitions of Er3+ from the ground state 4I15/2 level to the excited state levels 4G11/2, 2H9/2, 4F3/2, 4F5/2, 4F7/2 and 2H11/2, respectively. It is noteworthy that the excitation intensity of NbO44− is a little stronger than that of the strongest f–f transition of Er3+, indicating that there is an effective energy transfer from the host matrix to Er3+.
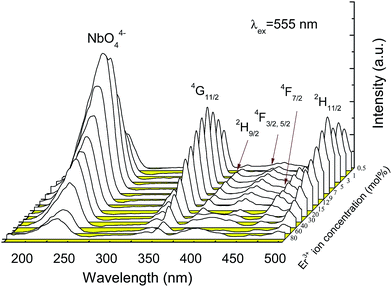 | ||
| Fig. 2 Excitation spectra of YNbO4 samples doped with various Er3+ concentrations by monitoring the 555 nm emission. | ||
Fig. 3 shows the emission spectra of YNbO4 samples doped with various Er3+ concentrations measured under 379, 980 and 1550 nm excitations. From Fig. 3(a), it can be found that two green emissions, which originate from the characteristic transitions (2H11/2, 4S3/2) → 4I15/2 of Er3+, dominate the whole DC spectra, together with a weak red emission centered at around 657 nm corresponding to the 4F9/2 → 4I15/2 transition of Er3+.10 Moreover, it can also be found that with an increase in the Er3+ concentration, the green emission intensities first increase and reach their maximum values at around 5 mol% of Er3+, and then decline with further increases in Er3+ concentration, indicating the occurrence of concentration-based quenching.21
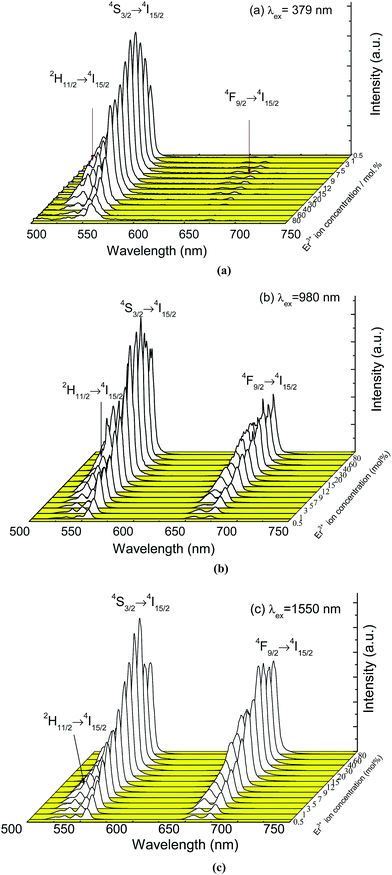 | ||
| Fig. 3 Emission spectra of YNbO4 samples doped with various Er3+ concentrations excited at 379 nm (a) and 980 nm (b) and 1550 nm (c). | ||
As can be seen from the UC luminescence spectra excited by 980 and 1550 nm lasers (Fig. 3(b) and (c)), strong green and red UC emissions were both observed. Moreover, the intensities of the green and the red emissions first dramatically increased as the concentration of Er3+ increased, and the intensities decreased when the Er3+ concentration was greater than 40 mol%, implying the occurrence of concentration-based quenching in the UC luminescence processes. At higher doping concentrations of Er3+, the interaction between Er3+ was enhanced due to a decrease in the interionic distance, which induced an increase in the non radiative relaxation rate, which resulted in the quenching of luminescence under both DC and UC luminescence processes.
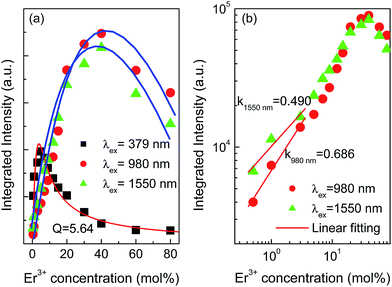
The quenching concentration is usually defined as a concentration at which the maximum luminescence intensity can be achieved. It should be noted that the quenching concentrations for the DC and UC luminescence processes were greatly different, which can be ascribed to the different excitation pathways and population routes.22 For the concentration quenching process of DC luminescence, Van Uitert developed a model to describe the relationship between the luminescent intensity and the doping concentration of the luminescent center, which can be expressed as follows:23
| I(C) = C/k[1 + βCQ/3] | (1) |
Comparing the three sets of luminescence spectra shown in Fig. 3, it can also be found that the relative intensity of the green and the red emissions are significantly different. For the DC luminescence process, when pumped by 379 nm, the electrons first populate the higher energy level 4G11/2 of Er3+ and then nonradiatively relax to the lower 2H11/2 and 4S3/2 levels, from which the electrons further radiative transit to the ground state 4I15/2 level and achieve green emissions, which can be seen in Fig. 5. In addition, some electrons at 2H11/2 and 4S3/2 levels may further relax to the 4F9/2 level and exhibit a red emission. However, these emission levels can be populated by phonon-assisted, multi-photon absorption in the UC luminescence processes excited by both 980 and 1550 nm infrared wavelengths. Particularly, the population of the 4F9/2 level can be achieved much more effectively than that of the excitation at 379 nm. Consequently, much stronger red emissions were obtained under both 980 and 1550 nm excitations than under 379 nm excitation.
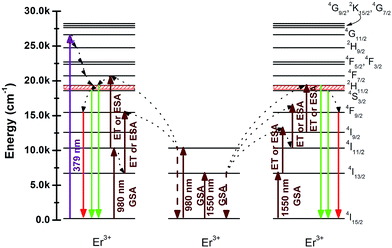 | ||
| Fig. 5 Energy level diagrams of Er3+ and the possible DC and UC luminescence mechanisms of YNbO4:Er3+ samples under 379 nm and 980, 1550 nm excitations. | ||
In order to further explore the UC luminescent mechanism, laser working current dependent UC luminescence spectra were measured. Fig. 6(a) and (b) display the integrated green and red UC luminescence intensities of the as-prepared YNbO4:x mol% Er3+ (x = 5, 15, 40) phosphors at different laser working currents under 980 and 1550 nm excitations. As is well-known, the number of the photons (n), which take part in the multi-photon absorption UC luminescence processes, can be determined from the dependence of the luminescence intensity (Iup) on the laser working current (iLD), which fulfills Iup ∝ (aiLD − b)n, where a and b are exponential constants.24 The integrated green and red UC emission intensities were fitted to this relation, and the n values for the two UC emissions derived from the fitting processes are shown in Fig. 6. It can be seen that whether the Er3+ concentration is high or low, n values of 2 were obtained at an excitation of 980 nm for both the green and the red UC emissions, and 3 photons were needed for both the green and the red UC emissions under 1550 nm excitation. The little differences for those values may be caused due to the calculated error of the integrated intensity and from the fitting process. This means that two-photon and three-photon processes were respectively dominated in the UC luminescent processes when excited at 980 and 1550 nm in YNbO4:Er3+ phosphors. Moreover, the Er3+ doping concentration had no significant influence on the UC luminescence processes for both 980 nm and 1550 nm excitations. The different number of photons under 980 and 1550 nm excitations can be ascribed to the different UC luminescence mechanisms. The possible mechanisms for the UC emissions in YNbO4:Er3+ samples excited at 980 nm and 1550 nm are shown in the schematic energy level diagrams of Er3+ ions (Fig. 5).
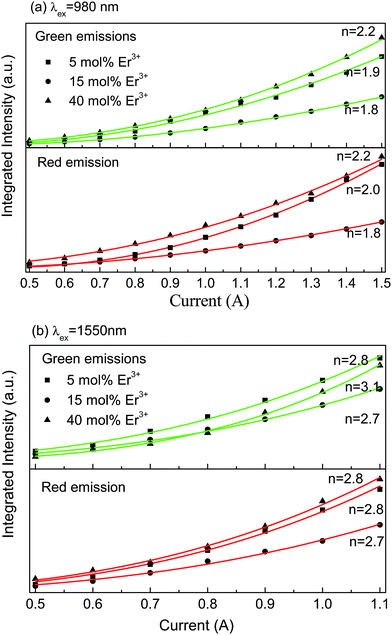 | ||
| Fig. 6 The relationship between the integrated UC luminescence intensities and laser working current under 980 nm (a) and 1550 nm (b) laser excitations. | ||
It should be noted that the green and red UC emissions mainly originated from both the energy transfer (ET) between Er3+ and the excited state absorption (ESA) of Er3+. Under an excitation of 980 nm, Er3+ was first excited from the ground state 4I15/2 level to the 4I11/2 level by absorbing one 980 nm photon, namely GSA: 4I15/2 + a photon → 4I11/2. Then, this Er3+ may transfer its energy to another Er3+ (ET process) in the 4I11/2 level or absorb another 980 nm photon (ESA process), thus resulting in the population of 4F7/2 level of Er3+. Then, the Er3+ in 4F7/2 level non radiatively relaxes to the 2H11/2 levels (4F7/2 → 2H11/2 + phonons). Finally the green emissions from 2H11/2 and 4S3/2 levels can be achieved ((2H11/2, 4S3/2) → 4I15/2 + photon) because 2H11/2 and 4S3/2 levels exist in thermal equilibrium. In addition, the excited Er3+ in 4I11/2 level can also non radiatively relaxes to the 4I13/2 level via a multi-phonon relaxation process due to the small distance in energy between these two energy levels. The Er3+ in the 4I13/2 level can accept the energy from another Er3+ in 4I11/2 via an ET process or an ESA process to get into 4F9/2 level, and then the red emission can be achieved through a 4F9/2 → 4I15/2 transition.25 These population and radiation processes are depicted on the left hand side of Fig. 5.
For the 1550 nm excitation, both the green and the red UC emissions must absorb three 1550 nm photons. The population processes are clearly shown on the right hand side of Fig. 5. When excited at 1550 nm, the Er3+ in the ground state 4I15/2 level is first excited to the 4I13/2 level via a GSA process, and the 2H11/2 and 4S3/2 levels can be populated via an ET or ESA processes (right hand side of Fig. 5), thus yielding the green emissions.26 The population of the 4F9/2 level strongly influences the red UC emission. The possible population approach is that the Er3+ in the 4I9/2 level nonradiatively relaxes to the 4I11/2 level, and then goes to the 4F9/2 level via an ET or an ESA process. Therefore, the red UC emission could be achieved when Er3+ radiatively transits to the ground state 4I15/2 level.
It is needless to say that the interaction between Er3+ in Er3+ mono-doped samples is weak when the Er3+ doping concentration is low. Therefore, the ESA process is probably the main mechanism for UC emissions of Er3+. In this case, UC luminescent intensity would be proportional to the doping concentration of Er3+. To clarify the UC mechanism for our samples doped with low Er3+ concentrations, Er3+ concentration-dependent, UC intensity is plotted in a double logarithm coordinates system as shown in Fig. 4(b), and the data obtained under 980 and 1550 nm excitations in the low Er3+ concentration region are fitted to a linear function. The slopes from the fitting processes were lower than 1 (0.686 for 980 nm excitation and 0.490 for 1550 nm excitation), implying that there was not only one Er3+ involved in the UC luminescence process, but two or more Er3+ contributed to the UC emissions in both 980 and 1550 nm excitations. That is to say, there are obvious interactions (ETs) between Er3+, but not only the ESA process is in charge of the UC luminescence even at low Er3+ doping concentrations.
Usually, the temperature has a big influence on the spectroscopic properties of both DC and UC luminescent materials. Moreover, the thermal stability of the spectroscopic properties of phosphors is extremely essential to assess the performance of the luminescent materials since the materials may be used in a high temperature environment. Temperature-dependent, DC luminescence properties of YNbO4:Er3+ phosphors were systematically investigated in this study. Fig. 7 shows the temperature dependence of DC emission spectra of YNbO4:x mol% Er3+ (x = 3, 9, 15, 30) samples as representatives, which were measured in the temperature region ranging from 20 °C to 450 °C. As shown in Fig. 7, two sets of clear green emissions originating from (2H11/2, 4S3/2) → 4I15/2 of Er3+ were observed, and with an increase in sample temperature, their peak positions remained almost the same, but their relative intensities and changing trends were quite different from each other. It can be seen that in the two sets of emission spectra, the intensities of the green emission originated from the 4S3/2 → 4I15/2 transition both decreased monotonically with an increase in temperature, clearly implying a thermal quenching behavior. In contrast, the intensities of the green emission first came from the 2H11/2 → 4I15/2 transition and slightly increased, then remain almost unchanged. The different trends in variation for these two green emissions indicated an increase in the thermal population rate from the 4S3/2 level to 2H11/2 level at higher temperatures. However, the intensity ratio of the two green emissions had different trends with any green emission. Fig. 8 shows the dependences of the FIR values (R, IH/IS) of these two green emissions on temperature for YNbO4:x mol% Er3+ (x = 3, 9, 15, 30) phosphors, where IH and IS are the fluorescence intensities from 2H11/2 → 4I15/2 and 4S3/2 → 4I15/2 transitions, respectively. It can be clearly seen that the ratio of these two green emissions monotonically increased with an increase in temperature.
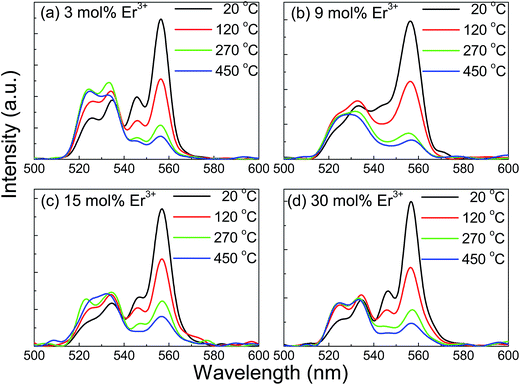 | ||
| Fig. 7 Temperature dependent DC emission spectra for YNbO4:x mol%Er3+ (x = 3, 9, 15, 30) under 379 nm excitation. | ||
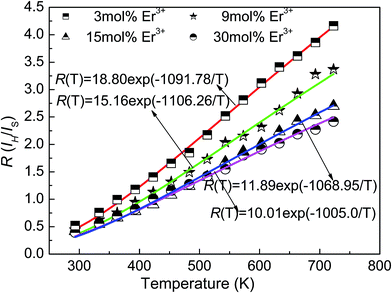 | ||
| Fig. 8 Dependences of the FIR values (R, IH/IS) of the two green emissions on temperature for YNbO4:x mol% Er3+ (x = 3, 9, 15, 30) phosphors. | ||
The energy distance between 2H11/2 and 4S3/2 levels was small, and they existed in a state of thermal equilibrium; thus their populations followed the Boltzmann distribution.25 The value of R for the two green emissions was a temperature dependent variable, and the relationship between them can be expressed as follows:
| R(T) = IH/IS = Aexp(−ΔE/kT) | (2) |
To assess the optical temperature sensing ability of the studied samples, it was crucial to determine the temperature sensing sensitivity, which is usually defined as the change in rate of R per unit temperature and can be expressed as follows:28
| S(T) = dR(T)/d(T) = Aexp(−ΔE/kT)(ΔE/kT2) | (3) |
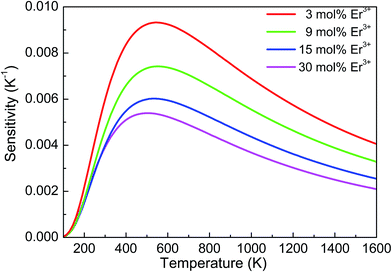
By taking the above-derived values of C and ΔE/k into eqn (3), the sensitivity function S(T) versus T for the studied samples was derived and are shown in Fig. 9 from 100–1600 K. It can be seen that the sensitivity curves of the four samples have the same change in trend. With an increase in temperature, the sensitivity first increases and reaches a maximum value and then slowly decreases with further increasing temperature. In addition, the sensitivity of the sample with lower Er3+ doping concentration was larger than that of high Er3+ concentration doping. When the Er3+ doping concentration was 3 mol%, the maximum sensitivity (Smax) reached 93 × 10−4 K−1 at 554 K. However, the maximum value of 30 mol% Er3+-doped sample was only 54 × 10−4 K−1 at 509 K. A similar phenomenon was found in NaGdTiO4:Er3+/Yb3+ phosphors in our earlier study, which was ascribed to the different optical transition rate of Er3+ in various Er3+ doped samples based upon the results of absorption spectra.20 Table 2 shows the comparison of the maximum sensitivity for Er3+ in some different host materials.14,16,29–34 It can be seen that the sensitivity of Er3+ obtained in this study was a little higher than most of the sensitivities reported in other Er3+-doped host materials, implying that YNbO4:Er3+ phosphors may have potential applications as optical temperature sensors. Moreover, because YNbO4:Er3+ phosphors have good thermal stability (the firing temperature was as high as 1300 °C, and its crystal structure can be stable at a such high temperature), it may be a good candidate for temperature sensing in high temperature environments.
| Host material | Maximum sensitivity (10−4 K−1) | Temperature (K) | Ref. |
|---|---|---|---|
| YNbO4 phosphors | 93 | 554 | This work |
| YNbO4 nanoparticles | 72 | 406 | 14 |
| YNbO4 phosphors | 73 | 472 | 16 |
| Chalcogenide glass | 102 | 493 | 27 |
| ZnO-nanocrystals | 62 | 443 | 28 |
| Fluorindate glass | 54 | 547 | 29 |
| Silicate glass | 23 | 296 | 30 |
| PLZT glass-ceramic | 19 | 556 | 31 |
| Fluorozirconate glass | 6 | 300 | 32 |
4. Conclusions
In summary, the YNbO4 phosphors with various Er3+ concentrations were successfully synthesized via a traditional high temperature solid-state reaction method. The crystal structure of the phosphors was identified by XRD, and single-phase YNbO4 phosphors were obtained. The relative intensity of the green and the red emissions was significantly different in DC and UC luminescence processes, which can be ascribed to the different populated routes and pumped conditions. The quenching process of the green emissions from Er3+ in the DC luminescence process was well explained by the Van model, and the electric dipole–dipole interaction was confirmed to be responsible for the quenching behavior. According to the laser working current dependent UC luminescence spectra, it was confirmed that two and three photon absorption processes were involved in both of the green and red UC luminescence, respectively, irradiated by 980 and 1550 nm infrared wavelengths. Er3+ concentration dependent temperature sensing properties of YNbO4:Er3+ samples were studied, and the temperature sensing curves were obtained by analyzing the temperature-dependent DC luminescence spectra. It was found that the sample with low Er3+ doping concentration had a high temperature sensitivity.Acknowledgements
This study was partially supported by the NSFC (National Natural Science Foundation of China, Grant Nos. 11104023, 11374044 and 51672103), the Natural Science Foundation of Liaoning Province (No. 2015020190), the High-level personnel in Dalian innovation support program (2016RQ037), the Open Fund of the State Key Laboratory on Integrated Optoelectronics (IOSKL2015KF27) and the Fundamental Research Funds for the Central Universities (Grant Nos. 3132017056 and 3132016333).References
- Z. Chen, X. W. Zhang, S. F. Zeng, Z. J. Liu, Z. J. Ma, G. P. Dong, S. F. Zhou, X. F. Liu and J. R. Qiu, Appl. Phys. Express, 2015, 8, 032301–032305 CrossRef CAS.
- Y. Q. Qu, X. G. Kong, Y. J. Sun, Q. H. Zeng and H. Zhang, J. Alloys Compd., 2009, 19, 493–496 CrossRef.
- F. Wang, Y. Han, C. S. Lim, Y. H. Lu, J. Wang, J. Xu, H. Y. Chen, C. Zhang, M. H. Hong and X. G. Liu, Nature, 2010, 463, 1061–1065 CrossRef CAS PubMed.
- X. Y. Huang, S. Y. Han, W. Hu and X. G. Liu, Chem. Soc. Rev., 2013, 42, 173–201 RSC.
- W. Yu, W. Xu, H. W. Song and S. Zhang, Dalton Trans., 2014, 43, 6139–6147 RSC.
- W. Xu, Z. G. Zhang and W. W. Cao, Opt. Lett., 2012, 37, 4865–4867 CrossRef CAS PubMed.
- H. Zheng, S. Y. Xiang and B. J. Chen, Chin. J. Lumin., 2014, 35, 800–806 CrossRef CAS.
- D. Jaque and F. Vetrone, Nanoscale, 2012, 4, 4301–4326 RSC.
- S. F. León-Luis, U. R. Rodríguez-Mendoza, E. Lalla and V. Lavín, Sens. Actuators, B, 2011, 158, 208–213 CrossRef.
- T. Yue, B. N. Tian, C. Cui, P. Huang, L. Wang and B. J. Chen, RSC Adv., 2015, 5, 14123–14128 RSC.
- R. Calderon-Villajos, C. Zaldo and C. Cascales, Nanotechnology, 2012, 23, 3847–3856 CrossRef PubMed.
- Y. Y. Zhou, Q. Ma, M. K. Lu, Z. F. Qiu and A. Y. Zhang, J. Phys. Chem., 2008, 112, 19901–19907 CAS.
- A. Dwivedi, A. K. Sinqh and S. B. Rai, Dalton Trans., 2014, 43, 15906–15914 RSC.
- Y. Y. Tian, Y. Tian, P. Huang, L. Wang, Q. F. Shi and C. Cui, Chem. Eng. J., 2016, 297, 26–34 CrossRef CAS.
- B. N. Tian, B. J. Chen, J. S. Sun, X. P. Li, J. S. Zhang and R. N. Hua, Mater. Res. Express, 2016, 3, 116201 CrossRef.
- A. K. Singh, S. K. Singh, B. K. Gupta, R. Prakash and S. B. Rai, Dalton Trans., 2013, 42, 1065 RSC.
- H. Zhong, X. P. Li, R. S. Shen, J. S. Zhang, J. S. Sun, H. Y. Zhong, L. H. Cheng, Y. Tian and B. J. Chen, J. Alloys Compd., 2012, 15, 170–175 CrossRef.
- A. C. Larson and R. B. Von Dreele, Los Alamos National Laboratory Report LAUR, 1994, pp. 86–748 Search PubMed.
- B. H. Toby, J. Appl. Crystallogr., 2001, 34, 210 CrossRef CAS.
- J. Bang, M. Abboudi, B. Abrams and P. H. Holloway, J. Lumin., 2004, 106, 177–185 CrossRef CAS.
- X. P. Li, X. Wang, H. Zhong, L. H. Cheng, S. Xu, J. S. Sun, J. S. Zhang, X. J. Li, L. L. Tong and B. J. Chen, Ceram. Int., 2016, 42, 14710–14715 CrossRef CAS.
- J. J. Li, J. S. Sun, J. T. Liu, X. P. Li, J. S. Zhang, Y. Tian, S. B. Fu, L. H. Cheng, H. Y. Zhong, H. P. Xia and B. J. Chen, Mater. Res. Bull., 2013, 48, 2159–2165 CrossRef CAS.
- U. Van, J. Electrochem. Soc., 1967, 114, 1048–1053 CrossRef.
- H. M. Noh, H. K. Yang, B. K. Moon, B. C. Choi, J. H. Jeong, H. Choi and J. H. Kim, J. Appl. Phys., 2013, 52, 765–773 Search PubMed.
- K. Annapoorani, N. S. Murthy, T. R. Ravindran and K. Marimuthu, J. Lumin., 2016, 171, 19–26 CrossRef CAS.
- Y. Fu, Y. Shi, N. Zhang, Y. Tian, M. M. Xing and X. X. Luo, Mater. Res. Bull., 2016, 84, 346–349 CrossRef CAS.
- Y. Shen, X. Wang, H. C. He, Y. H. Lin and C. W. Nan, Sci. Technol., 2012, 5, 1008–1011 Search PubMed.
- G. Tripathi, V. K. Rai and S. B. Rai, Opt. Mater., 2007, 8, 201–206 CrossRef.
- P. V. dos Santos, M. T. de Araujo, A. S. Gouveria-Neto, J. A. Medeiros Neto and A. S. B. Sombra, IEEE J. Quantum Electron., 1999, 35, 395–399 CrossRef CAS.
- X. Wang, X. G. Kong, Y. Yu, Y. J. Sun and H. Zhang, J. Phys. Chem. C, 2007, 111, 15119–15124 CAS.
- S. F. León-Luis, U. R. Rodríguez-Mendoza, E. Lalla and V. Lavín, Sens. Actuators, B, 2011, 11, 208–213 CrossRef.
- C. R. Li, B. Dong, C. G. Ming and M. K. Lei, Sensors, 2007, 7, 2652–2659 CrossRef CAS.
- A. Camargo, J. F. Possatto, L. Nunes, E. R. Botero, E. R. M. Andreeta, D. Garcia and J. A. Eiras, Solid State Commun., 2006, 137, 1–5 CrossRef.
- Z. P. Cai, H. Y. Xu, P. Feron, M. Mortier and G. Stephan, Sens. Actuators, A, 2003, 65, 187–192 CrossRef.
| This journal is © The Royal Society of Chemistry 2017 |

