 Open Access Article
Ring-opening polymerization of ethylene carbonate: comprehensive structural elucidation by 1D & 2D-NMR techniques, and selectivity analysis
Rubina Abdul-Karim,
Abdul Hameed and
Muhammad Imran Malik *
*
H. E. J. Research Institute of Chemistry, International Centre for Chemical and Biological Sciences (ICCBS), University of Karachi, 75270 Karachi, Pakistan. E-mail: mimran.malik@iccs.edu
First published on 16th February 2017
Abstract
Ring-opening polymerization (ROP) of ethylene carbonate (EC) is associated with the emission of carbon dioxide during polymerization, which results in polymer chains containing ether linkages besides targeted carbonate linkages. In this study, ethylene carbonate is polymerized by ring-opening polymerization in the presence of sodium stannate trihydrate as a heterogeneous transesterification catalyst. Comprehensive structural analysis of the products is conducted by advanced one-dimensional (1H & 13C) and two-dimensional nuclear magnetic resonance (NMR) techniques (COSY, HSQC and HMBC). MALDI-TOF MS analysis is also conducted to support the results obtained by the advanced NMR techniques. Conversion and average ratio of carbonate to ether linkages of the polymer chains are quantified by 1H-NMR. Molar mass progression is evaluated by size exclusion chromatography. Finally, selectivity of polymerization conditions for molar mass and dispersity, conversion, and average ether content are evaluated by varying the temperature, catalyst content, monomer to initiator ratio and polymerization solvent.
1. Introduction
Biodegradable polymers have attracted great attention from the scientific community because of their extensive applications in biomedical fields, such as drug delivery, designing of artificial human tissues and organ repair etc.1–6 Aliphatic polycarbonates (APCs) are one of very important class of biodegradable polymers owing to their excellent optical, thermal, and mechanical properties alongside their non-toxicity, biodegradability, and biocompatibility.7–9 Aliphatic polycarbonates are extensively used in the advancement of synthetic degradable polymers that are employed in automotives, aircrafts, electronics, and construction and biomedical materials as well as in the polyurethane and surfactant industry.Inherently staggering application properties and biocompatibility of APCs are also accompanied by non-acid biodegradation products in vivo.10–13 Furthermore, the degradation rate of polycarbonates is lower than that of polyesters, a prerequisite for applications requiring long-term availability in the body.14–16 Properties of the polymers have a direct correlation with their synthesis methods.
Low to fairly high molar mass polycarbonates with narrow molar mass distributions can be prepared by ring-opening polymerization (ROP) of cyclic carbonates via cationic, anionic, coordinated, or enzymatic catalysis.17–21,29 Among several cyclic carbonates, ethylene carbonate and propylene carbonate have been used as inert solvent at lower temperature, and as reactive reagent at high temperature. Both ethylene carbonate and propylene carbonate are biodegradable, have high boiling and flash points, low toxicities, low odour levels and evaporation rates.22,23 They are synthesized by reaction of carbon dioxide with ethylene oxide or propylene oxide, therefore, are economically feasible.24–26
High polymerization enthalpy of ethylene carbonate (125.6 kJ mol−1) makes it impossible to synthesize pure poly(ethylene carbonate). Polymerization of ethylene carbonate at high temperature generally result in a copolymer comprising of ether linkages alongside targeted carbonate linkages, due to formation of carbon dioxide during polymerization. Decarboxylation during polymerization makes this reaction thermodynamically feasible by increasing entropy of the polymerization.27
Ring-opening polymerization of EC by several different catalysts has been reported.17 All the catalysts used for polymerization of ethylene carbonate result in the copolymers having different content of ether and carbonate linkages. Polymerization by lewis acids or transesterification catalyst (metal alkoxides of tin, zirconium, and metal acetylacetonates) produces copolymers that contain about 40–50% ethylene carbonate units along with unwanted ethylene oxide units.31–33,35 Carbonate linkages of the copolymers decrease further in the products synthesized by basic catalysts (KOH, CH3OK, NaI, and NaCl etc.) to only about 10–20%.27,34,36,37 Alternative ether and carbonate linkages in the copolymers and presence of 1,4,6,9-tetraoxaspiro[4.4]nonane intermediate has been shown in Al(acac)3 or Ti(OBu)4 catalyzed EC polymerizations.28 Major hydrolysis by-product of ethylene carbonate polymerization by organometallic catalysis is diethylene glycol. Relative content of carbonate to ether linkages decreases with increase of the alkalinity of the catalyst.27,32 Heterogeneous catalysis by using sodium stannate trihydrate has been reported for ethylene carbonate polymerization by Harris and McDonald.30,31 Presence of 2-hydroxyethylcarbonate and 2-hydroxyethylether and diethylene glycol in the reaction mixture was noticed. Ionic ring-opening polymerization of ethylene carbonate also result in a copolymer with different relative amounts of carbonate and ether linkages.33,34 The polymer synthesized by ROP of EC contains both ether and carbonate linkages, therefore, it is referred as poly(ethylene ether-carbonate), PEEC, in the proceeding text.
In this study, we report on the ring-opening polymerization of ethylene carbonate by using sodium stannate trihydrate as a heterogeneous transesterification catalyst. The main target of this study is to analyze the molecular structure of poly(ethylene ether-carbonate), PEEC, by advanced 1D and 2D-NMR spectroscopic techniques such as 1H, 13C, 1H–1H COSY (homonuclear correlation spectroscopy), 1H–13C HMQC (heteronuclear multiple-quantum correlation), 1H–13C HMBC (heteronuclear multiple-bond correlation), and MALDI-TOF mass spectrometry. Optimization of reaction conditions with regard to conversion, molar mass propagation and relative amount of carbonate linkages was conducted. Selectivity of polymerization with respect to polymerization temperature, catalyst concentration, monomer to initiator ratio, and polymerization solvent is evaluated.
This is first paper of the series of the project targeted to synthesize novel, amphiphilic and biodegradable block copolymers based on PEEC as hydrophobic segment for drug delivery and other biological applications. Optimization of polymerization conditions and meticulous structure elucidation of individual PEEC block is imperative for development of real structure–property correlations of the block copolymers. Several papers addressing synthesis, characterization, self-assembly behaviour, and their applications in drug delivery are in line to be published in due course of time.
2. Experimental
2.1. Materials
Ethylene carbonate-99% extra pure (Daejung, Korea), diethylene glycol-99% (Scharlau, Spain), Sodium Stannate trihydrate-95% (Sigma Aldrich, USA) were used as received. Solvents for synthesis such as 1,4-dioxane-99.5%, toluene-99.5% (Merck, Germany), dimethylformamide-99.8%, dichloromethane-99.8%, tetrahydrofuran-99.9% (RCI Labscan, Thailand), acetonitrile-99.9%, acetone-99.9% (Fisher Scientific, USA), and benzene-99.5% (Sigma-Aldrich, Germany) were used as received. HPLC grade chloroform-99.8% (RCI Labscan, Thailand) was used for size exclusion chromatography.2.2. Polymerization
Ring-opening polymerization of EC was conducted in a three necked round bottom flask that is equipped with a magnetic stir bar, a thermometer, and an evacuating/purging assembly. Calculated amounts of diethylene glycol (initiator), sodium stannate trihydrate (catalyst) and ethylene carbonate (monomer) were added in an oven-dried flask that is subjected to three evacuation and purging cycle, to attain inert atmosphere. The polymerization was then conducted at high temperature for required time. The polymers were used directly for analysis without any further purification. For the synthesis of PEEC-5K 0.106 g (1 mmol) of DEG, 4.4 g (50 mmol) of EC, and 0.022 g (0.5 wt% of monomer) of sodium stannate trihydrate (catalyst) were taken in a 10 mL round bottom flask and polymerized at 175 °C for 10 hours. The variations in the quantity of reagents, and polymerization conditions for selectivity analysis are given in the corresponding section.2.3. Characterization
Dithranol (30 mg mL−1), analyte (5 mg mL−1), sodium trifluoroacetate (20 mg mL−1) in THF were mixed in a ratio of 1![[thin space (1/6-em)]](https://www.rsc.org/images/entities/char_2009.gif) :
:![[thin space (1/6-em)]](https://www.rsc.org/images/entities/char_2009.gif) 10
10![[thin space (1/6-em)]](https://www.rsc.org/images/entities/char_2009.gif) :
:![[thin space (1/6-em)]](https://www.rsc.org/images/entities/char_2009.gif) 1 (v/v/v). 0.5 mL of the resulting mixture were deposited on the stainless steel sample plate and is allowed to dry in air.
1 (v/v/v). 0.5 mL of the resulting mixture were deposited on the stainless steel sample plate and is allowed to dry in air.
3. Results and discussion
3.1. Synthesis of poly(ethylene ether carbonate)
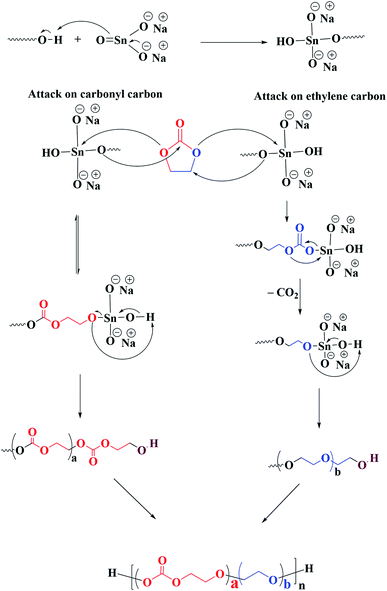
Ring opening polymerization of ethylene carbonate is associated with several side reactions that lead to ether linkages alongside targeted carbonate linkages in the polymer chain.27,31,33–37,39–41 The proposed mechanism of ring-opening polymerization of EC by heterogeneous transesterification catalyst sodium stannate trihyrate is shown in Scheme 1. The chain propagation reaction in ROP of EC proceeds by two different mechanisms: attack on the carbonyl carbon and attack on the ethylene carbon.33,42,43 The chain propagation by attack on the carbonyl carbon is kinetically favourable, however, reversible. The positive enthalpy of this propagation step makes it unlikely to happen exclusively, therefore, it is almost impossible to synthesize pure poly(ethylene carbonate).27 On the other hand, the attack on the ethylene carbon is irreversible due to removal of carbon dioxide. The propagation by latter mechanism leads to formation of ethylene ether units in the polymer chain. The final product is the result of the competition between these two propagation mechanisms, hence, contains both ethylene carbonate and ethylene ether units. Scheme 2 displays the ROP of EC by using DEG as initiator and sodium stannate trihydrate as catalyst, the polymer chains contain both ether and carbonate units. | ||
| Scheme 2 ROP of EC by using DEG as initiator and sodium stannate trihydrate as catalyst resulting in polymer chains that contain both ether and carbonate linkages. | ||
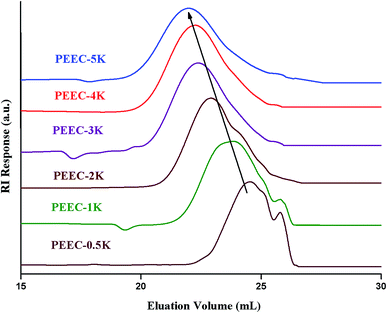
The first question when synthesizing new polymers is the rational propagation of the molar mass. Size exclusion chromatography is the most widely used technique for this purpose. As can be seen in Fig. 1, the elution volume decreased with the increase of the molar mass. The naming of various products in the figure is according to relative monomer to initiator ratio (targeted molar mass).
3.2. Structural elucidation of poly(ethylene ether-carbonate) by NMR spectroscopy
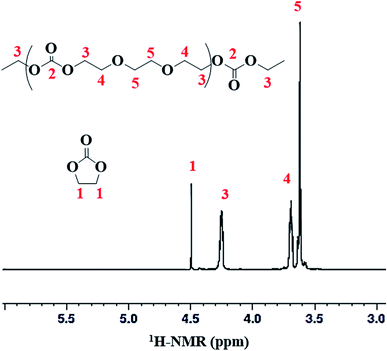
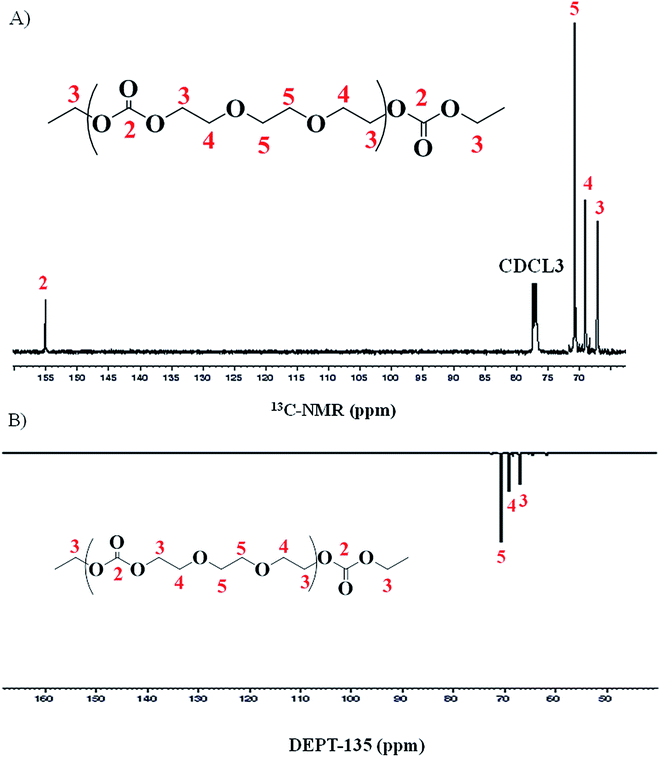
Structural characterization of poly(ethylene ether-carbonate) is performed by advanced techniques of NMR spectroscopy. The 1H-NMR spectrum of polymer is shown in Fig. 2, where a singlet at δ 4.49 ppm corresponds to the monomer, ethylene carbonate. The other three signals confirm the polymer formation bearing three different types of protons in the polymer chain. The peak-3 at δ 4.25 ppm corresponds to the methylene protons (CH2-3) adjacent to the carbonate moiety. The peak-4 and 5 at δ 3.69 ppm and δ 3.62 ppm correspond to methylene protons adjacent to the ether linkages (CH2-4 and CH2-5) (Fig. 2). These signals serve to determine the relative amount of carbonate and ether linkages in the synthesized polymer.For detailed structural elucidation of the polymers, 13C-NMR and two-dimensional NMR techniques were employed. 13C-NMR spectrum of polymer presents four characteristic carbon signals, Fig. 3A. 13C-NMR signal at δ 66.9 ppm belongs to carbon atoms (CH2-3) adjacent to carbonate group, while the peak at δ 68.6 ppm correspond to the carbon atoms (CH2-4) adjacent to CH2-3. Carbon atoms (CH2-5) between the ether–ether linkages appear at δ 70.5 ppm. Highly downfield signal at δ 155.08 ppm is the characteristic peak of the carbonyl carbon (C![[double bond, length as m-dash]](https://www.rsc.org/images/entities/char_e001.gif) O-2).
O-2).
Distortionless enhancement of polarization transfer using a 135 degree decoupled pulse (DEPT-135) allows differentiation between carbons attached to odd or even number of hydrogens. The carbons attached to odd number of hydrogen (1 and 3) have positive phase (up) while carbons attached to even number of hydrogen (2) have a negative phase (down). A DEPT-135 spectrum of the same product is shown in Fig. 3B. Spectrum confirms the presence of only methylene (–CH2–) groups in the polymer chain.
Signals assigned by 13C-NMR were further confirmed by 2D-NMR analysis (HSQC and HMBC), discussed in detail in proceeding text.
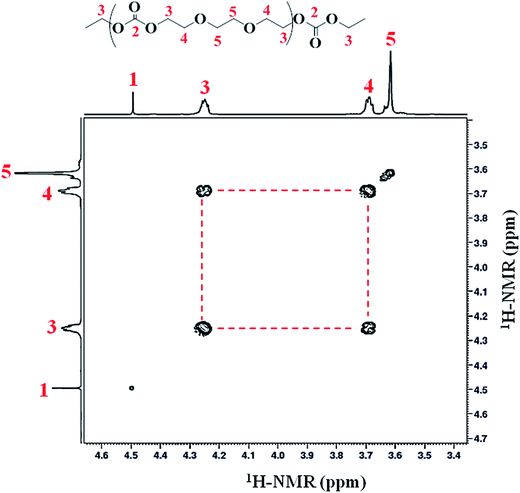
Homonuclear correlation spectroscopy (1H–1H COSY) is used to identify the different proton signals (CH2-3, CH2-4 and CH2-5) via coupling with each other. The assignment of signals CH2-3 and CH2-4 was confirmed by 2D COSY measurements. Methylene proton (CH2-3) (connected to the carbonate group) have a clear correlation with protons CH2-4 of ether linkage, Fig. 4 (Table 1).
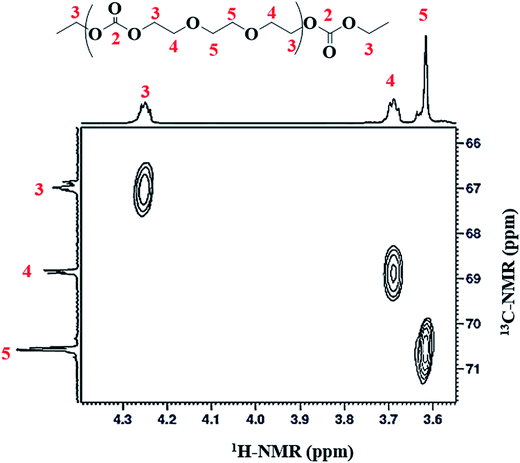
Heteronuclear single quantum coherence spectroscopy (HSQC) reveals information on the correlation of two different nuclei separated by a single bond. 2D-1H–13C HSQC technique is utilized for accurate assignment of 13C-NMR spectra. X-Axis depicts the 1H-NMR while Y-axis belongs to 13C-NMR. Correlation of three different protons can be unambiguously established with three different carbons (see Fig. 5). Direct correlation of proton at δ 4.25 ppm (CH2-3) with carbon at δ 66.9 ppm (CH2-3), proton at δ 3.69 ppm (CH2-4) with carbon at δ 68.8 ppm (CH2-4), and proton at δ 3.62 ppm (CH2-5) with carbon signal at δ 70.5 ppm (CH2-5) can be noticed in the contour plot. On the basis of this direct correlation data, signals at δ 66.9 and δ 68.8 ppm could be related to the two carbon atoms in ethylene carbonate (EC) units; –CH2 group (CH2-3) adjacent to the oxygen of carbonyl group (C![[double bond, length as m-dash]](https://www.rsc.org/images/entities/char_e001.gif) O-2) and –CH2 group (CH2-4) adjacent to the oxygen of ether unit, respectively. The signal at 70.5 ppm could be assigned to the CH2 groups (CH2-5) in the ethylene oxide (EO) units (ether linkage), Table 1.
O-2) and –CH2 group (CH2-4) adjacent to the oxygen of ether unit, respectively. The signal at 70.5 ppm could be assigned to the CH2 groups (CH2-5) in the ethylene oxide (EO) units (ether linkage), Table 1.
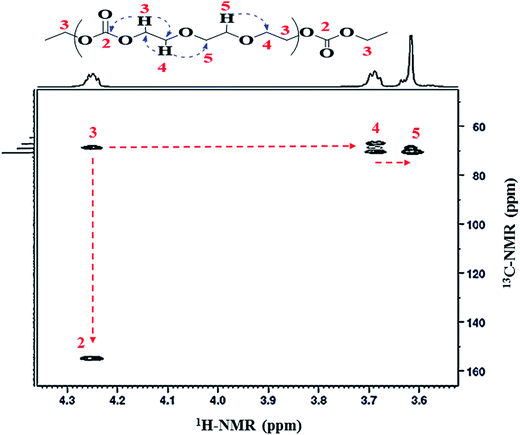
Sequences of carbonate functionality and ether linkages in the polymer were further confirmed by the 2D 1H–13C heteronuclear multiple bond correlation (HMBC) technique. Heteronuclear multiple bond correlation has ability to develop a correlation over a longer range of 2–4 bonds. 1H–13C HMBC spectra depicts that 1H-NMR signal at δ 4.25 ppm (CH2-3) is related to 13C-NMR signals at δ 155.1 ppm (C![[double bond, length as m-dash]](https://www.rsc.org/images/entities/char_e001.gif) O-2) and δ 68.8 ppm (CH2-4), Fig. 6. This confirms the presence of carbonate-ether sequences in the copolymer chain. Additionally, proton at δ 3.69 ppm (CH2-4) has a direct correlation with carbon atom at δ 66.9 ppm (CH2-3) and δ 70.5 ppm (CH2-5). HMBC correlation data demonstrated that the proton at δ 4.25 ppm (CH2-3) and proton at δ 3.62 ppm (CH2-5) are connected through CH2 group (CH2-4) at δ 3.69 ppm adjacent to –CH2 group of the carbonate unit (CH2-3), Table 1. Meticulous 2D coupling of proton and carbon NMR confirms the presence of ether linkages (equivalent to ethylene oxide repeat units). Presence of peak at δ 3.69 ppm (CH2-4) in 1H-NMR clearly indicates the presence of EO units that are formed by decarboxylation of EC. Furthermore, equal intensity of peaks at δ 3.69 (CH2-4) and δ 4.25 (CH2-3) is an indication of absence of EC–EC joining in the polymer chain. The most populated sequence (triad) of EC and EO in copolymer seems to be EC–EO–EO.
O-2) and δ 68.8 ppm (CH2-4), Fig. 6. This confirms the presence of carbonate-ether sequences in the copolymer chain. Additionally, proton at δ 3.69 ppm (CH2-4) has a direct correlation with carbon atom at δ 66.9 ppm (CH2-3) and δ 70.5 ppm (CH2-5). HMBC correlation data demonstrated that the proton at δ 4.25 ppm (CH2-3) and proton at δ 3.62 ppm (CH2-5) are connected through CH2 group (CH2-4) at δ 3.69 ppm adjacent to –CH2 group of the carbonate unit (CH2-3), Table 1. Meticulous 2D coupling of proton and carbon NMR confirms the presence of ether linkages (equivalent to ethylene oxide repeat units). Presence of peak at δ 3.69 ppm (CH2-4) in 1H-NMR clearly indicates the presence of EO units that are formed by decarboxylation of EC. Furthermore, equal intensity of peaks at δ 3.69 (CH2-4) and δ 4.25 (CH2-3) is an indication of absence of EC–EC joining in the polymer chain. The most populated sequence (triad) of EC and EO in copolymer seems to be EC–EO–EO.
3.3. MALDI-TOF MS
To confirm the presence of ether linkages in the polymers obtained by polymerization of ethylene carbonate, MALDI-TOF MS analysis of the products is conducted. Ideally, if there is no carbon dioxide emission during polymerization, the oligomers should have molar mass increment of 88.06 (formula weight of one repeat unit of ethylene carbonate). Emission of carbon dioxide results in reduction in the molecular weight of the repeat unit by 44.01 amu (formula weight of carbon dioxide). In this case, MALDI-TOF MS of the polymer obtained by polymerization of ethylene carbonate should be similar to polyethylene oxide (mass increment of 44.05), as can be seen in Fig. 7. Nevertheless, NMR analyses revealed that average carbonate content in the polymer chains is nearly 50%. Therefore, the product should be a combination of carbonate and ether linkages. MALDI-TOF MS reveals numbers (m/z) that need to be justified by molecular structure. In this particular case, one number can be true for several combinations of ether and carbonate linkages (see Table 2).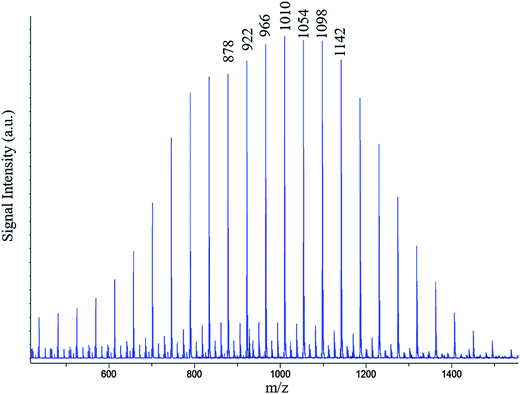 | ||
| Fig. 7 A representative MALDI-TOF MS spectrum of the poly(ethylene ether-carbonate), PEEC; possible combinations of number of ether and carbonate units with m/z value of 1010 are given in Table 2. | ||
| Sr. Nr | Number of EC units (a) | Number of EE units (b) | Molecular formula [DEG-(EC)a(EE)b + Na]+ | Theoretical molecular weight (Da) |
|---|---|---|---|---|
| 1 | 10 | 0 | C34H50O33Na | 1009.74 |
| 2 | 9 | 2 | C35H54O32Na | 1009.79 |
| 3 | 8 | 4 | C36H58O31Na | 1009.83 |
| 4 | 7 | 6 | C37H62O30Na | 1009.87 |
| 5 | 6 | 8 | C38H66O29Na | 1009.92 |
| 6 | 5 | 10 | C39H70O28Na | 1009.96 |
| 7 | 4 | 12 | C40H74O27Na | 1010.00 |
| 8 | 3 | 14 | C41H78O26Na | 1010.05 |
| 9 | 2 | 16 | C42H82O25Na | 1010.09 |
| 10 | 1 | 18 | C43H86O24Na | 1010.13 |
| 11 | 0 | 20 | C44H90O23Na | 1010.18 |
3.4. Conversion and quantification of carbonate and ether linkages by NMR
Percent conversion and relative amounts of carbonate and ether linkages in the polymer chain can be calculated by 1H-NMR spectra (Fig. 2). As discussed above, peak at δ 4.49 ppm of 1H-NMR is attributed to EC monomer. Peaks at δ 4.25 (CH2-3) and δ 3.69 ppm (CH2-4) in 1H-NMR are assigned to the two carbon atoms in EC unit, and peak at δ 3.62 ppm (CH2-5) is assigned to the carbon atom of EO unit. The conversion of monomer and the polymer composition can be calculated by using intensities of the above mentioned peaks in 1H-NMR spectra. Following formulas are used for the calculations, where I1, I3, I4, and I5 represent the intensities of the corresponding signals in 1H-NMR spectra
 | (1) |
 | (2) |
3.5. Selectivity of ethylene carbonate polymerization
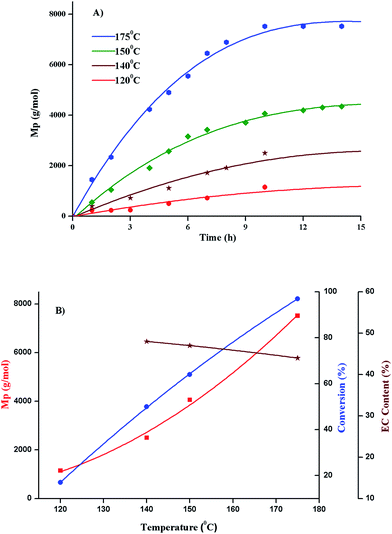
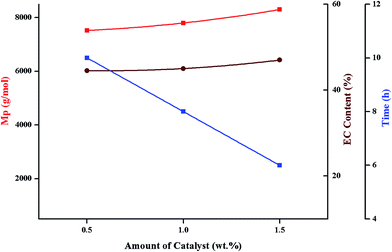
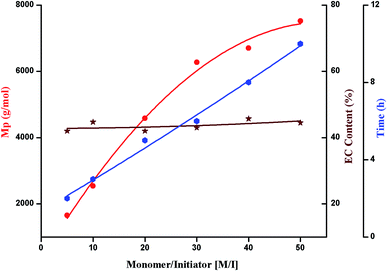
Selectivity of polymerization of ethylene carbonate with regard to conversion, evolution of molar mass and ether content is evaluated by variations in polymerization temperature, monomer to initiator ratio, catalyst content, and polymerization solvent. Molar mass values obtained by size exclusion chromatography are relative to linear PS. The values of molar mass at the maxima (Mp) are used in all the selectivity plots. Percent conversion and relative ratio of carbonate to ether linkages are calculated by 1H-NMR as explained in the previous section.4. Conclusion
This study reports on successful ring-opening polymerization of ethylene carbonate by using sodium stannate trihydrate catalyst. The comprehensive structural elucidation of the products is performed by advanced NMR techniques. It is concluded that ethylene carbonate polymerization is associated with decarboxylation during polymerization. This side reaction results in polymer chains that contain ether linkages alongside targeted carbonate linkages. Results of one-dimensional NMR (1H and 13C) and two-dimensional NMR (COSY, HSQC, and HMBC) complement each other. Two-dimensional NMR analysis revealed peculiar structural features of the polymer chains that are not possible by only one-dimensional NMR analysis. MALDI-TOF MS results support the outcome of detailed NMR analysis. The EC–EE–EE triad seems to be the major repeating unit in the polymer chain. Molar mass progression, conversion, and relative ratio of carbonate to ether linkages are calculated by size exclusion chromatography and 1H-NMR, respectively. Progress of polymerization is affected by reaction conditions such as temperature, amount of catalyst, monomer to initiator ratio and solvent. Nonetheless, the relative content of carbonate repeat units in the PEEC synthesized under varying polymerization conditions remained in the range of 40–45%. Synthesis, characterization, and drug encapsulation efficiency of amphiphilic, biodegradable block copolymers based on PEEC as a hydrophobic segment is in process.References
- T. Ariga, T. Takata and T. Endo, Macromolecules, 1997, 30, 737–744 CrossRef CAS.
- C. Yu, L. Zhang and Z. Shen, J. Mol. Catal. A: Chem., 2004, 212, 365–369 CrossRef CAS.
- K. Nagahama, Y. Ueda, T. Ouchi and Y. Ohya, Biomacromolecules, 2007, 8, 3938–3943 CrossRef CAS PubMed.
- H. M. de Oca, J. E. Wilson, A. Penrose, D. M. Langton, A. C. Dagger, M. Anderson, D. F. Farrar, C. S. Lovell, M. E. Ries, I. M. Ward, A. D. Wilson, S. J. Cowling, I. M. Saez and J. W. Goodby, Biomaterials, 2010, 31, 7599–7605 CrossRef PubMed.
- A. L. Lee, S. Venkataraman, S. B. Sirat, S. Gao, J. L. Hedrick and Y. Y. Yang, Biomaterials, 2012, 33, 1921–1928 CrossRef CAS PubMed.
- I. A. Paun, M. Zamfirescu, M. Mihailescu, C. R. Luculescu, C. C. Mustaciosu, I. Dorobantu, B. Calenic and M. Dinescu, J. Mater. Sci., 2014, 50, 923–936 CrossRef.
- J. Feng, R.-X. Zhuo and X.-Z. Zhang, Prog. Polym. Sci., 2012, 37, 211–236 CrossRef CAS.
- F. Suriano, O. Coulembier, J. L. Hedrick and P. Dubois, Polym. Chem., 2011, 2, 528–533 RSC.
- B. D. Ulery, L. S. Nair and C. T. Laurencin, J. Polym. Sci., Part B: Polym. Phys., 2011, 49, 832–864 CrossRef CAS PubMed.
- M. Acemoglu, Int. J. Pharm., 2004, 277, 133–139 CrossRef CAS PubMed.
- H. Pranamuda, R. Chollakup and Y. Tokiwa, Appl. Environ. Microbiol., 1999, 65, 4220–4222 CAS.
- T. Suyama and Y. Tokiwa, Enzyme Microb. Technol., 1997, 20, 122–126 CrossRef CAS.
- Z. Zhang, R. Kuijer, S. K. Bulstra, D. W. Grijpma and J. Feijen, Biomaterials, 2006, 27, 1741–1748 CrossRef CAS PubMed.
- T. Artham and M. Doble, Macromol. Biosci., 2008, 8, 14–24 CrossRef CAS PubMed.
- M. Dadsetan, E. M. Christenson, F. Unger, M. Ausborn, T. Kissel, A. Hiltner and J. M. Anderson, J. Controlled Release, 2003, 93, 259–270 CrossRef CAS PubMed.
- X. Zhang, H. Mei, C. Hu, Z. Zhong and R. Zhuo, Macromolecules, 2009, 42, 1010–1016 CrossRef CAS.
- G. Rokicki, Prog. Polym. Sci., 2000, 25, 259–342 CrossRef CAS.
- B. Ochiai and T. Endo, Prog. Polym. Sci., 2005, 30, 183–215 CrossRef CAS.
- N. E. Kamber, W. Jeong, R. M. Waymouth, R. C. Pratt, B. G. Lohmeijer and J. L. Hedrick, Chem. Rev., 2007, 107, 5813–5840 CrossRef CAS PubMed.
- H. R. Kricheldorf, J. Jenssen and I. Kreiser-Saunders, Makromol. Chem., 1991, 192, 2391–2399 CrossRef CAS.
- D. Delcroix, B. Martín-Vaca, D. Bourissou and C. Navarro, Macromolecules, 2010, 43, 8828–8835 CrossRef CAS.
- J. H. Clements, Ind. Eng. Chem. Res., 2003, 42, 663–674 CrossRef CAS.
- C. Ursin, C. M. Hansen, J. W. Van Dyk, P. O. Jensen, I. J. Christensen and J. Ebbehoej, Am. Ind. Hyg. Assoc. J., 1995, 56, 651–660 CrossRef CAS PubMed.
- A.-H. Liu, Y.-N. Li and L.-N. He, Pure Appl. Chem., 2011, 84, 581–602 CrossRef.
- W.-L. Dai, S.-L. Luo, S.-F. Yin and C.-T. Au, Appl. Catal., A, 2009, 366, 2–12 CrossRef CAS.
- J. Sun, S.-i. Fujita and M. Arai, J. Organomet. Chem., 2005, 690, 3490–3497 CrossRef CAS.
- L. Vogdanis, B. Martens, H. Uchtmann, F. Hensel and W. Heitz, Macromol. Chem. Phys., 1990, 191, 465–472 CrossRef CAS.
- K. Soga, S. Hosada, Y. Tazuke and S. Ikeda, J. Polym. Sci., Part C: Polym. Lett., 1976, 14, 161–165 CrossRef CAS.
- K. Soga, Y. Tazuke, S. Hosoda and S. Ikeda, J. Polym. Sci., Part A: Polym. Chem., 1977, 15, 219–229 CrossRef CAS.
- R. F. Harris, J. Appl. Polym. Sci., 1989, 37, 183–200 CrossRef CAS.
- R. F. Harris and L. A. McDonald, J. Appl. Polym. Sci., 1989, 37, 1491–1511 CrossRef CAS.
- L. Vogdanis and W. Heitz, Macromol. Rapid Commun., 1986, 7, 543–547 CrossRef CAS.
- R. F. Storey and D. C. Hoffman, Macromolecules, 1992, 25, 5369–5382 CrossRef CAS.
- J.-C. Lee and M. H. Litt, Macromolecules, 2000, 33, 1618–1627 CrossRef CAS.
- J.-i. Kadokawa, Y. Iwasaki and H. Tagaya, Macromol. Rapid Commun., 2002, 23, 757–760 CrossRef CAS.
- A. M. Elmér and P. Jannasch, J. Polym. Sci., Part A: Polym. Chem., 2006, 44, 2195–2205 CrossRef.
- P. Pawłowski and G. Rokicki, Polymer, 2004, 45, 3125–3137 CrossRef.
- G. R. Fulmer, A. J. M. Miller, N. H. Sherden, H. E. Gottlieb, A. Nudelman, B. M. Stoltz, J. E. Bercaw and K. I. Goldberg, Organometallics, 2010, 29, 2176–2179 CrossRef CAS.
- R. F. Storey and D. C. Hoffman, Polymer, 1992, 33, 2807–2816 CrossRef CAS.
- C. Yang, Z. Y. Ong, Y. Y. Yang, P. L. Ee and J. L. Hedrick, Macromol. Rapid Commun., 2011, 32, 1826–1833 CrossRef CAS PubMed.
- A. K. Diallo, W. Guerin, M. Slawinski, J.-M. Brusson, J.-F. Carpentier and S. M. Guillaume, Macromolecules, 2015, 48, 3247–3256 CrossRef CAS.
- K. M. Tomczyk, P. G. Parzuchowski and G. Rokicki, J. Appl. Polym. Sci., 2011, 120, 683–691 CrossRef CAS.
- G. Rokicki and T. Kowalczyk, Polymer, 2000, 41, 9013–9031 CrossRef CAS.
| This journal is © The Royal Society of Chemistry 2017 |

