
 Open Access Article
 This Open Access Article is licensed under a Creative Commons Attribution-Non Commercial 3.0 Unported Licence
Functionalized reduced graphene oxide (fRGO) for removal of fulvic acid contaminant
Soumya Kanta Ray a,
Chanchal Majumdera and
Prosenjit Saha*b
a,
Chanchal Majumdera and
Prosenjit Saha*b
aDepartment of Civil Engineering, Indian Institute of Science Engineering Science and Technology (IIEST), Shibpur, Howrah-711103, West Bengal, India
bM. N. Dastur School of Material Science and Engineering, Indian Institute of Science Engineering Science and Technology (IIEST), Shibpur, Howrah-711103, West Bengal, India. E-mail: senjitiitkgp@gmail.com
First published on 19th April 2017
Abstract
Iron-functionalized reduced graphene oxide (fRGO)-coated sand was used for the adsorption of natural organic matter, such as fulvic acid (FA), from synthetic water. A novel synthesis route was achieved to prepare an fRGO nanocomposite. FTIR, optical microscopy, scanning electron microscopy (SEM), transmission electron microscopy (TEM), and atomic force microscopy (AFM) were applied to investigate the morphologies and structures of fRGO. Removal kinetics (pseudo-second order) and adsorption isotherms (Langmuir and Freundlich) were investigated in terms of adsorbed total organic carbon (TOC) of FA to evaluate the removal rate and adsorption capacity. The effects of pH of the FA solution and the adsorbent dose (0.5–2.5 mg g−1) of fRGO were further evaluated for the determination of a possible removal mechanism. A comparative study of the adsorption efficiency of fRGO and powder activated carbon (PAC) was also carried out, and the results indicated a higher FA adsorption efficacy for fRGO. The π–π interaction between the carbon atoms of FA and fRGO and electrostatic interaction between iron and functional radicals of FA were responsible for the removal.
Introduction
Fulvic acid (FA) represents a major component of natural organic matter (NOM); it adversely affects the vision and taste behavior and also imparts the formation of complexes with heavy metals and adsorbed organic contaminants.1,2 The presence of FA in natural water produces disinfection by-products (DBPs) during the disinfection process. Various types of DBPs such as trihalomethanes and halo acetic acids have been reported to be carcinogenic and mutagenic and cause other toxic effects in human beings.3–5 Therefore, removal of FA from water is very important for environmental and health considerations.Several conventional methods such as coagulation/flocculation, ion-exchange, membrane filtration, and adsorption6 have been reported in the literature for the removal of FA. These conventional methods that utilize activated carbon and polymers have not been considered effective for the removal of FA contaminants since the size of FA particles is a few hundred nanometers or even less.7 However, in water treatment history, carbon is one of the most adaptable materials that is widely used for water purification.8,9 In the last three decades, nanoparticles have been increasingly applied in water purification as excellent adsorbents.9–11 Graphite oxide (GO),12 ornamented with different functional groups such as hydroxyl, epoxy, and carboxylic acid, can be further functionalized to prepare nanocomposites to be coated on the layers of sand for specific contaminant removal.13–15 The functionalized or non-functionalized forms of graphene have been used as variants.16,17
Generally, a chemical oxidation method is used to functionalize graphene by –OH and –COOH groups. The functionalized GO system is highly dispersible in water compared to its primary counterpart.18 Iron complexes (Fe–Fe3O4) are the most common functionalized metal–metal oxides applied with carbon-based nanocomposites for water treatment operations.19–21 Covalent or non-covalent bonds are created on the surfaces of graphene and GO to impart various functional groups.22 The functionalization of carbonaceous nanomaterials has mainly contributed to the enhanced hydrophilicity of GO and graphene with increased dispersion to interact with chemical contaminants in aqueous media at the nanometer level.23 Anionic contaminants were removed by increasing the surface charge of different functional groups on nanomaterial surfaces.24–26 The removal mechanism has been proposed to be through π–π interactions and cationic–π bonding.27 Generally, this removal is pH-dependent and follows the Langmuir adsorption model. Removal of mercury (Hg2+) as a contaminant has been reported with the adsorption capacity of 980 mg g−1 through a synthesized, polypyrrole-reduced graphene oxide (PPy-RGO) composite.28
Low-cost water purification filtration sand columns were developed using GO nanosheets, covalently modified with thiol groups on sp2 domains to remove heavy metals and organic dyes.29 A sand column coated with GO was reported to remove heavy metals and organic dyes at a 5-fold greater level compared to uncoated sand. Magnetite-reduced graphene (M-RGO) hybrids were used with RGO, with a particle size in the order of 10 nm, to remove As(III) and As(V).30 Above 99.9% arsenic was found to be removed within 1 ppb limit from the synthetic water at the concentration of 1 mg mL−1. Batch mode adsorption studies were conducted for the removal of rhodamine-6G dye and chlorpyrifos pesticide by graphene prepared from an asphalt precursor followed by immobilization of graphene on sand.31 An adsorption mechanism was established in a batch mode on the basis of time, particle size, and the adsorbent dose.
Cu(II) and Pb(II) were removed using a fixed-bed sand column by a graphene oxide (GO) layer under a steady flow of inlet air.32,33 However, the Cu(II) and Pb(II) removal efficiency decreased from 15.3% to 10.3% and from 26.7% to 19.0%, respectively, when the injection flow rate was increased from 1 to 5 mL min−1. The increase in the amount of GO in the column was found to be efficient for the removal of actinides, such as Am(III), Th(IV), Pu(IV), Np(V), U(VI), and distinctive fission products, such as Sr(II), Eu(III) and Tc(VII), compared to that of traditional sorbents such as bentonite clays and activated carbon even at pH less than 2.34 Methylene blue (MB) was found to be removed up to 99% by GO in an aqueous solution at the concentration of 250 mg L−1 with the adsorption capacity of 714 mg g−1.35 A porous polysilicate acid/graphene composite was used to remove MB from the solution via chemical adsorption.36 A magnetic carbonate hydroxyapatite/graphene oxide (M-CHAP/GO) composite was used as a nice adsorbent to satisfactorily remove both lead (Pb) and MB.37 Aqueous graphene oxide (GO) removed 95% of the initial concentration of MB in a spontaneous manner.38 An anionic azo dye was successfully removed by activated GO by decreasing the quantity of electronegative charges on the surface of GO.39 Heavy metals and dyes were efficiently removed through a manganese (Mn)-doped, iron nanocomposite.40
However, in reality, most of the abovementioned methods were found to be less applicable due to lack of acceptable effectiveness in the removal of FA from water. A robust and more practical process needs to be established for FA removal from natural water. In this study, RGO was prepared, functionalized with an iron complex, and coated on sand to adsorb FA from synthetic water. Hence, the main objectives of our findings were as follows: (1) to characterize iron-functionalized reduced graphene oxide (fRGO); (2) to explore FA removal by fRGO-coated sand at different FA concentrations, pH conditions, time, and (3) to evaluate the effect of dose variation of adsorbent such as fRGO coated sand (∼0.5–2.5 mg g−1); and (4) to determine the adsorption mechanisms by studying the adsorption kinetics and measuring the isotherms.
Materials and methods
Chemicals
The study was conducted using a synthetic solution of fulvic acid (FA), which was a gift by SNEH Corporation, Ahmadabad, India. Graphite powder, concentrated sulfuric acid (H2SO4), sodium nitrate (NaNO3), hydrogen peroxide (H2O2), and ferrous sulfate (FeSO4) were purchased from Merck, Dermasdat, Germany. Hydrazine hydrate N2H4 (50–60%) and N,N-dimethylformamide (DMF) were purchased from Sigma-Aldrich, Taufkirchen, Germany.Experimental
Synthesis of reduced graphene oxide from graphene oxide (GO)
GO was synthesized from graphite powder via Hummers method41,42 (Scheme 1). For a typical batch synthesis, graphite powder (5.0 g) and NaNO3 (2.5 g) were blended, and 120 mL of H2SO4 (95%) was poured into a 1.2 L Borosil glass beaker. Then, the contents were mixed for 30 minutes by a magnetic stirrer in an ice bath. While maintaining vigorous stirring, potassium permanganate (KMnO4) (15.0 g) was added to the suspension. The rate of mixing of KMnO4 was in a very controlled manner to maintain the mixture temperature lower than 20 °C. The ice bath was then detached and the compound was vigorously stirred at 35 °C for 30 min. During the reaction, the compound gradually became pasty and the color changed to light brown. At the end of the reaction, 150 mL of H2O was added dropwise to the paste under vigorous mixing. The temperature of the system was rapidly increased to 98 °C that was maintained by external heating for 15 min and effervescence was observed. After stopped the fumes from the exfoliated paste was cooled for 20 min in a water bath upon completion of fumes, and 450 mL of H2O was added to stop the oxidation. A 15 mL aliquot of 30% H2O2 was added to the reaction, and the color changed to yellow. For refinement, the mixture was rinsed by separately washing and centrifuging with 10% HCl and DI water several times to achieve a pH value of 7. | ||
| Scheme 1 Flow diagram of fulvic acid removal by iron-functionalized reduced graphene oxide (fRGO). | ||
The gray brownish GO powder was dispersed in DI water via (250 mL H2O and 100 mg GO) sonication such that no particulate matter was found in the solution (Scheme 1). Hydrazine hydrate (N2H4) was added into the solution and the mixture was heated for 2 h in an oil bath containing commercial sunflower oil at 100 °C under magnetic stirring to maintain a homogeneous suspension. Then, the solution was transferred to a water cooling condenser. After 24 h, black solids precipitated in the solution as reduced GO.43,44
N,N-Dimethylformamide (DMF) was added to the abovementioned solution by sonication with a 9![[thin space (1/6-em)]](https://www.rsc.org/images/entities/char_2009.gif) :1 volume ratio of DMF/H2O for homogenous dispersion of RGO in the solution.45,46 As a result, the RGO solution was concentrated to 20 mg mL−1 for further experiments.
:1 volume ratio of DMF/H2O for homogenous dispersion of RGO in the solution.45,46 As a result, the RGO solution was concentrated to 20 mg mL−1 for further experiments.
Functionalization of RGO
RGO (3 mL) solution was dispersed in deionized water (DI) (147 mL) by ultrasonication for 30 min. To this dispersion, FeSO4·7H2O (15 mg) was added. The mixture was agitated for 24 h at 27 °C. After 24 h, 5 mL of 0.1 N ammonium hydroxide (NH4OH) was mixed until the pH reached 8. Upon addition of ammonium hydroxide, the color of the compound turned brownish-red. The deep brownish-red color signified the formation of ferric hydroxide in the mixture. A hot plate was used to evaporate the water from the compound. After evaporating the water from the mixture, a solid brownish-mass was formed, which was later suspended and washed with warm water several times. This brownish-mass was then dried in a vacuum oven at 85 °C for 12 h to complete the functionalization of the RGO nanomaterial.13Coating of sand with fRGO
Natural sand with particle size that passes through 300 μm and retain in 150 μm was sieved, collected, and washed with a10% HCl solution for the removal of different impurities before use. The acid-washed sand sample was then heated to 550 °C to remove any organic impurities. It was then cooled down to room temperature and stored in a vacuum desiccator for further use. For coating of RGO on sand particles, 50 g of this cleaned sand was put into a 250 mL beaker with 3 mL of 20 mg mL−1 RGO. The mixture was then homogenized with 15 mg FeSO4 dissolved in 150 mL of deionized water and heated up to 15 °C in a vacuum oven for three hours until nanocomposite was hardly attached on the surface of sand.29 Then, the fRGO nanocomposite-coated sand was heated up to 450 °C in a muffle furnace for the completion of annealing of the compound.Characterization
Surface functionalization of fulvic acid (FA) and as-prepared fRGO was verified by FTIR spectroscopy (FTIR BRUKER TENSOR 27, Germany). The surface morphology of fRGO-coated sand was observed by LEICA DMi8 optical microscopy and scanning electron microscopy (HITACHI S-3400N) with EDAX facility (EMAX). The surface morphology of fRGO was additionally evaluated by transmission electron microscopy (TEM, Quanta 200 FEG, FEI Company, USA). Upon adsorption, the surface of the complex interacted with FA and the interaction was observed by atomic force microscopy (AFM, Bruker Dimension Edge AFM-Peak force tapping) in an air medium.47 A total organic carbon (TOC) analyzer (vario TOC cube, Germany) was used for the determination of the total organic portion available in FA used as an adsorbate in this study. The determination method was performed as per the guidelines in which the FA sample was subjected to high-temperature catalytic oxidation up to 1200 °C and a CO2 measurement using a non-dispersive infrared (NDIR) sensor was carried out for TOC.Fulvic acid (FA) removal study
Adsorption study
Batch adsorption studies were conducted with five different doses of fRGO-coated sand in 25 mL of 10 mg L−1 of FA synthetic solution, and the temperature was maintained at 27 °C. During experimentation, the equivalent TOC content of FA was monitored in each run. The FA concentration was 10 mg L−1 equivalents with the TOC concentration of 4.431 mg L−1. Similar TOC concentration values in surface water (River Hooghly) are also reported by other researchers.50 Therefore, in the present study, the initial dose concentration of FA was kept at 10 mg L−1. With the desired amount of adsorbent dose, the contents were stirred for 15 h, and removal efficiencies were determined. Similar batch adsorption studies were conducted to compare the FA removal performance of fRGO with that of powdered activated carbon (PAC). Commercial fulvic acid is a highly soluble and deep brown-colored compound. Since it is difficult to obtain pure FA, the removal of FA was monitored by TOC removal. Raw FA contains 44.31% TOC, and the functional groups associated with FA were characterized by FTIR analysis. A batch study was conducted to evaluate FA adsorption by fRGO.Then, six different runs with 100 mL of FA solution at 10 mg L−1 and different adsorbent doses were carried out. The contents were stirred to achieve equilibrium. The equilibrium time was obtained from the kinetic study, which was approximately 15 h (95% removal). The contents were then filtered through 0.45 μm Whatman filter paper. The removal efficiency of FA was measured in terms of TOC removal. Since sand was used only as a support material, the adsorption capacity was reported in terms of the active functional adsorbents only.
Result and discussion
Characterization of RGO and fRGO
![[double bond, length as m-dash]](https://www.rsc.org/images/entities/char_e001.gif) O group. This observation explains the higher solubility of FA in water due to presence of a higher number of carboxylic acid groups in FA51 (Fig. 1).
O group. This observation explains the higher solubility of FA in water due to presence of a higher number of carboxylic acid groups in FA51 (Fig. 1).
 | ||
| Fig. 1 Fourier transform infrared spectroscopy (FTIR) spectrum of fulvic acid (FA). | ||
FTIR was conducted to evaluate the incorporated functional groups on RGO and fRGO. The IR peak values were compared to the standard table of characteristic IR absorptions. It is clear from Fig. 2 that several functional groups were incorporated in the synthesized nanocomposite. The appearance of this peak could be attributed to the asymmetrical CH2 stretching. A sharp peak located at 1630 cm−1 has been observed due to CC stretching. The peak located at 1120 cm−1 represents a C–OH alcoholic group, and that at 800 cm−1 represents the carbonyl CO group stretching, respectively. These results explain the highly functionalized properties present in RGO to bond with multivalent metal ions.52,53
 | ||
| Fig. 2 Fourier transform infrared spectroscopy (FTIR) spectra of RGO and fRGO. | ||
To increase the organic adsorption capacity of RGO, ferrous sulfate (FeSO4) was added for subsequent functionalization. Thus, from Fig. 2, it was concluded that a broad peak observed around 3403 cm−1 was due to the presence of moisture. Another sharp peak was detected at 1635 cm−1 that justified the presence of CC, and a peak at 823 cm−1 signified CO stretching. The most important conclusion was drawn from the peak at 1134 cm−1 (1123–1173 cm−1), which is due to the presence of a sulfate (SO42−) ion. This was due to the fact that functionalization occurred through FeSO4.54 The presence of SO42− indirectly corroborates the presence of Fe in functionalized RGO.
The inner double bond oxygen (–O–) and hydroxyl (–OH–) bond were greatly reduced during the conversion of GO to RGO.55 An electrostatic bond was developed between the functionalized iron and a double bond oxygen in the fRGO structure (Scheme 2(a-i)),56 and the electrostatic bonds are proposed in Scheme 2(a-ii).57 The outer radicals of FA formed the electrostatic bond with a free electron of fRGO, and this bond and π–π interaction bonds were responsible for the adsorption (Scheme 2(b)).57
 | ||
| Scheme 2 Schematic (a and b) of the details proposed for FA-fRGO interaction. | ||
 | ||
| Fig. 3 Optical microscopy images for the presence of a nanostructure in RGO. | ||
Scanning electron microscopy (SEM)
Scanning electron microscopy (SEM) was used for characterizing the morphology of the fRGO composite-coated sand. Sand samples before fRGO coating had a bright morphology (Fig. 4). After coating with an fRGO sheet-like structure, the morphology changed to a dull, glossy look due to the sticky covering over the surface and formation of aggregated clusters (Fig. 4). To understand the elemental composition of the material, the composite was analyzed using EDAX (Fig. 4), where it was shown that the major elements present were carbon, silicon, and oxygen. The inset in Fig. 4 shows the SEM image of a dry sand particle and the corresponding elemental maps. The observed Si and O peaks were resulted from the presence sand (SiO2) particles. Whereas the appearance of carbon (C) and aluminum (Al) peaks indicates the presence of reduced graphene oxide, and small amount of impurity subsequently before heat treatment. However, as observed from Fig. 4, it was expected that after mixing the fRGO compound with sand particles, followed by a heat treatment at 105 °C and 450 °C, the carbon amount was found increased. Similarly, the EDX graph in the Fig. 4(f) indicates the presence of Fe that confirms the successful coating of sand surface with fRGO.58 The elemental composition of the material was analyzed using EDAX to determine the nature of the composite, revealing that true functionalization occurred (Fig. 4). | ||
| Fig. 4 Scanning electron microscopy (SEM) and energy-dispersive X-ray spectroscopy (EDX) images. (a) Typical surface of sand, (b) enlarged surface of sand, (c) EDX image of sand surface, (d) fRGO coated, sand surface, (e) fRGO coated, enlarged sand surface, (f) EDX image of fRGO coated, sand surface. | ||
Transmission electron microscopy (TEM)
The morphological structure of fRGO was observed using TEM. The layered structure (Fig. 5(a)) and flake-like orientation (Fig. 5(b)) of fRGO are shown in Fig. 5. It shows successful transformation of RGO from GO upon chemical reduction followed by subsequent functionalization with an iron complex. RGO flakes, with a curtain-like structure with nanodimensions, clearly indicate very good exfoliation of graphite during the oxidation process.58,59 However, the fRGO solution may impart a higher concentration in solution, and therefore, the layered sheet-like structure may appear (Fig. 5(a)). The surface morphology of the layered orientation strongly resembles an overlapped structure rather than an aggregated structure.60 | ||
| Fig. 5 Transmission electron microscopy (TEM) image of reduced graphene oxide (RGO). (a) Layer of synthesized RGO and (b) single flake of synthesized RGO. | ||
Atomic force microscopy (AFM)
To ascertain the adsorption of FA on fRGO, a microtopography study was performed via atomic force microscopy (AFM). A fulvic acid (FA) sample was dissolved in DI water and adsorbed on fRGO at neutral pH. A silicon wafer was taken as a substrate for spin casting of a dried FA-fRGO sample at 27 °C for 30 min. Fig. 6(a) and (b) shows a plan and sectional profile of FA-adsorbed fRGO flakes. Due to adsorption, the molecules formed in the FA-fRGO interaction featured a particle or bulb-shaped structure (Fig. 6(a)). The dimensions for white spots or knots, with a horizontal length of 10–40 nm and a vertical height of 2–12 nm, were tightly dispersed on the silicon wafer top surface. It can be clearly observed in Fig. 6(a) that smaller particles of complex formed by FA adsorbed fRGO remain in the height of ∼2 nm,61 and larger particles of FA-fRGO complex show the height of ∼12 nm. Interestingly the larger particles were found to aggregate at the outer region due to the existing centrifugal force.62 | ||
| Fig. 6 FA-fRGO interaction: (a) surface microtopology and (b) depth profile. | ||
Removal study
 | ||
| Fig. 7 Percentage (%) removal of FA (as TOC) vs. pH of solutions measured after adsorption of FA by fRGO and PAC. | ||
 | ||
| Fig. 8 Effect of contact time on the adsorption of FA by the adsorbents fRGO, PAC, and sand. | ||
The FA removal data was also plotted according to four different kinetic models: pseudo-1st order, pseudo-2nd order, the Elovich model, and the intraparticle-diffusion kinetic model. The four types of models are described as follows.
(1) Pseudo-1storder model:
|
log(qe − qt) = logqe − ks1t
| (1) |
(2) Pseudo-2nd order model:
 | (2) |
(3) Elovich model:
 | (3) |
(4) Intraparticle diffusion kinetic model:
 | (4) |
Only a pseudo-2nd-order model with respect to t/qt vs. t showed a straight line fit of the experimental data-points, as observed by other researchers.37,40,64 The removal of TOC (FA) by the three adsorbents is plotted in Fig. 9(a)–(d). It is clear from the figures that all three adsorbent materials showed an excellent fit to the pseudo-second order kinetic model. Correlation coefficients and constants for the kinetic models are given in Table 1 for FA adsorption by fRGO, PAC, and sand. The kinetic coefficients calculated for the three adsorbents fRGO, PAC, and sand are 8.1596 h−1, 44.763 h−1 and 15881.56 h−1, respectively. The equilibrium adsorption capacity for TOC removal by fRGO, PAC, and sand were calculated from the model and found to be 0.399 mg g−1, 0.1196 mg g−1, and 0.00853 mg g−1, respectively. The equilibrium adsorption capacity of fRGO was found to be 3.34 and 46.78 times higher compared to that of PAC and sand, respectively. A similar removal performance of FA by different carbonaceous adsorbents has been reported elsewhere.13,48,49,63,65–68 From these results, it was concluded that fRGO and PAC had a preferable adsorption capability, whereas sand had no such ability to remove FA from the solution. Because EDAX (Fig. 4) analysis of sand particles revealed the presence of aluminum, the small amount of TOC removal by sand particles may be attributed to the presence of aluminum as a mineralogical composition with the sand particles. The presence of carboxylic and phenolic functional groups in FA helped in its adsorption by coordinative interaction with aluminum oxide or hydroxide and thereby showed a small amount of TOC removal by sand. Fulvic acid was adsorbed at the solid–water interface due to their hydrophobic interaction,69 and the presence of acidic oxides (SiO2) enhanced the uptake of humic substances via lowering the pH.70
 | ||
| Fig. 9 Effect of contact time on the removal efficiency: pseudo-1st-order kinetics (a), pseudo-2nd-order kinetics (b), Elovich kinetics (c) and intraparticle diffusion kinetics (d) for adsorption of FA onto fRGO, PAC, and sand (C0 = 10 mg L−1, C0 as per TOC = 4.431 mg L−1, V = 25 mL, t = 40 h, temperature of 300 K). | ||
| Selection of adsorbent | Pseudo-first order | Pseudo-second order | Elovich | Intraparticle diffusion | ||||||||
|---|---|---|---|---|---|---|---|---|---|---|---|---|
| ks1 (mg h g−1) | qe (mg g−1) | R2 | ks2 (mg h g−1) | qe (mg g−1) | R2 | α (mmol g−1 h−1) | β (g mmol −1) | R2 | kdiff (mg g−1 h−1/2) | C (mg g−1) | R2 | |
| fRGO | 0.07 | 0.293 | 0.488 | 0.236 | 1.30 | 0.999 | 31.1 | 0.026 | 0.92 | 9.52 | 90.63 | 0.775 |
| PAC | 0.073 | 0.024 | 0.548 | 0.291 | 0.641 | 0.998 | 11.2 | 0.03 | 0.542 | 2.74 | 17.2 | 0.853 |
| Sand | 0.025 | 0.1 | 0.078 | 0.006 | 1.155 | 0.994 | 42.5 | 0.059 | 0.357 | 0.629 | 1.572 | 0.267 |
Adsorption isotherms
Two basic adsorption isotherms, namely Langmuir and Freundlich adsorption isotherms, were investigated for FA removal by fRGO, and the adsorption performance was compared with that of PAC.Langmuir adsorption isotherm
The Langmuir adsorption isotherm is applicable to characterize monolayer adsorption morphology, covering a limited number of identical locations.13 The model was adopted for a constant intensity of adsorption morphology and restricted the movement of adsorbate through the surface. The Langmuir adsorption isotherm may be represented in a linear form by the following equation:| 1/qe = 1/(qmaxCekL) + 1/qmax | (5) |
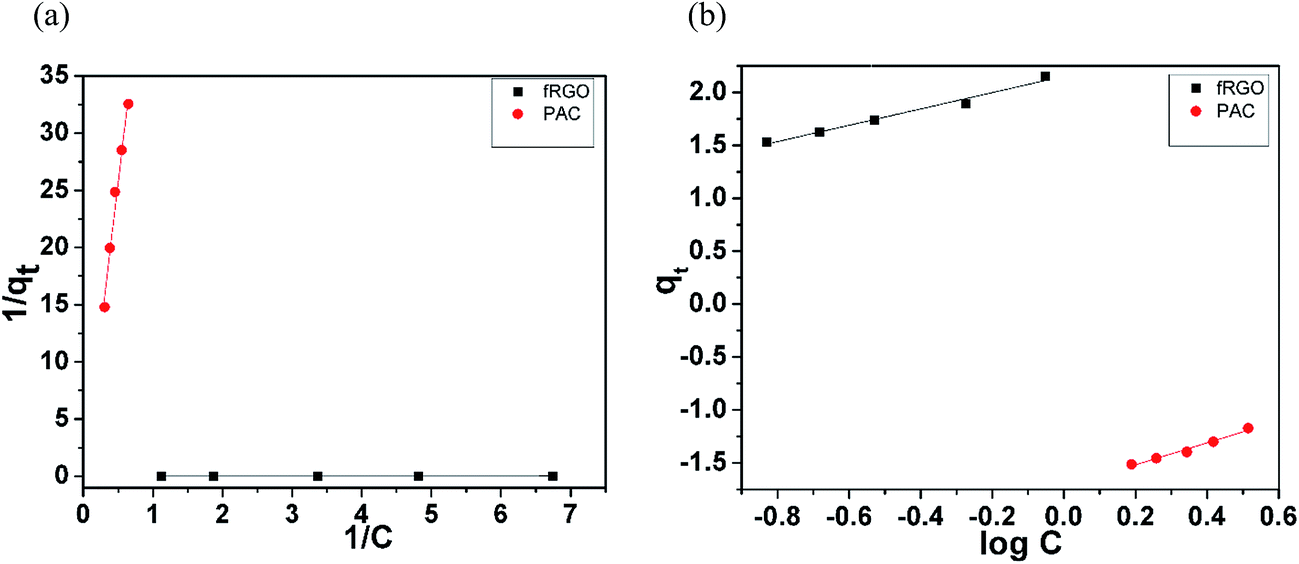 | ||
| Fig. 10 Langmuir (a) and Freundlich (b) adsorption isotherm fit of FA onto adsorbents fRGO and PAC, respectively (C0 = 10 mg L−1, C0 as per TOC = 4.431 mg L−1, V = 25 mL, contact time for 15 h, pH at 7, and temperature of 300 K). | ||
| Selection of adsorbent | Langmuir isotherm | Freundlich isotherm | ||||
|---|---|---|---|---|---|---|
| qmax (mg g−1) | kL (L mg−1) | R2 | kF (mg g−1) | n (L mg−1) | R2 | |
| fRGO | 222.72 | 1.17 | 0.971 | 142.187 | 1.3 | 0.975 |
| PAC | 7.12 | 0.00275 | 0.973 | 0.018 | 0.965 | 0.973 |
Freundlich adsorption isotherm
The adsorption characteristics of a heterogeneous surface with low and intermediary concentrations can be described by a Freundlich adsorption isotherm.13 The experimental adsorption data were tested via a Freundlich isotherm. The Freundlich isotherm may be expressed in the following linear form:|
logqe = logkF + 1/nlogCe
| (6) |
The Freundlich adsorption isotherm for two adsorbents is shown in Fig. 10(b). It is clear from Fig. 10(b) that both adsorbents showed a good fit to the model. The sorption capacity of fRGO was found to be 142.19 mg g−1, whereas PAC showed an FA adsorption capacity of about 0.02 mg g−1, which was significantly low. The low removal of FA by PAC may be attributed to the fact that high molecular weight, large sized FA does not get adsorbed on PAC due to its small pore size. Due to functionalization of reduced graphene oxide, the adsorption capacity of FA significantly increased. The adsorption isotherm constants for both materials and the isotherms are shown in Table 2.
The correlation coefficients (R2) for the Freundlich isotherm model for both the adsorbents (fRGO and PAC) were higher than those for the Langmuir isotherm model. The results demonstrated that heterogeneous surface adsorptions occurred at low and intermediate concentrations of adsorbate. Hence, the primary mechanism of adsorption in this case is driven by the heterogeneous surfaces of the adsorbent.49,63
The thermodynamic parameter of free energy change ΔG° was calculated from the temperature-dependent sorption isotherms.13 The equilibrium constant K0 and ΔG° were derived from the relationship:
|
ΔG° = −RTlnK°
| (7) |
The results of free energy change ΔG° are shown in Table 3. The negative values of ΔG° signified that both the Langmuir and Freundlich adsorption processes were spontaneous.37,38
| Selection of adsorbent | Free energy (ΔG°) (J mol−1) |
|---|---|
| fRGO | −391.6 |
| PAC | −284.2 |
Conclusions
The present study indicates that iron-functionalized reduced graphene oxide (fRGO) can be used as an effective adsorbent material for the removal of contaminants such as fulvic acid. The removal of FA is pH-dependent, and higher removal takes place at low pH. The kinetic study of FA removal revealed that it followed a second-order kinetics model better compared to first-order kinetics. Functionalization of RGO by an iron salt enhanced the FA adsorption capacity. Due to the large specific surface area and functionalization of RGO, adsorption of FA greatly increased compared to that by powder activated carbon (PAC). Our results suggest that fRGO is an effective adsorbent for removing fulvic acid (FA) molecules in surface water environments. Both the electrostatic bond with a free electron of fRGO and the π–π interaction bonds were responsible for the adsorption. This also suggests a new way to improve the adsorption capacity of RGO for the removal of natural organic materials in water.Acknowledgements
The authors would like to acknowledge Mr Praveen Sawai, Technical Assistant, Materials Science Centre, Indian Institute of Technology Kharagpur (IIT, KGP) for helping us with FTIR analyses. We would also like to thank Dr Diptonil Banerjee, Assistant Professor, Dr M. N. Dastur School of Materials Science and Engineering, for helping with AFM analyses.References
- S. A. Baghoth, S. K. Sharma and G. L. Amy, Tracking natural organic matter (NOM) in a drinking water treatment plant using fluorescence excitation-emission matrices and PARAFAC, Water Res., 2011, 45(2), 797–809 CrossRef CAS PubMed.
- K. M. Elkins and D. J. Nelson, Fluorescence and FT-IR spectroscopic studies of Suwannee river fulvic acid complexation with aluminum, terbium and calcium, J. Inorg. Biochem., 2001, 87(1–2), 81–96 CrossRef CAS PubMed.
- S. W. Krasner, H. S. Weinberg, S. D. Richardson, S. J. Pastor, R. Chinn, M. J. Sclimenti, G. D. Onstad and A. D. Thruston Jr, Occurrence of a New Generation of Disinfection Byproducts, Environ. Sci. Technol., 2006, 40(23), 7175–7185 CrossRef CAS PubMed.
- P. C. Singer, DPBs in Drinking Water, J.–Am. Water Works Assoc., 2006, 98, 73–79 CAS.
- A. Matilainen, M. Vepsalainen and M. Sillanpaa, Removal of natural organic matter from drinking water by advanced oxidation, Adv. Colloid Interface Sci., 2010, 159, 189–197 CrossRef CAS PubMed.
- Q. Zhou, Y. H. Zhong, X. Chen, J. H. Liu, X. J. Huang and Y. C. Wu, Adsorption and photocatalysis removal of fulvic acid by TiO2–graphene composites, J. Mater. Sci., 2014, 49, 1066–1075 CrossRef CAS.
- S. Zhang, X.-Y. Li and J. P. Chen, Preparation and evaluation of a magnetite-doped activated carbon fiber for enhanced arsenic removal, Carbon, 2010, 48, 60–67 CrossRef CAS.
- S. C. Smith and D. F. Rodrigues, Carbon-based nanomaterials for removal of chemical and biological contaminants from water: A review of mechanisms and applications, Carbon, 2015, 91, 122–143 CrossRef CAS.
- A. Kaur and U. Gupta, A review on applications of nanoparticles for the preconcentration of environmental pollutants, J. Mater. Chem., 2009, 19, 8279–8289 RSC.
- N. Savage and M. S. Diallo, Nanomaterials and water purification: Opportunities and challenges, J. Nanopart. Res., 2005, 7(4), 331–342 CrossRef CAS.
- M. M. Khin, S. Nair, V. J. Babu, R. Murugan and S. Ramakrishna, A review on nanomaterials for environmental remediation, Energy Environ. Sci., 2012, 5, 8075–8109 CAS.
- A. K. Geim and K. S. Novoselov, The rise of graphene, Nat. Mater., 2007, 6, 183–191 CrossRef CAS PubMed.
- J. Li, S. Zhang, C. Chen, G. Zhao, X. Yang, J. Li and X. Wang, Removal of Cu(II) and Fulvic Acid by Graphene Oxide Nanosheets Decorated with Fe3O4 Nanoparticles, ACS Appl. Mater. Interfaces, 2012, 4(9), 4991–5000 CAS.
- J. R. Potts, D. R. Dreyer, C. W. Bielawski and R. S. Ruoff, Graphene-based polymer nanocomposites, Polymer, 2011, 52(1), 5–25 CrossRef CAS.
- M. Terrones, O. Martin, M. González, J. Pozuelo, B. Serrano, J. C. Cabanelas, S. M. V. Díaz and J. Baselga, Interphases in Graphene Polymer-based Nanocomposites: Achievements and Challenges. 2011, vol. 23, 44, pp. 5302–5310 Search PubMed.
- C. Shan, H. Yang, D. Han, Q. Zhang, A. Ivaska and L. Niu, Langmuir, 2009, 25(20), 12030–12033 CrossRef CAS PubMed.
- Y. Zhu, D. K. James and J. M. Tour, New Routes to Graphene; Graphene Oxide and Their Related Applications, Advanced Materials Reviews, 2012, 24(36), 4924–4955 CrossRef CAS PubMed.
- T. Kuila, S. Bose, A. K. Mishra, P. Khanra, N. H. Kim and J. H. Lee, Chemical functionalization of graphene and its applications, Prog. Mater. Sci., 2012, 57(7), 1061–1105 CrossRef CAS.
- J. Guo, R. Wang, W. W. Tjiu, J. Pan and T. Liu, Synthesis of Fe nanoparticles@graphene composites for environmental applications, J. Hazard. Mater., 2012, 225–226, 63–73 CrossRef CAS PubMed.
- V. K. Gupta, B. Gupta, A. Rastogi, S. Agarwal and A. Nayak, Pesticides removal from waste water by activated carbon prepared from waste rubber tire, Water Res., 2011, 45(13), 4047–4055 CrossRef CAS PubMed.
- Y. He, L. Huang, J. S. Cai, X. M. Zheng and S. G. Sun, Structure and electrochemical performance of nanostructured Fe3O4/carbon nanotube composites as anodes for lithium ion batteries, Electrochim. Acta, 2010, 55, 1140–1144 CrossRef CAS.
- V. Singh, D. Joung, L. Zhaia, S. Das, S. I. Khondaker and S. Seal, Graphene based materials: Past; present and future, Prog. Mater. Sci., 2011, 56(8), 1178–1271 CrossRef CAS.
- N. Saleh, H. J. Kim, T. Phenrat, K. Matyjaszewski, R. D. Tilton and G. V. Lowry, Ionic Strength and Composition Affect the Mobility of Surface-Modified Fe0 Nanoparticles in Water-Saturated Sand Columns, Environ. Sci. Technol., 2008, 42(9), 3349–3355 CrossRef CAS PubMed.
- F. Yu, S. Sun, J. Ma and S. Han, Enhanced removal performance of arsenate and arsenite by magnetic graphene oxide with high iron oxide loading, Phys. Chem. Chem. Phys., 2015, 17, 4388–4397 RSC.
- D. Dinda, A. Gupta and S. K. Saha, Removal of toxic Cr(VI) by UV active functionalized graphene oxide for water purification, J. Mater Chem. A, 2013, 1(37), 11221–11228 CAS.
- A. S. K. Kumar and N. Rajesh, Exploring the interesting interaction between graphene oxide; Aliquat-336 (a room temperature ionic liquid) and chromium(VI) for wastewater treatment, RSC Adv., 2013, 3(8), 2697–2709 RSC.
- Y. Gao, Y. Li, L. Zhang, H. Huang, J. Hu, S. M. Shah and X. Su, Adsorption and removal of tetracycline antibiotics from aqueous solution by graphene oxide, J. Colloid Interface Sci., 2012, 368, 540–546 CrossRef CAS PubMed.
- V. Chandra and K. S. Kim, Highly selective adsorption of Hg2+ by a polypyrrole-reduced graphene oxide composite, Chem. Commun., 2011, 47, 3942–3944 RSC.
- W. Gao, M. Majumder, L. B. Alemany, T. N. Narayanan, M. A. Ibarra, B. K. Pradhan and P. M. Ajayan, Engineered Graphite Oxide Materials for Application in Water Purification, ACS Appl. Mater. Interfaces, 2011, 3, 1821–1826 CAS.
- V. Chandra, J. Park, Y. Chun, J. W. Lee, I. C. Hwang and K. S. Kim, Water-Dispersible Magnetite-Reduced Graphene Oxide Composites for Arsenic Removal, ACS Nano, 2010, 4(7), 3979–3986 CrossRef CAS PubMed.
- T. S. Sreeprasad, S. S. Gupta, S. M. Maliyekkal and T. Pradeep, Immobilized graphene-based composite from asphalt: Facile synthesis and application in water purification, J. Hazard. Mater., 2013, 246–247, 213–220 CrossRef CAS PubMed.
- K. Zhang, V. Dwivedi, C. Chi and J. Wu, Graphene oxide/ferric hydroxide composites for efficient arsenate removal from drinking water, J. Hazard. Mater., 2010, 182, 162–168 CrossRef CAS PubMed.
- Z. Ding, X. Hu, V. L. Morales and B. Gao, Filtration and transport of heavy metals in graphene oxide enabled sand columns, Chem. Eng. J., 2014, 257, 248–252 CrossRef CAS.
- A. Y. Romanchuk, A. S. Slesarev, S. N. Kalmykov, D. V. Kosynkinz and J. M. Tour, Graphene oxide for effective radionuclide removal, Phys. Chem. Chem. Phys., 2013, 15, 2321–2327 RSC.
- S. T. Yang, S. Chen, Y. Chang, A. Cao, Y. Liu and H. Wang, Removal of methylene blue from aqueous solution by graphene oxide, J. Colloid Interface Sci., 2011, 359, 24–29 CrossRef CAS PubMed.
- C. Wang, J. Ni, J. Zhou, J. Wen and X. Lü, Strategically designed porous polysilicate acid/graphene composites with wide pore size for methylene blue removal, RSC Adv., 2013, 3, 23139–23145 RSC.
- L. Cui, Y. Wang, L. Hu, L. Gao, B. Du and Q. Wei, Mechanism of Pb(II) and methylene blue adsorption onto magnetic carbonate hydroxyapatite/grapheme oxide, RSC Adv., 2015, 5, 9759–9770 RSC.
- S. Song, Y. Ma, H. Shen, M. Zhang and Z. Zhang, Removal and recycling of ppm levels of methylene blue from an aqueous solution with grapheme oxide, RSC Adv., 2015, 5, 27922–27932 RSC.
- Y. Guo, J. Deng, J. Zhu, C. Zhou, C. Zhou, X. Zhou and R. Bai, Removal of anionic azo dye from water with activated graphene oxide: kinetic, equilibrium and thermodynamic modeling, RSC Adv., 2016, 6, 39762–39773 RSC.
- A. Asfaram, M. Ghaedi, A. Goudarzi and M. Rajabi, Response surface methodology approach for optimization of simultaneous dyes and metal ions ultrasound-assisted adsorption onto Mn doped Fe3O4-NPs loaded on AC: Kinetic and isotherm study, Dalton Trans., 2015, 44, 14707–14723 RSC.
- W. S. Hummers and R. E. Offeman, J. Am. Chem. Soc., 1958, 80, 1339 CrossRef CAS.
- D. C. Marcano, D. V. Kosynkin, J. M. Berlin, A. Sinitskii, Z. Sun, A. Slesarev, L. B. Alemany, W. Lu and J. M. Tour, Improved Synthesis of Graphene Oxide, ACS Nano, 2010, 4(8), 4806–4814 CrossRef CAS PubMed.
- S. Stankovich, D. A. Dikin, G. H. B. Dommett, K. M. Kohlhaas, E. J. Zimney, E. A. Stach, R. D. Piner, S. T. Nguyen and R. S. Ruoff, Graphene-based composite materials, Nature, 2006, 442, 282–286 CrossRef CAS PubMed.
- S. Stankovich, D. A. Dikin, R. D. Piner, K. A. Kohlhaas, A. Kleinhammes, Y. Jia, Y. Wu, S. T. Nguyen and R. S. Ruoff, Synthesis of graphene-based nanosheets via chemical reduction of exfoliated graphite oxide, Carbon, 2007, 45, 1558–1565 CrossRef CAS.
- S. Park, J. An, I. Jung, R. D. Piner, S. J. An, X. Li, A. Velamakanni and R. S. Ruoff, Colloidal Suspensions of Highly Reduced Graphene Oxide in a Wide Variety of Organic Solvents, Nano Lett., 2009, 9(4), 1593–1597 CrossRef CAS PubMed.
- S. Park, J. An, J. R. Potts, A. Velamakanni, S. Murali and R. S. Ruoff, Hydrazine-reduction of graphite- and graphene oxide, Carbon, 2011, 49, 3019–3023 CrossRef CAS.
- I. Chowdhury, M. C. Duch, N. D. Mansukhani, M. C. Hersam and D. Bouchard, Colloidal Properties and Stability of Graphene Oxide Nanomaterials in the Aquatic Environment, Environ. Sci. Technol., 2013, 47(12), 6288–6296 CrossRef CAS PubMed.
- S. G. Wang, X. W. Liu, W. X. Gong, W. Nie, B. Y. Gao and Q. Y. Yue, Adsorption of fulvic acids from aqueous solutions by carbon nanotubes, J. Chem. Technol. Biotechnol., 2007, 82, 698–704 CrossRef CAS.
- S. G. Wang, X. F. Sun, X. W. Liu, W. X. Gong, B. Y. Gao and N. Bao, Chitosan hydrogel beads for fulvic acid adsorption: Behaviors and mechanisms, Chem. Eng. J., 2008, 142, 239–247 CrossRef CAS.
- T. Mohanta and S. Goel, Assessment of Water Quality of Three Different Aquatic Environments Over Three Seasons, Singapore 1st International Congress on Environmental, Biotechnology, and Chemistry Engineering. IPCBEE, IACSIT Press, 2014, p. 64 Search PubMed.
- H. Fu and X. Quan, Complexes of fulvic acid on the surface of hematite, goethite, and akaganeite: FTIR observation, Chemosphere, 2006, 63(3), 403–410 CrossRef CAS PubMed.
- E. Y. Choi, T. H. Han, J. Hong, J. E. Kim, S. H. Lee, H. W. Kim and S. O. Kim, Noncolvalent functionalization of Graphene with end-functional Polymers, J. Mater. Chem., 2010, 20, 1907–1912 RSC.
- F. Y. Ban, S. R. Majid, N. M. Huang and H. N. Lim, Graphene oxide and its electrochemical performance, Int. J. Electrochem. Sci., 2012, 7, 4345–4351 CAS.
- Z. C. Ling and A. Wang, A systematic spectroscopic study of eight hydrous ferric sulfates relevant to Mars, Icarus, 2010, 209(2), 422–433 CrossRef.
- D. R. Dreyer, S. Park, C. W. Bielawski and R. S. Ruoff, The chemistry of graphene oxide, Chem. Soc. Rev., 2010, 39, 228–240 RSC.
- R. K. Upadhyay, N. Soin and S. S. Roy, Role of graphene/metal oxide composites as photocatalysts; adsorbents and disinfectants in water treatment: a review, RSC Adv., 2014, 4, 823–3851 Search PubMed.
- L. Jiang, Y. Liu, G. Zeng, F. Xiao, X. Hua, X. Hu, H. Wang, T. Li, L. Zhou and X. Tan, Removal of 17b-estradiol by few-layered graphene oxide nano sheets from aqueous solutions: External influence and adsorption mechanism, Chem. Eng. J., 2016, 284, 93–102 CrossRef CAS.
- T. S. Sreeprasad, S. M. Maliyekkal, K. P. Lisha and T. Pradeep, Reduced graphene oxide–metal/metal oxide composites: Facile synthesis and application in water purification, J. Hazard. Mater., 2011, 186(1), 921–931 CrossRef CAS PubMed.
- P. K. Boruah, D. J. Borah, J. Handique, P. Sharma, P. Sengupta and M. R. Das, Facile synthesis and characterization of Fe3O4 nanopowder and Fe3O4/reduced graphene oxide nanocomposite for methyl blue adsorption: A comparative study, J. Environ. Chem. Eng., 2015, 3(3), 1974–1985 CrossRef CAS.
- X. Sheng, W. Cai, L. Zhong, D. Xie and X. Zhang, Synthesis of Functionalized Graphene/Polyaniline Nanocomposites with Effective Synergistic Reinforcement on Anticorrosion, Ind. Eng. Chem. Res., 2016, 55, 8576–8585 CrossRef CAS.
- J. R. Lead, E. Balnois, M. Hosse, R. Menghetti and K. J. Wilkinson, Characterization of Norwegian natural organic matter: size, diffusion coefficients and electrophoretic mobilities, Environ. Int., 1999, 25(2/3), 245–258 CrossRef CAS.
- J. Guo and J. Ma, AFM study on the sorbed NOM and its fractions isolated from River Songhua, Water Res., 2006, 40, 1975–1984 CrossRef CAS PubMed.
- X. Fang, X. Xu, S. Wang and D. Wang, Adsorption Kinetics and Equilibrium of Cu(II) from Aqueous Solution by Polyaniline/Coconut Shell-Activated Carbon Composites, J. Environ. Eng., 2013, 139, 1279–1284 CrossRef CAS.
- F. C. Wu, R. L. Tseng and R. S. Juang, Characteristics of Elovich equation used for the analysis of adsorption kinetics in dye-chitosan systems, Chem. Eng. J., 2009, 150, 366–373 CrossRef CAS.
- Q. Zhou, Y. H. Zhong, X. Chen, J. H. Liu, X. J. Huang and Y. C. Wu, Adsorption and photocatalysis removal of fulvic acid by TiO2–graphene composites, J. Mater. Sci., 2014, 49, 1066–1075 CrossRef CAS.
- S. Vreysen and A. Maes, Adsorption mechanism of humic and fulvic acid onto Mg/Al layered double hydroxides, Appl. Clay Sci., 2008, 38, 237–249 CrossRef CAS.
- Y. S. Ho and G. McKay, Pseudo-second order model for sorption processes, Process Biochem., 1999, 34, 451–465 CrossRef CAS.
- K. V. Kumar, Linear and non-linear regression analysis for the sorption kinetics of methylene blue onto activated carbon, J. Hazard. Mater., 2006, B137, 1538–1544 CrossRef PubMed.
- W. Stumm, L. Sigg and B. Sulzberger. Chemistry of the Solid–Water Interface: Processes at the Mineral–Water and Particle–Water Interface in Natural Systems, Wiley, 1992, p. 112 Search PubMed.
- A. A. M. Daifullah, B. S. Girgis and H. M. H. Gad, A study of the factors affecting the removal of humic acid by activated carbon prepared from biomass material, Colloids Surf., A, 2004, 235(1–3), 1–10 CrossRef CAS.
- S. Pourbeyram, Effective Removal of Heavy Metals from Aqueous Solutions by Graphene Oxide–Zirconium Phosphate (GO–Zr-P) Nanocomposite, Ind. Eng. Chem. Res., 2016, 55, 5608–5617 CrossRef CAS.
| This journal is © The Royal Society of Chemistry 2017 |