DOI:
10.1039/C6RA28098F
(Paper)
RSC Adv., 2017,
7, 21758-21767
Higher UV-shielding ability and lower photocatalytic activity of TiO2@SiO2/APTES and its excellent performance in enhancing the photostability of poly(p-phenylene sulfide)
Received
12th December 2016
, Accepted 20th March 2017
First published on 19th April 2017
Abstract
U–TiO2 is successfully coated with SiO2 and subsequently well modified by APTES, and the core–shell structure exists on TiO2@SiO2 and TiO2@SiO2/APTES, which greatly reduces aggregation of the TiO2 nanoparticles. The photocatalytic activities of U–TiO2, TiO2@SiO2, and TiO2@SiO2/APTES are evaluated using MB decomposition. Nearly 50% of the MB is degraded after 15 min in the presence of the U–TiO2 under UV radiation (300 W), and only 17.44% and 4.18% of the MB is degraded in the presence of the TiO2@SiO2-0.6 and TiO2@SiO2/APTES-1. However, TiO2@SiO2/APTES-0.6 and TiO2@SiO2-0.2 exhibit excellent UV absorbance capacities, and the TiO2@SiO2/APTES-0.6 achieves 80% of the UV-shielding ability of U–TiO2. Poly(p-phenylene sulfide) (PPS) is an easily photodegraded material and TiO2/PPS is more seriously photodegraded than PPS, however, the TiO2@SiO2/APTES nanoparticles can effectively protect the PPS from UV degradation, owing to their lower photocatalytic activities, higher UV-shielding abilities and easy dispersion in the PPS matrix. The breaking strength retention rate of the 1 wt% TiO2@SiO2/APTES/PPS film shows a maximum increase of 38.26%, and the breaking elongation retention rate increased by 41.64% at 2 wt% TiO2@SiO2/APTES loading. These results reveal that the incorporation of the TiO2@SiO2/APTES nanoparticles into the PPS matrix imparts excellent anti-UV properties to the PPS matrix, leading to a mechanical performance improvement.
Introduction
Over the last few years, increasing reports of ultraviolet aging owing to the collapse of the ozone layer have made people greatly aware of the danger to polymers from prolonged exposure to UV rays.1,2 The ultraviolet degradation of polymers is hugely important because resistance to aging, especially to UV light, is a key factor for outdoor applications.3 UV light, which accounts for about 7% of terrestrial sunlight, has been proven to cause aging of polymers, such as yellowing, brittleness, and even degradation.4,5 Both organic ultraviolet light stabilizers and inorganic nanoparticles have been introduced into polymer matrices to improve the UV stability of polymers.6–8 Compared with organic UV filters, inorganic nanoparticles are generally accepted as more stable and safe anti-UV agents. In particular, as an inorganic anti-UV agent, rutile TiO2 nanoparticles have been widely employed in polymers to shield against UV radiation.9–11
It is well known that TiO2 has excellent photocatalytic activity. However, for sunscreen and other applications that require a low photocatalytic activity, it would be of great value to modify the performance of TiO2. TiO2 nanoparticles absorb UV light and catalyze the formation of super oxide and hydroxyl radicals on the surface of the TiO2, and then these radicals may cause the degradation of organic components. Therefore, TiO2 is generally coated with inert materials such as SiO2 and Al2O3 to inhibit its photocatalytic activity by disturbing the formation of these radicals, which are produced by the reaction of O2 and/or H2O with the electron–hole pair.12 Using a microwave assisted sol–gel method, Furusawa et al.13 coated rutile TiO2 with SiO2 to suppress its photocatalytic activity. Similarly, Siddiquey et al.14 applied a MW irradiation method to obtain the SiO2 coated TiO2 nanoparticles, which showed a higher inhibition of photocatalytic activity and superior UV-shielding characteristics than those of particles coated using the conventional solution method. In a report by El-Toni et al.,12 control of the SiO2 shell thickness and microporosity of TiO2–SiO2 core–shell type nanoparticles was conducted to depress the photocatalytic activity of TiO2. The coating parameters were optimized to attain larger amounts of precipitated SiO2 and thicker shells with lower microporosity, which in turn resulted in great depression of the photocatalytic activity. In previous research, treatments of the TiO2 surface with various silane coupling agents were also conducted.15–19 Zhao et al.18 have applied 3-aminopropyltrimethoxysilane (APTMS) and 3-isocyanatopropyltrimethoxysilane (IPTMS) to coat commercial TiO2 nanoparticles, which acted to suppress the photocatalytic activity of the TiO2 nanoparticles while maintaining their excellent UV-shielding properties. However, the UV-shielding ability of the original TiO2 particles decreases as a result of excessive coating. Thus, the effective inhibition of the photocatalytic activity with lower coating amounts will be essential for anti-photoaging in organic polymers. So, it can be speculated that simultaneous or continuous coating of SiO2 and a silane coupling agent is potentially useful for suppressing the photocatalytic activity and maintaining the excellent UV-shielding ability by changing the surface characteristics.20
PPS is a semicrystalline engineering plastic with a symmetrical rigid backbone chain composed of para-substituted phenylene rings and sulfur atoms. It possesses excellent properties such as heat resistance, flame resistance, and corrosion resistance, which have resulted in PPS being widely applied in electronics, aerospace, and chemical industries, etc.21 However, due to the poor UV-resistance properties, the photodegradation of PPS manifests itself not only in yellowing and color-darkening, but also in a serious reduction of the mechanical properties as a result of UV radiation.22,23 The last one is the most important obstacle to the practical application of PPS. To the best of our knowledge, few studies regarding the preparation of anti-UV PPS materials have been published.22
In this manuscript, TiO2 nanoparticles coated with different thicknesses of SiO2 were prepared from tetraethoxysilane (TEOS) and commercial TiO2 nanoparticles, and TiO2@SiO2 was further modified with APTES. The photocatalytic activities and UV-shielding capabilities of TiO2@SiO2 and TiO2@SiO2/APTES were characterized, and the nanoparticles with optimal performance were selected to improve the UV-resistance properties of PPS. The photostability of the PPS composite under UV-radiation was studied using an ultraviolet accelerated weatherometer, and the aim of this work is to suppress the photocatalytic activity of TiO2 and improve its dispersion in PPS to develop a stable and safe inorganic sunscreen with superior UV-shielding capability and inhibited photocatalytic activity.
Experimental section
Materials
The PPS resins (0320) used in this study were purchased from Ticona Engineering Polymers Co, in powder form. Rutile TiO2 nanoparticles and 3-aminopropyltriethoxysilane (APTES) were provided by Aladdin Industrial Corporation. Tetraethyl orthosilicate (TEOS) was supplied by Aldrich-Sigma. Methylene blue (MB) was obtained from Kermel Chemical Reagent Co. Ltd (Tianjin, China). These reagents were used as received without further purification.
Synthesis of the SiO2 coated TiO2 nanoparticles
0.5 g of TiO2 nanoparticles were homogeneously dispersed in a mixed solution of ethanol (140 mL), deionised water (30 mL), and ammonia aqueous solution (28%, 3.0 mL), and then the TiO2 nanopowder dispersion was subjected to mechanical stirring and sonication in a water bath. Subsequently, the appropriate amount (TEOS/TiO2 weight ratio = 0.2, 0.4, 0.6) of TEOS pre-dissolved in ethanol (10 mL) was added to the above mixture. After 2 h, the sonication was stopped and the mixture was kept stirring for 6 h. Then, the SiO2 coated TiO2 nanoparticles were separated from solution by centrifugation (8000 rpm, 10 min) followed by washing with ethanol several times. After the process was finished, the particles were dried in a vacuum oven at 60 °C for 12 h. The sample modified by TEOS was described as TiO2@SiO2 and the sample without treatment was described as U–TiO2.
APTES modification of the TiO2 and SiO2 coated TiO2 nanoparticles
A precise amount of TEOS (TEOS/TiO2 weight ratio = 0.2) was added to the TiO2 nanopowder suspension. Subsequently, an appropriate amount (APTES/TiO2 weight ratio = 0.2, 0.6, 1) of APTES together with ethanol (10 mL) was loaded into the TiO2 nanopowder suspension dropwise under continuous stirring and sonication conditions. After 2 h, the sonication was stopped and the mixture was kept stirring for 6 h. APTES modification of the SiO2 coated TiO2 nanoparticles was obtained by centrifugation (8000 rpm, 10 min) followed by washing with ethanol and deionised water alternately for at least 3 cycles, and drying for 12 h in a vacuum oven at 60 °C. The sample modified with APTES was described as TiO2@SiO2/APTES.
Preparation of the PPS composite films
The PPS composite films were prepared by mixing nanoparticles into the PPS matrix, using caprolactam as the solvent, at 255 °C. Subsequently, the obtained mixture was quickly poured onto the surface of a hot plate and spread with a casting bar into thin films. And then the PPS composite films were placed into the alcohol and water bath alternately for more than 24 hours to completely remove the solvents. Finally, the films were freeze-dried using a freeze dryer. Four composite films were prepared, with nanoparticle quantities of 0.5, 1.0, 2.0 and 5.0 wt%, respectively. For comparison, the neat PPS films were also prepared under the same conditions.
Photocatalytic activity measurement
The photocatalytic activities of the TiO2@SiO2 and TiO2@SiO2/APTES particles were characterized by measuring the decomposition of methylene blue (MB). The dried samples (0.1 g) were loaded into a MB aqueous solution (10 mg L−1, 200 mL) with the aid of sonication. The obtained suspension was kept in the dark and magnetically stirred for 1 h to ensure adsorption-desorption equilibrium of MB on the surface of the samples. Then the suspension was illuminated for 90 min in the photochemical reactors (UV lamp, 300 W) with continuous stirring and sampling at 15 min intervals from the reaction system. The absorbance of MB at 664 nm was measured using a UV-vis spectrophotometer (V-1200, MAPADA).
UV treatment of the PPS composite films
The neat PPS films and composite films were irradiated in the ultraviolet accelerated weatherometer (Dongguan, China) for 192 h. The distance between the films and the UV lamp (313 nm, 95 W) was fixed at 7 cm.
Characterization techniques
The morphology of the PPS composite films was characterized using a S-4800 Hitachi scanning electron microscope (SEM). TEM images were obtained from a H7650 Hitachi transmission electron microscope to examine the uniformity and dispersion of the nanoparticles. Infrared spectra were recorded on a TENSOR 37 Fourier transform infrared spectroscope (FT-IR, BRUKER, Germany) in the wavenumber range of 4000–400 cm−1. X-ray photoelectron spectroscopy (XPS) was performed on a Thermo Fisher K-alpha photoelectron spectrometer. The thermal behavior of the nanoparticles was evaluated using STA409 PC thermogravimetry (TG, NETZSCH, Germany) under a N2 atmosphere from room temperature to 1000 °C with a heating rate at 10 °C min−1. The contact angle of the nanoparticles was measured using a DSA 100 (KRUSS) drop shape analysis system. Before the measurement, adequate amounts of nanoparticles were dispersed in ethanol with ultrasonic treatment for 1 h. Then, the suspension was dropped onto the surface of a glass plate to form a uniform film. Every film was tested at least three times and then an average value was obtained. A UV-vis spectrophotometer (Lambda 750, PerkinElmer) was used to characterize the transmittance of the films with and without the modified nanoparticles. The mechanical properties of PPS films before and after UV radiation for 192 h were determined with a single strength tester (LLY-06, China) at ambient temperature. The lengths and widths of each film were 30 mm and 10 mm. Fifteen films of every sample were tested and the average values were evaluated.
Results and discussion
FT-IR studies of the nanoparticles
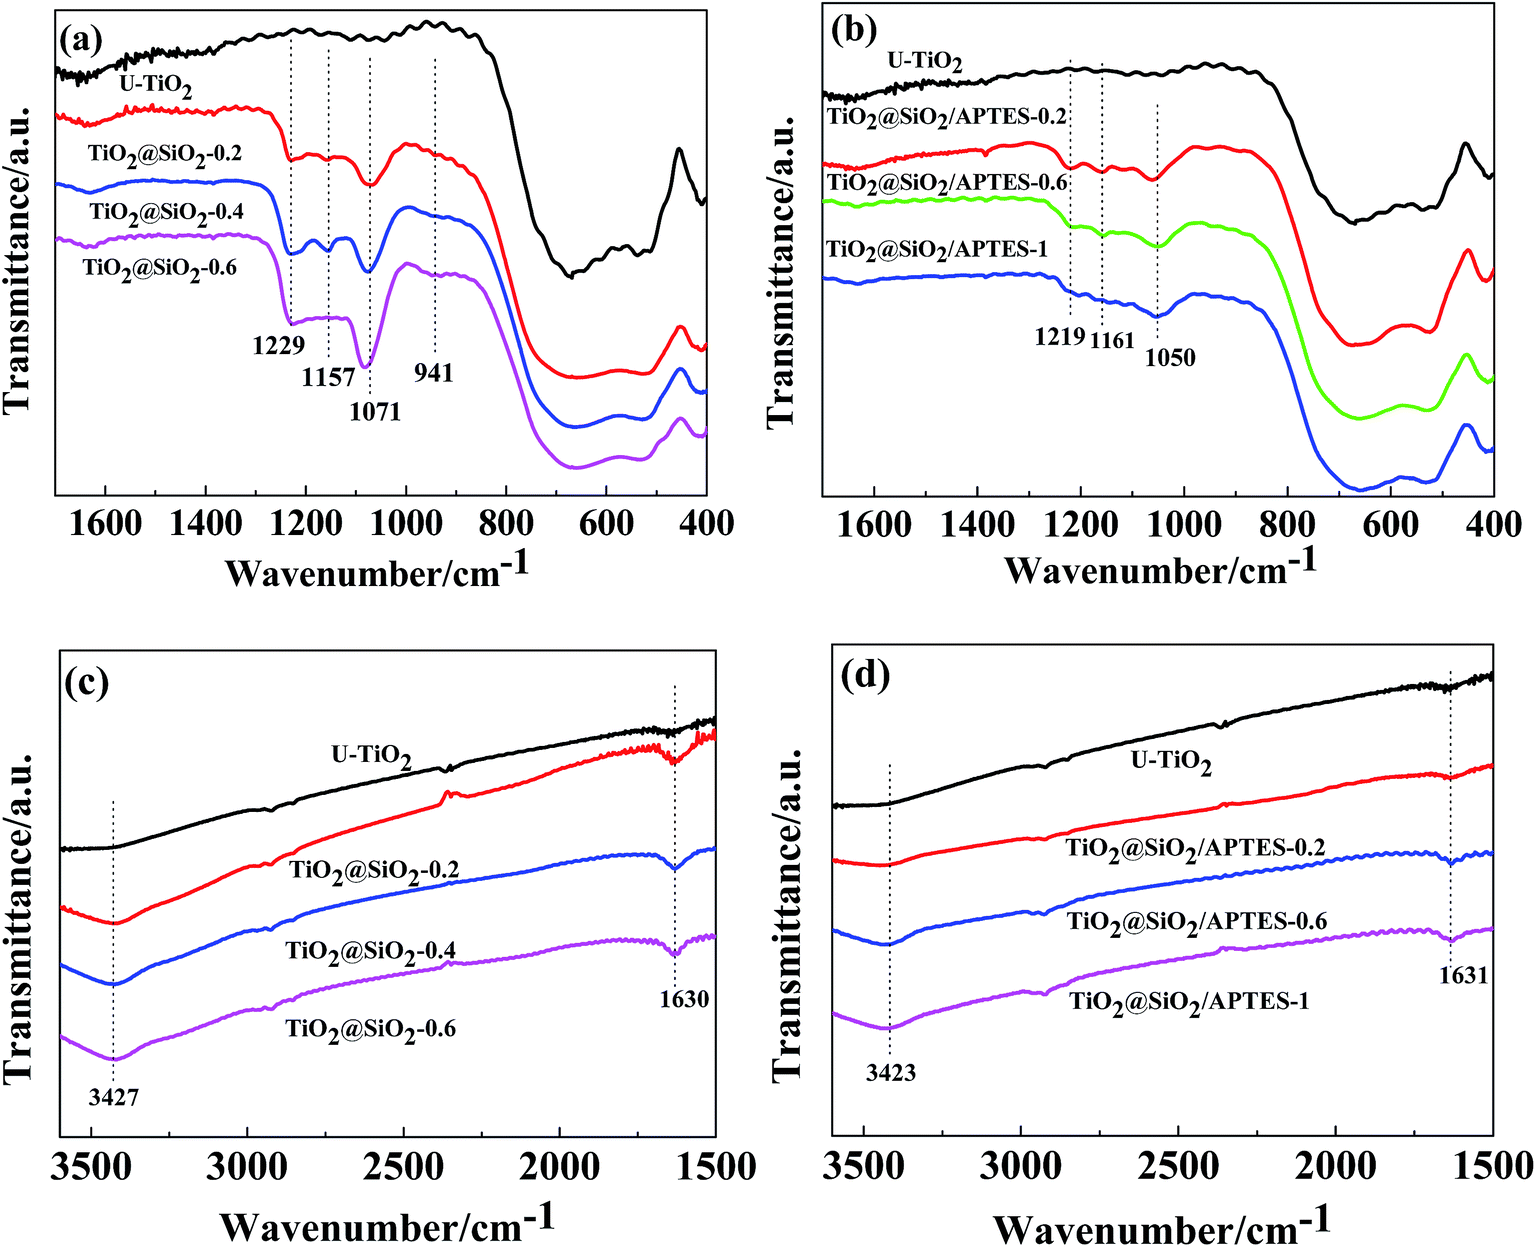
FT-IR spectra of the U–TiO2, TiO2@SiO2 and TiO2@SiO2/APTES nanoparticles are shown in Fig. 1. All spectra (Fig. 1c and d) show that adsorbed water and hydroxyl groups existed on the surface of all of the samples, revealed by the presence of the broad peak at around 3420 cm−1 and the sharp peak at around 1630 cm−1.14,24 An intense absorption peak is also found at 800–400 cm−1, which was assigned to the stretching vibration of the Ti–O–Ti bond. For the TiO2@SiO2 particles, new peaks at 1229, 1157, 1071 and 941 cm−1 are also observed. According to the literature, the characteristic peak at 1071 cm−1 is caused by the stretching vibration of the Si–O–Si bond.24 Furthermore, the absorption peaks at 1157 cm−1 and 941 cm−1 arise from Si–OH groups and the Ti–O–Si bond, respectively.10,13 The appearance of these peaks clearly shows that the condensation reaction of Si(OH)4 and the hydrolyzed production of TEOS and TiO2 surface hydroxyl groups takes place to form Ti–O–Si bonds.25 In addition, the peak intensity of the Si–O–Si bond (1071 cm−1) and the Ti–O–Si bond (941 cm−1) increases with an increasing amount of the SiO2 coating, suggesting that the SiO2 shell tends to be denser when increasing the amount of SiO2 coating. Similarly, for the TiO2@SiO2/APTES particles, the intensity of the absorption peaks at 1631 (Fig. 1d) and 1050 cm−1 (Fig. 1b) increases with increasing APTES loading amounts. It can be considered that the peak of the N–H bending vibration of primary amine10 (1605 cm−1) overlapped with the peak (1631 cm−1) arising from the H–O–H bending vibration. These analyses show that the TiO2@SiO2 nanoparticles are successfully prepared and modified with APTES.
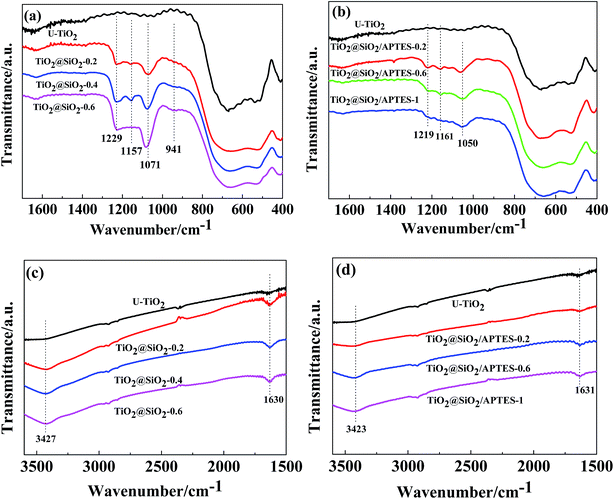 |
| | Fig. 1 FT-IR spectra of (a) U–TiO2, TiO2@SiO2 (weight ratio = 0.2, 0.4, 0.6) and (b) U–TiO2, TiO2@SiO2/APTES (weight ratio = 0.2, 0.6, 1) at a range of 1700–400 cm−1, (c) U–TiO2, TiO2@SiO2 (weight ratio = 0.2, 0.4, 0.6) and (d) U–TiO2, TiO2@SiO2/APTES (weight ratio = 0.2, 0.6, 1) at a range of 3600–1500 cm−1. | |
XPS studies of the nanoparticles
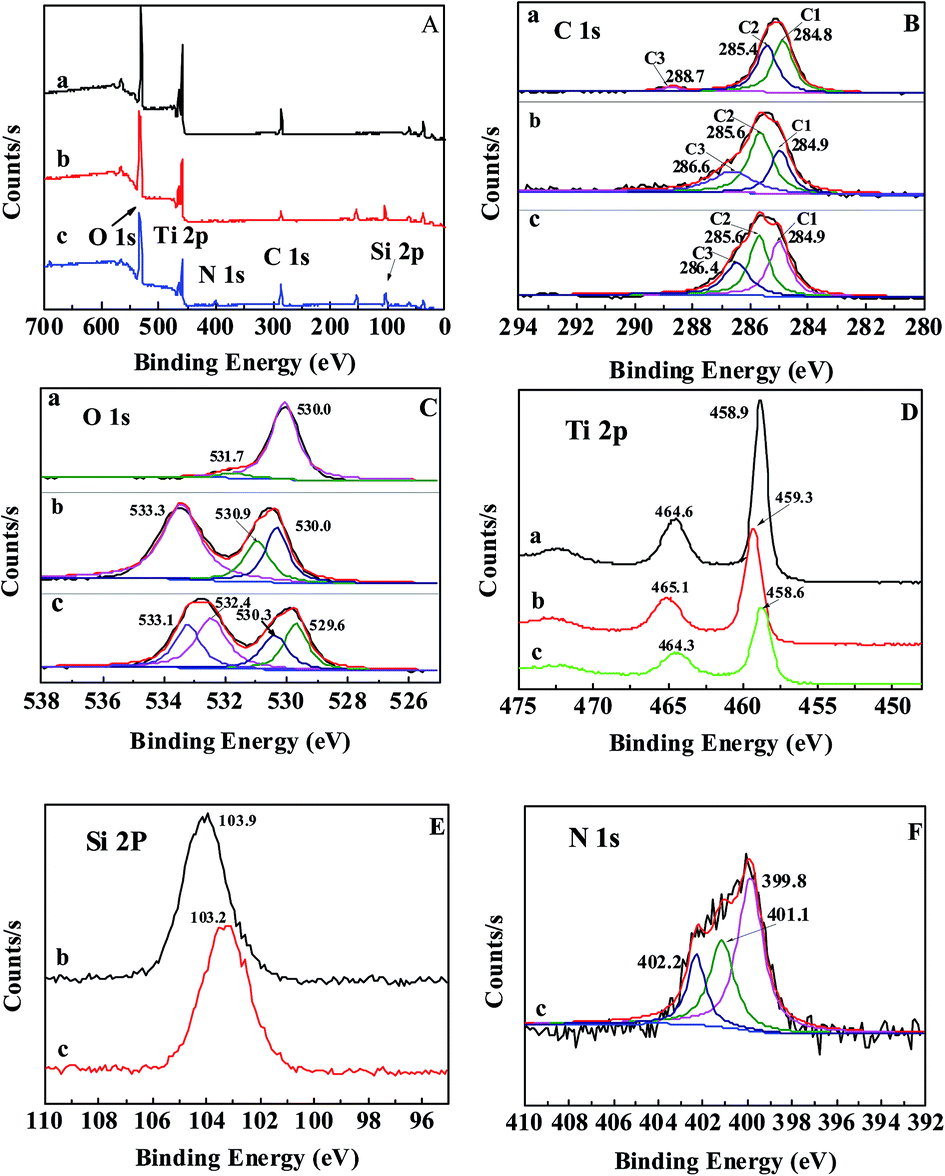
XPS analysis was utilized to characterize the chemical composition of the nanoparticles’ surface. The survey spectrum in Fig. 2A shows the presence of C, O, and Ti in the U–TiO2 and C, O, Ti, and Si in the TiO2@SiO2, while elements C, O, Ti, Si, and N are found in the TiO2@SiO2/APTES. The high-resolution detailed XPS spectra were carried out around peaks of interest, specifically C 1s, O 1s, Ti 2p, Si 2p, and N 1s. Fig. 2B shows high-resolution spectra of the C 1s signal of (a) U–TiO2, (b) TiO2@SiO2, and (c) TiO2@SiO2/APTES. In the C 1s XPS line, three C components, C1, C2, and C3, are fitted and assigned according to literature values.12,25 The binding energy of the C1, C2, and C3 peaks for U–TiO2 at 284.8, 285.4, and 288.7 eV is attributed to the presence of CHXand C–O and C![[double bond, length as m-dash]](https://www.rsc.org/images/entities/char_e001.gif) O bonds, respectively. Similarly, the C1, C2, and C3 peaks of the TiO2@SiO2 nanoparticles at 284.9, 285.6, and 286.6 eV arise from CHX and C–O and CO bonds, respectively.26,27 The above peaks (CHX, C–O and CO bonds) come from hydrocarbon impurities typically obtained during sample preparation and transportation. The TiO2@SiO2/APTES also exhibits three carbon components at 284.9, 285.6, and 286.4 eV, which are assigned to CHX/C–C/C–Si, C–H/C–N and CO functions, respectively.15 The C3 component is probably caused by the mixture of organic residues during sample treatment because the carbonyl function does not exist in APTES. The presence of the C 1s peaks of the C–Si and C–N bonds confirms that APTES was successfully grafted on the TiO2@SiO2 surface. For the O 1s signal of the U–TiO2, there are two typical O 1s peaks (530.0 and 531.7 eV). The peak at 530.0 eV corresponds to the O atoms in TiO2.28,29 Another peak at 531.7 eV is consistent with the peak position for surface termination oxygen30,31 or absorbed water.32,33 For the TiO2@SiO2 nanoparticles, the O 1s spectrum exhibits three peaks at 530.2, 530.9, and 533.3 eV, which can be attributed to the presence of the Ti–O–Ti, Ti–O–Si, and Si–O–Si functions, respectively.12 It can be inferred that Si is successfully combined onto the surface of the TiO2 nanoparticles, forming the Ti–O–Si bond. After APTES is grafted on to the surface of the TiO2@SiO2, the O 1s spectra were fitted using four components at 529.6, 530.3, 532.4, and 533.1 eV. The peaks at 529.6, 530.3, and 533.1 eV can be assigned to the O 1s in TiO2, Ti–O–Si, and SiO2, respectively. The new peak at a binding energy of 532.4 eV is also exhibited in the O 1s spectrum, which is in agreement with the surface species of O–Si-R.34 Fig. 2D–F show the high-resolution detailed scans of Ti 2p, Si 2p, and N 1s. In the Ti 2p3/2 spectrum, the binding energy of the U–TiO2 is found at 458.9 eV, whereas that of the TiO2@SiO2 is at 459.3 eV, 0.4 eV greater than the Ti 2p3/2 peak of U–TiO2. These results also clearly confirm the Ti–O–Si bond formation. The decrease of the electron density around the Ti atom is caused by the greater electronegativity of Si via O acting on Ti. The shielding effect is weakened, so the binding energy of the TiO2@SiO2 increased.12 However, the Ti 2p peak position of the TiO2@SiO2/APTES has no obvious chemical shift compared with the U–TiO2. It can be attributed to the fact that APTES mainly reacts with the Si–OH groups, and thus it has almost no influence on the binding energy of the Ti 2p of the U–TiO2. Furthermore, the intensity of the Ti 2p peaks significantly decreases after SiO2-coating and APTES modification, suggesting that the SiO2-coating actually formed on the surface of the TiO2 and followed modification with APTES. The presence of sharp peaks at 103.9 eV in the Si 2p signal is in agreement with the Si 2p in SiO2,35 which also indicates that the surface of the TiO2 is coated with SiO2. After the TiO2@SiO2 is treated with APTES, the binding energy of Si 2p shifts negatively by 0.7 eV. This negative shift indicates that APTES has been grafted onto the TiO2@SiO2 surface. The presence of three new peaks at 399.8, 401.1, and 402.2 eV in the N 1s spectrum provides direct evidence of the successful grafting of APTES onto the surface of the TiO2@SiO2. The peak at 399.8 eV is attributed to the free terminal amine groups on the APTES,36 whereas the peaks at 401.1 and 402.2 eV probably resulted from protonated amine NH3+ or hydrogen bonded NH2.21,37 Previous reports have shown that APTES has different attachment modes.34,38,39 The Si end of the APTES can react with the silanol groups of the TiO2@SiO2 via a condensation reaction to form Si–O–Si bonds, and the free NH2 termination can be observed at 399.8 eV (the desired attachment). However, if the NH2 groups of the APTES are attached to the surface (reverse attachment) through ionic bonding or hydrogen bonding with the silanol groups of the TiO2@SiO2, protonated amine NH3+ or hydrogen bonded NH2 can be observed at 401.1 or 402.2 eV, respectively. The reverse attachment of the APTES reveals that the silanization process is accompanied by a secondary reaction, which is in agreement with literature reports.40,41 Fig. 2F shows that the contribution of the peak at 399.8 eV is much higher than that of the peaks at 401.1 and 402.2 eV. The available data indicate that the APTES is mainly attached by silanized bonding with free NH2 termination.
O bonds, respectively. Similarly, the C1, C2, and C3 peaks of the TiO2@SiO2 nanoparticles at 284.9, 285.6, and 286.6 eV arise from CHX and C–O and CO bonds, respectively.26,27 The above peaks (CHX, C–O and CO bonds) come from hydrocarbon impurities typically obtained during sample preparation and transportation. The TiO2@SiO2/APTES also exhibits three carbon components at 284.9, 285.6, and 286.4 eV, which are assigned to CHX/C–C/C–Si, C–H/C–N and CO functions, respectively.15 The C3 component is probably caused by the mixture of organic residues during sample treatment because the carbonyl function does not exist in APTES. The presence of the C 1s peaks of the C–Si and C–N bonds confirms that APTES was successfully grafted on the TiO2@SiO2 surface. For the O 1s signal of the U–TiO2, there are two typical O 1s peaks (530.0 and 531.7 eV). The peak at 530.0 eV corresponds to the O atoms in TiO2.28,29 Another peak at 531.7 eV is consistent with the peak position for surface termination oxygen30,31 or absorbed water.32,33 For the TiO2@SiO2 nanoparticles, the O 1s spectrum exhibits three peaks at 530.2, 530.9, and 533.3 eV, which can be attributed to the presence of the Ti–O–Ti, Ti–O–Si, and Si–O–Si functions, respectively.12 It can be inferred that Si is successfully combined onto the surface of the TiO2 nanoparticles, forming the Ti–O–Si bond. After APTES is grafted on to the surface of the TiO2@SiO2, the O 1s spectra were fitted using four components at 529.6, 530.3, 532.4, and 533.1 eV. The peaks at 529.6, 530.3, and 533.1 eV can be assigned to the O 1s in TiO2, Ti–O–Si, and SiO2, respectively. The new peak at a binding energy of 532.4 eV is also exhibited in the O 1s spectrum, which is in agreement with the surface species of O–Si-R.34 Fig. 2D–F show the high-resolution detailed scans of Ti 2p, Si 2p, and N 1s. In the Ti 2p3/2 spectrum, the binding energy of the U–TiO2 is found at 458.9 eV, whereas that of the TiO2@SiO2 is at 459.3 eV, 0.4 eV greater than the Ti 2p3/2 peak of U–TiO2. These results also clearly confirm the Ti–O–Si bond formation. The decrease of the electron density around the Ti atom is caused by the greater electronegativity of Si via O acting on Ti. The shielding effect is weakened, so the binding energy of the TiO2@SiO2 increased.12 However, the Ti 2p peak position of the TiO2@SiO2/APTES has no obvious chemical shift compared with the U–TiO2. It can be attributed to the fact that APTES mainly reacts with the Si–OH groups, and thus it has almost no influence on the binding energy of the Ti 2p of the U–TiO2. Furthermore, the intensity of the Ti 2p peaks significantly decreases after SiO2-coating and APTES modification, suggesting that the SiO2-coating actually formed on the surface of the TiO2 and followed modification with APTES. The presence of sharp peaks at 103.9 eV in the Si 2p signal is in agreement with the Si 2p in SiO2,35 which also indicates that the surface of the TiO2 is coated with SiO2. After the TiO2@SiO2 is treated with APTES, the binding energy of Si 2p shifts negatively by 0.7 eV. This negative shift indicates that APTES has been grafted onto the TiO2@SiO2 surface. The presence of three new peaks at 399.8, 401.1, and 402.2 eV in the N 1s spectrum provides direct evidence of the successful grafting of APTES onto the surface of the TiO2@SiO2. The peak at 399.8 eV is attributed to the free terminal amine groups on the APTES,36 whereas the peaks at 401.1 and 402.2 eV probably resulted from protonated amine NH3+ or hydrogen bonded NH2.21,37 Previous reports have shown that APTES has different attachment modes.34,38,39 The Si end of the APTES can react with the silanol groups of the TiO2@SiO2 via a condensation reaction to form Si–O–Si bonds, and the free NH2 termination can be observed at 399.8 eV (the desired attachment). However, if the NH2 groups of the APTES are attached to the surface (reverse attachment) through ionic bonding or hydrogen bonding with the silanol groups of the TiO2@SiO2, protonated amine NH3+ or hydrogen bonded NH2 can be observed at 401.1 or 402.2 eV, respectively. The reverse attachment of the APTES reveals that the silanization process is accompanied by a secondary reaction, which is in agreement with literature reports.40,41 Fig. 2F shows that the contribution of the peak at 399.8 eV is much higher than that of the peaks at 401.1 and 402.2 eV. The available data indicate that the APTES is mainly attached by silanized bonding with free NH2 termination.
 |
| | Fig. 2 (A) XPS survey spectra and (B) C 1s, (C) O 1s, (D) Ti 2p, (E) Si 2p, and (F) N 1s high-resolution spectra of (a) U–TiO2, (b) TiO2@SiO2-0.2, and (c) TiO2@SiO2/APTES-0.6. | |
TG study
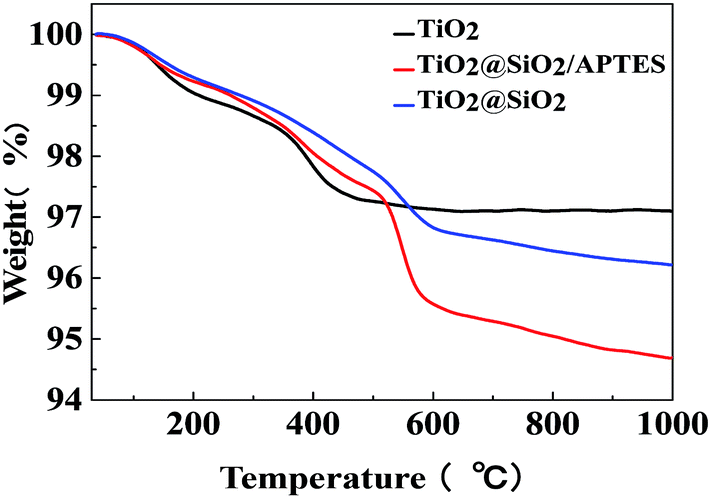
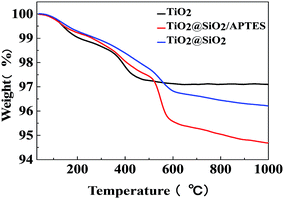
The thermogravimetric (TG) curves of the U–TiO2, TiO2@SiO2, and TiO2@SiO2/APTES are shown in Fig. 3. As can be seen from the curves, the U–TiO2 is relatively stable and only slightly decomposed. The weight loss at the initial stage between 95 °C and 200 °C is probably due to the loss of water physically adsorbed on the surface of the nanoparticles. From 340 °C to 420 °C, the weight loss of the U–TiO2 is mainly attributed to the reduction of OH on its surface.18,42 The weight loss of the TiO2@SiO2 is 2.47% between 300 °C and 670 °C, which is attributed to the reduction of OH on its surface and the decomposition of the residual organic group (–CH3CH2) of the TEOS.43,44 A significant decrease in weight, with 3.82% weight loss, can be observed from the curve of the TiO2@SiO2/APTES at 300–670 °C, which is mainly caused by thermal decomposition of the APTES. The TG analysis thus reconfirms that the TiO2 is successfully coated with SiO2 and subsequently modified by APTES.
 |
| | Fig. 3 TG curves of the U–TiO2, TiO2@SiO2-0.2, and TiO2@SiO2/APTES-0.6 nanoparticles. | |
Contact angle analysis
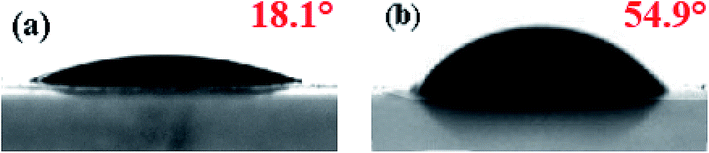
Contact angle tests are carried out to evaluate the hydrophobicity of the U–TiO2, TiO2@SiO2, and TiO2@SiO2/APTES. The contact angle of the TiO2@SiO2 approximately reaches 0°, indicating that the TiO2@SiO2 is superhydrophilic. As shown in Fig. 4, the contact angle of the TiO2@SiO2/APTES obviously increases from 18.1 to 54.9° because of some hydrophobicity of the organic APTES, which could improve the compatibility of TiO2 with organics or polymers.36
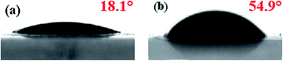 |
| | Fig. 4 The contact angle of (a) U–TiO2 and (b) TiO2@SiO2/APTES-0.6. | |
TEM analysis
TEM images of the U–TiO2, TiO2@SiO2, and TiO2@SiO2/APTES are shown in Fig. 5. It is clearly observed that the U–TiO2 nanoparticles are seriously aggregated and distinct particles can be hardly found (Fig. 5a). However, the TiO2@SiO2 (Fig. 5b) and TiO2@SiO2/APTES (Fig. 5c) nanoparticles are evenly or well distributed, without forming agglomerates. It can be seen that the homogeneous SiO2 coating was deposited on the surface of the TiO2 and formed a continuous coating layer (Fig. 5e). Similarly, APTES was also predominately deposited on the TiO2@SiO2 nanoparticles’ surface and an obvious interface can be detected (Fig. 5f). The core–shell structure existed when the TiO2 nanoparticles were modified with TEOS and APTES. After being coated by SiO2 and further modified with APTES, the aggregation of the TiO2 nanoparticles is greatly reduced.
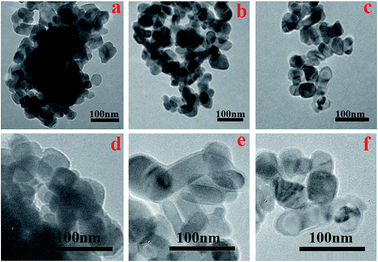 |
| | Fig. 5 TEM images of the (a and d) U–TiO2, (b and e) TiO2@SiO2-0.2, and (c and f) TiO2@SiO2/APTES-0.6. | |
Photocatalytic activities of the nanoparticles
The photocatalytic activities of the U–TiO2, TiO2@SiO2, and TiO2@SiO2/APTES are evaluated by measuring MB decomposition. With increasing SiO2 coating and APTES loading amounts, the MB degradation rate decreased remarkably (as shown in Fig. 6). The available data indicate that the photocatalytic activity of TiO2 is suppressed effectively after SiO2 coating and APTES modification because the direct contact between the MB molecule and the surface of the TiO2 nanoparticles is interfered with by the SiO2 coating and APTES deposited on the TiO2 surface.45–47 Nearly 50% of the MB is degraded after 15 min in the presence of the U–TiO2 nanoparticles under strong UV radiation (300 W), while only 17.44% and 4.18% of the MB is degraded in the presence of the TiO2@SiO2-0.6 and TiO2@SiO2/APTES-1 nanoparticles. The TiO2 nanoparticles catalyze the formation of super oxides and hydroxyl radicals under UV light conditions, and these radicals may cause the degradation of organic components. After the TiO2 is coated with SiO2 and APTES, the photocatalytic activities of the TiO2@SiO2 and TiO2@SiO2/APTES were decreased through the inhibition of free radical production from the reaction of O2 and/or H2O with the electron–hole pair. Therefore, the TiO2 surface was coated with SiO2, and the prepared TiO2@SiO2 was further modified with APTES, which can effectively inhibit the photocatalytic activity of TiO2.
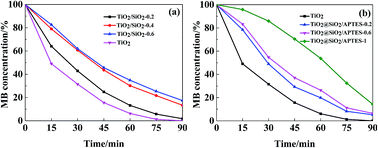 |
| | Fig. 6 Photocatalytic activities for (a) the U–TiO2 and TiO2@SiO2 (weight ratio = 0.2, 0.4, 0.6) nanoparticles, (b) the U–TiO2 and TiO2@SiO2/APTES (weight ratio = 0.2, 0.6, 1) nanoparticles. | |
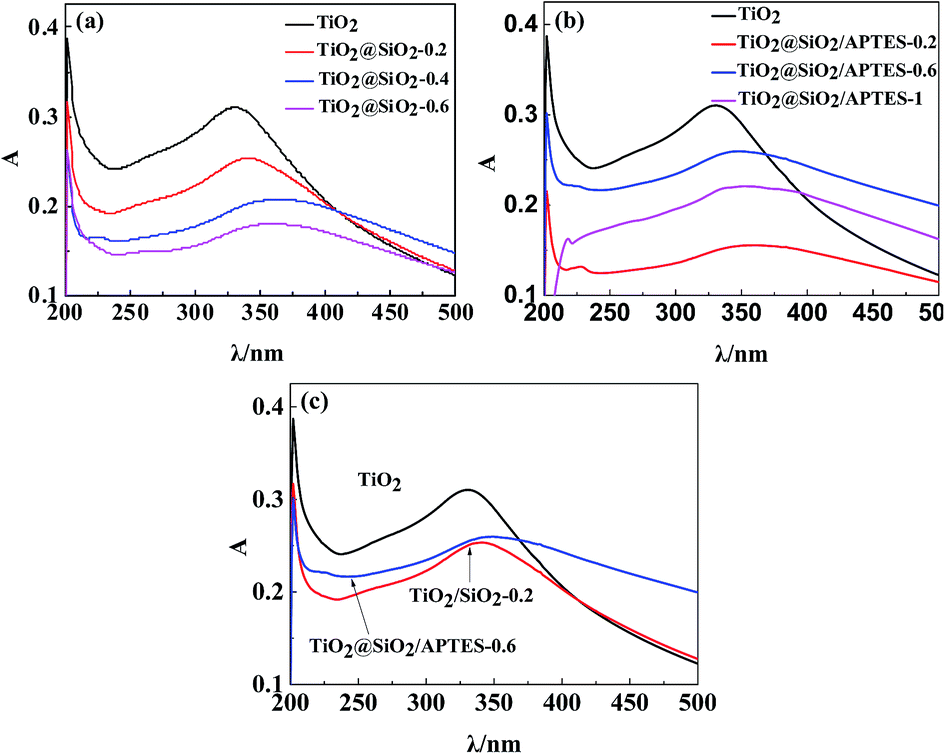
UV-shielding ability of the nanoparticles
To investigate the UV-shielding ability of the prepared nanoparticles, UV absorption of the nanoparticles is measured in a highly dilute suspension with a volume of 10 mg L−1, which is shown in Fig. 7. The UV absorption at wavelengths ranging from 280–400 nm decreases gradually with the increase of the SiO2 coating, indicating that excessive SiO2 coating can remarkably restrain the UV-shielding ability of the TiO2 nanoparticle (Fig. 7a). In comparison with the U–TiO2, the UV absorption of the TiO2@SiO2/APTES decreases, but the UV absorption of the TiO2@SiO2/APTES-0.6 reaches the maximum value (Fig. 7b). As shown in Fig. 7c, the UV absorption capacity of the TiO2@SiO2/APTES-0.6 is higher than that of the TiO2@SiO2-0.2. These results suggest that the TiO2 coated with SiO2 and further modified by appropriate amounts of APTES can more effectively maintain the UV-shielding ability than the TiO2@SiO2. Although the UV-shielding ability of the TiO2@SiO2/APTES-0.6 nanoparticles is also reduced in comparison with the U–TiO2, it can remain above 80%. Based on these results, it is found that the TiO2@SiO2/APTES-0.6 nanoparticles can more effectively quench the photocatalytic activities and retain high UV-shielding ability. So the TiO2@SiO2/APTES-0.6 is the best candidate to improve the anti-UV properties of polymers.
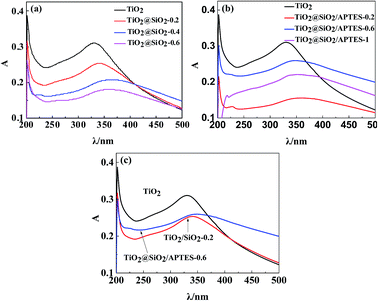 |
| | Fig. 7 UV absorbance spectra of (a) the U–TiO2 and TiO2@SiO2 (weight ratio = 0.2, 0.4, 0.6) nanoparticles, (b) the U–TiO2, and TiO2@SiO2/APTES (weight ratio = 0.2, 0.6, 1), (c) the U–TiO2, TiO2@SiO2-0.2, and TiO2@SiO2/APTES-0.6 nanoparticles. | |
FT-IR studies of the PPS composite films
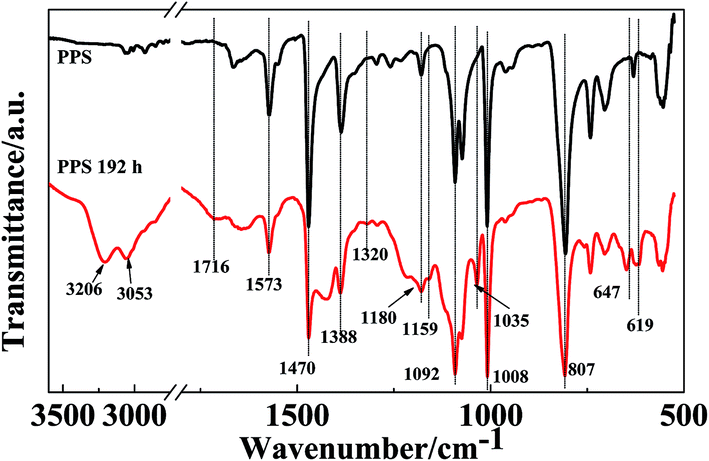
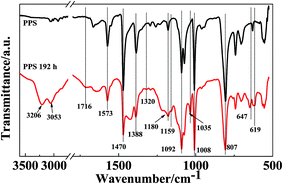
Fig. 8 presents the ATR-FTIR spectra of the PPS film before and after UV irradiation for 192 h, in order to obtain information about the photoaging degradation of PPS. The spectrum of the neat PPS film exhibits absorption peaks at 1573, 1470, 1388, 1092, 1008, and 807 cm−1. The characteristic peaks at 1573, 1470, and 1388 cm−1 are assigned to the skeleton stretching vibration of the aromatic rings. The absorption peak at 1092 cm−1 is related to stretching of the C–S bond. In addition, the peaks at 1008 and 807 cm−1 are assigned to the in-plane C–H bending and the out-of-plane deformation vibration of C–H, respectively.21 After UV irradiation for 192 h, the intensity of the above PPS characteristic absorption peaks decreased obviously, but some new absorption peaks were detected at 3206, 3053, 1716, 1320, 1159, 1035, 647, and 619 cm−1, which confirmed that photodegradation of PPS can be induced by UV rays. The new broad peaks at 3206 and 3053 cm−1 are assigned to phenolic groups,23 which indicates that the oxidation reaction takes place at the aromatic rings of PPS. Furthermore, the characteristic absorption at 1716 cm−1 is attributed to the skeletal stretching vibration of the 1,2,4-trisubstituted phenyl ring, which results from the formation of crosslinking groups after cleavage of the PPS chain. The intensity of the peak at 1180 cm−1 related to crystalline components decreased, which results from the poor regularity of the PPS chain. The PPS chain cleavage caused by UV radiation can reduce its crystallization degree, which increases the amount of amorphous components. Moreover, the absorption peak intensity of the C–S bond also decreased after UV irradiation for 192 h. The new characteristic absorption peaks at 1320, 1159, and 1035 cm−1 are attributed to the –SOO˙ stretching and –SO˙ stretching vibrations. These results confirm the fact that the C–S bond can be cleaved under UV irradiation. The absorption peaks that occurred at 647 and 619 cm−1 are attributed to small molecules’ or oligomers’ stretching vibrations. The above results indicated that the PPS films were photodegraded seriously under UV rays due to their poor anti-UV properties.
 |
| | Fig. 8 ATR-FTIR spectra of the neat PPS film before and after UV irradiation for 192 h. | |
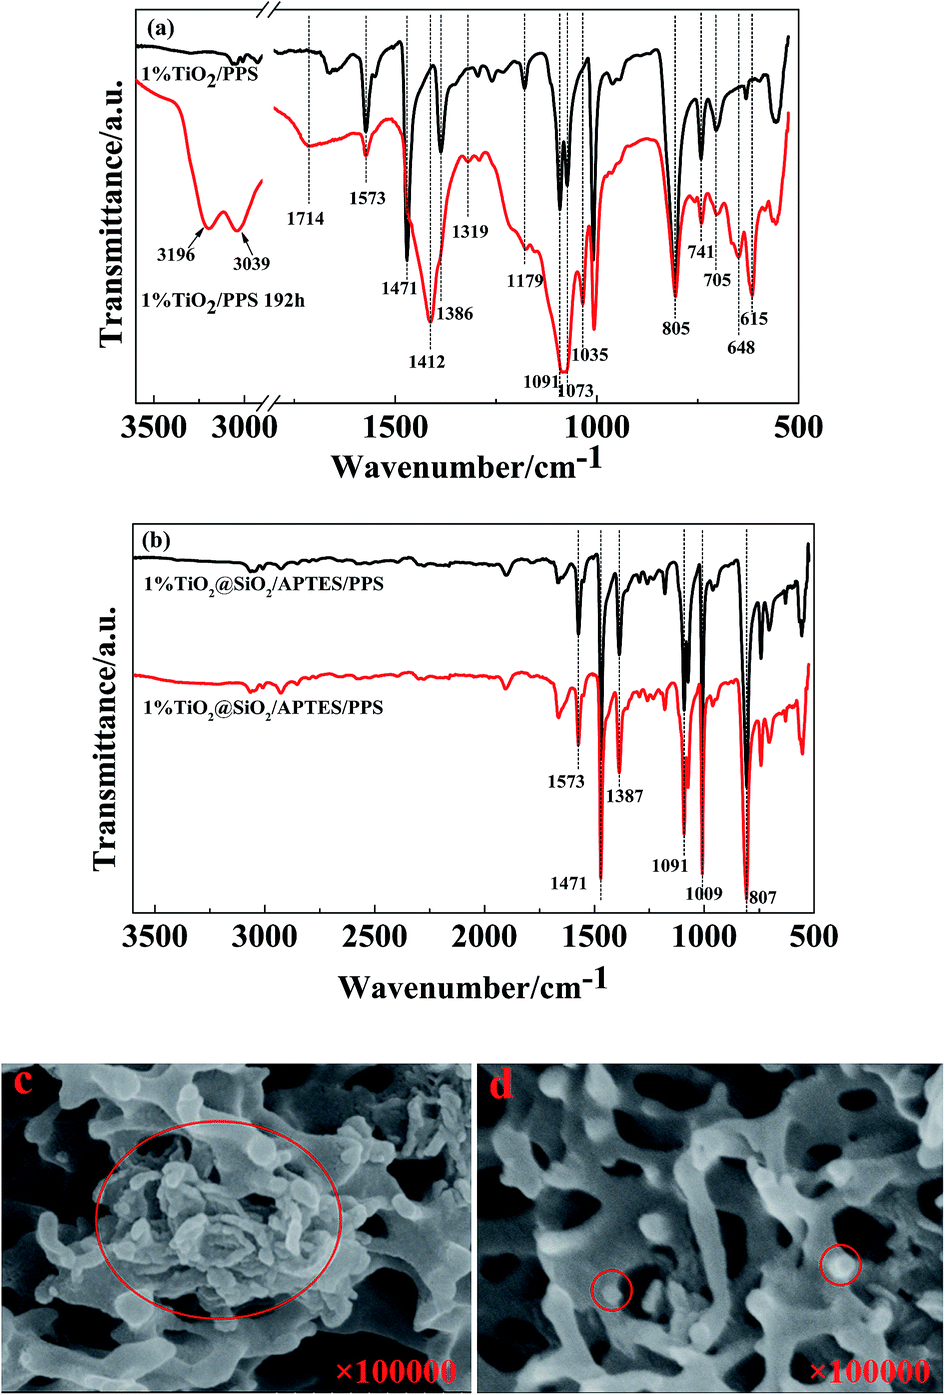
Fig. 9 presents the ATR spectra and cross-sectional SEM images of the TiO2/PPS film in comparison with the TiO2@SiO2/APTES/PPS film. As shown in Fig. 9a, the TiO2/PPS film is photodegraded seriously, which is consistent with the process of neat PPS photodegradation. However, the ATR spectrum of the TiO2@SiO2/APTES/PPS film has nearly no changes before and after UV irradiation for 192 h (Fig. 9b). U–TiO2 agglomerates are formed in the TiO2/PPS film (Fig. 9c), however, TiO2@SiO2/APTES can be well dispersed in the PPS film (Fig. 9d). These results confirm the idea that the U–TiO2 degrades the PPS macromolecule chain due to its excellent photocatalytic activity and poor dispersion properties, while the TiO2@SiO2/APTES nanoparticles can effectively protect the PPS from UV ray degradation owing to their lower photocatalytic activity, higher UV-shielding ability and easy dispersion in the PPS matrix.
 |
| | Fig. 9 ATR-FITR spectra of the (a) TiO2/PPS film with 1 wt% loading and (b) TiO2@SiO2/APTES/PPS composite film with 1 wt% loading before and after UV irradiation for 192 h. SEM images of the (c) TiO2/PPS film with 1 wt% loading and (d) TiO2@SiO2/APTES/PPS composite film with 1 wt% loading. | |
UV-screening properties of the TiO2@SiO2/APTES/PPS films
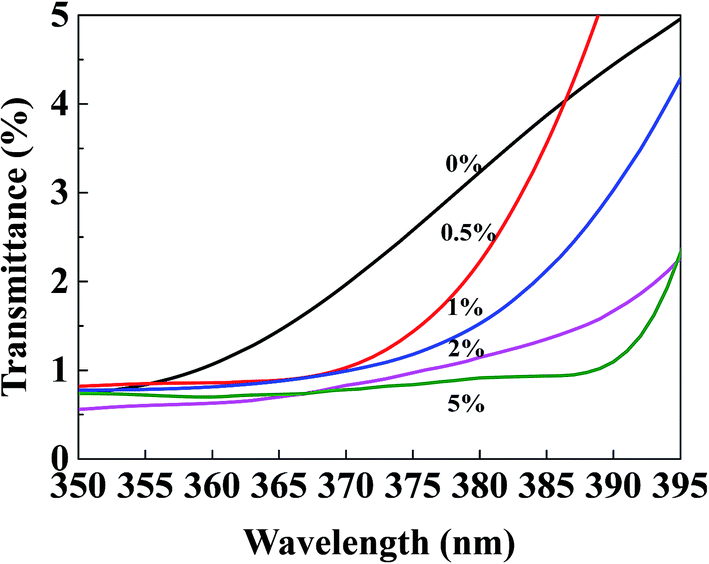
To investigate the UV-screening properties of the TiO2@SiO2/APTES/PPS films, UV transmittance is measured at a wavelength of 350–395 nm which belongs to the maximum absorption range of the TiO2@SiO2/APTES nanoparticles, as shown in Fig. 10. The UV transmittance of the PPS film is very low (<5%), which indicates that the PPS film has considerably strong UV absorption. The UV transmittance of the TiO2@SiO2/APTES films decreases with increasing nanoparticle loading amounts, which is consistent with the excellent UV-shielding ability of the TiO2@SiO2/APTES nanoparticles. Thus, taking advantage of the absorbing and scattering of UV rays, the TiO2@SiO2/APTES nanoparticles can effectively protect the PPS matrix from UV radiation.
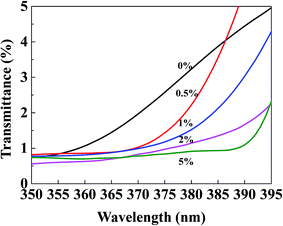 |
| | Fig. 10 UV transmittance spectra of the TiO2@SiO2/APTES/PPS films with 0 wt%, 0.5 wt%, 1 wt%, 2 wt%, and 5 wt% loading. | |
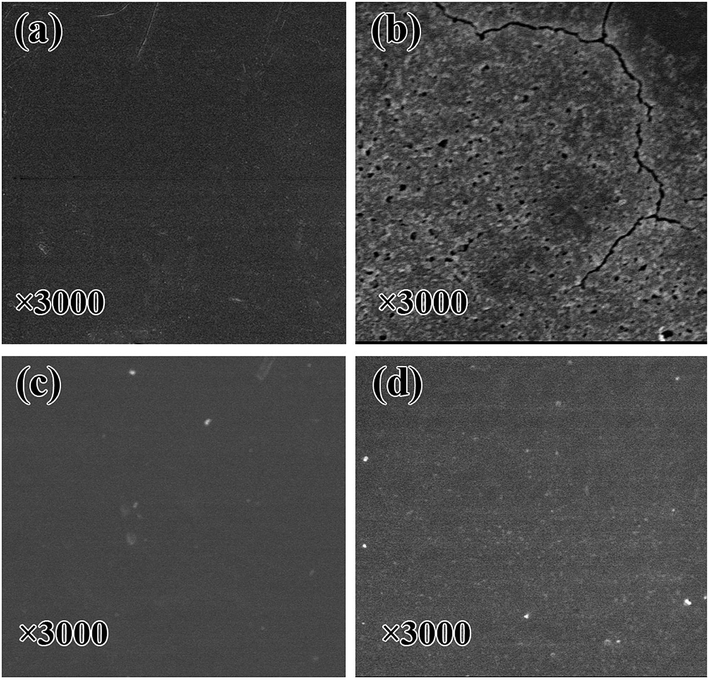
SEM analysis
In order to investigate the phenomenon of photoaging degradation, SEM images of the PPS films and TiO2@SiO2/APTES/PPS films were characterized before and after UV irradiation for 192 h. As shown in Fig. 11, it can be clearly seen that there are some obvious cracks and small holes on the surface of the PPS film, but no structure defects exist on the TiO2@SiO2/APTES/PPS film after UV irradiation for 192 h. These results demonstrate that the UV resistance of the PPS was significantly improved by the TiO2@SiO2/APTES nanoparticles, which is consistent with the ATR-FITR characterization results.
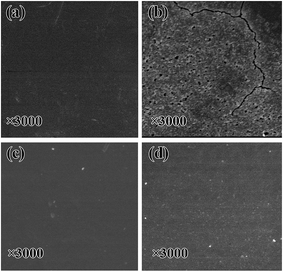 |
| | Fig. 11 SEM images before and after UV irradiation for 192 h: (a) the neat PPS film before irradiation, (b) the neat PPS film after UV irradiation, (c) the TiO2@SiO2/APTES/PPS composite film with 1 wt% loading before irradiation and (d) the TiO2@SiO2/APTES/PPS composite film with 1 wt% loading after UV irradiation. | |
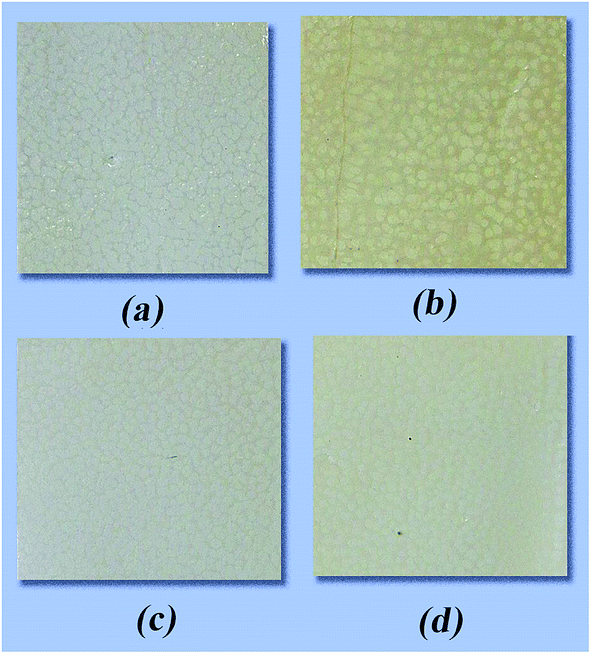
Color change analysis
From the photographs of the films (Fig. 12), it can be observed that UV radiation causes a dramatic change in the color of the neat PPS film, resulting in a deep yellow color. However, the TiO2@SiO2/APTES/PPS composite film only exhibits minimal yellowing, which suggests that the TiO2@SiO2/APTES nanoparticles are effective in protecting the PPS from discoloration due to UV radiation.
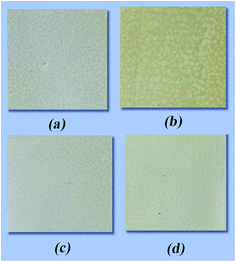 |
| | Fig. 12 The color of the films before and after UV irradiation for 192 h: (a) the neat PPS film before irradiation, (b) the neat PPS film after irradiation, (c) the TiO2@SiO2/APTES/PPS composite film with 1 wt% loading before irradiation, and (d) the TiO2@SiO2/APTES/PPS composite film with 1 wt% loading after irradiation. | |
Mechanical properties of the films
To further evaluate the effects of UV-resistance on the mechanical properties of PPS, tensile tests are carried out on films subjected to UV irradiation for 192 h at a tensile speed of 10 mm min−1. Their breaking strength retention rates and breaking elongation retention rates are shown in Fig. 13. The pure PPS film exhibits 50.35% and 45.82% breaking strength retention rate and breaking elongation retention rate, significantly lower than those of the TiO2@SiO2/APTES/PPS films. The breaking strength retention rate improvements are found for our TiO2@SiO2/APTES/PPS films, and the retention rate of the 1 wt% TiO2@SiO2/APTES/PPS film shows a maximum improvement of 38.26% but this reduces at higher filler loadings due to nanoparticle agglomeration (Fig. 13a). Regarding the breaking elongation retention rate (Fig. 13b), a maximum improvement of 41.64% can be observed at a 2 wt% TiO2@SiO2/APTES loading, and this also shows a small decrease at higher loadings due to poor nanoparticle dispersion. These results reveal that the incorporation of the TiO2@SiO2/APTES nanoparticles into the PPS matrix imparts excellent anti-UV properties to the PPS matrix, leading to the mechanical performance improvement.
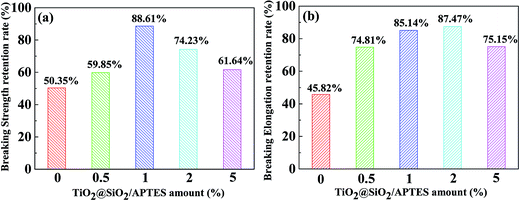 |
| | Fig. 13 (a) Breaking strength and (b) breaking elongation retention rate of the neat PPS film and the TiO2@SiO2/APTES/PPS composite films with 0 wt%, 0.5 wt%, 1 wt%, 2 wt%, and 5 wt% loading after UV irradiation for 192 h. | |
Conclusions
In summary, TiO2@SiO2 nanoparticles were prepared using a sol–gel method from TEOS and TiO2, and further treated with APTES to obtain the TiO2@SiO2/APTES nanoparticles. FT-IR, XPS, TG and contact angle analyses confirmed that the SiO2 shell could be well deposited on the surface of core TiO2, and that APTES could be further successfully attached on to the TiO2@SiO2 surface. TEM images revealed that the core–shell structure was formed on the surface of the TiO2 and the APTES modified nanoparticles could be well dispersed in a PPS matrix. The TiO2@SiO2/APTES-0.6 nanoparticles are the best candidates for improving the UV-resistance of a PPS polymer because of their higher UV-shielding ability, lower photocatalytic activity and better dispersion. The TiO2@SiO2/APTES-0.6 nanoparticles were used as fillers in a PPS matrix, and ATR-FTIR analysis, UV screening tests, SEM characterization, and color change and tensile tests were used to investigate the anti-UV properties of PPS and its composites. Compared to the pure PPS film after UV irradiation, excellent anti-UV properties of the TiO2@SiO2/APTES/PPS composite films are manifested in the superior photostability, good UV transmittance ability, minimal yellowing, and remarkably enhanced mechanical properties. On the basis of these results, it can be concluded that the TiO2@SiO2/APTES nanoparticles are an excellent filler in PPS to improve UV resistance.
Acknowledgements
The authors are grateful for the financial support of the National Natural Science Foundation of China (Grant No. 21376177 and 21676202), and this work is also supported by the Tianjin Natural Science Foundation of China (Grant No. 12JCZDJC29800 and 15JCZDJC7000) and the China National Textile and Apparel Council (J201406).
References
- K. Han and M. Yu, J. Appl. Polym. Sci., 2006, 100, 1588–1593 CrossRef CAS
 .
. - R. R. Devi and T. K. Maji, Ind. Eng. Chem. Res., 2012, 51, 3870–3880 CrossRef CAS .
- A. Araújo, G. L. Botelho, M. Silva and A. V. Machado, J. Mater. Sci. Eng. B, 2013, 3, 75 Search PubMed .
- X. Xiao, X. Liu, F. Chen, D. Fang, C. Zhang, L. Xia and W. Xu, ACS Appl. Mater. Interfaces, 2015, 7, 21326–21333 CAS .
- C. Liao, Q. Wu, T. Su, D. Zhang, Q. Wu and Q. Wang, ACS Appl. Mater. Interfaces, 2014, 6, 1356–1360 CAS .
- Y. Zhao, Z. Xu, X. Wang and T. Lin, Appl. Surf. Sci., 2013, 286, 364–370 CrossRef CAS .
- N. Abidi, L. Cabrales and E. Hequet, ACS Appl. Mater. Interfaces, 2009, 1, 2141–2146 CAS .
- Y. Zheng, M. Xiao, S. Jiang, F. Ding and J. Wang, Nanoscale, 2013, 5, 788–795 RSC .
- K. Qi and J. H. Xin, ACS Appl. Mater. Interfaces, 2010, 2, 3479–3485 CAS .
- E. Ukaji, T. Furusawa, M. Sato and N. Suzuki, Appl. Surf. Sci., 2007, 254, 563–569 CrossRef CAS .
- L. Wang, X. Zhang, B. Li, P. Sun, J. Yang, H. Xu and Y. Liu, ACS Appl. Mater. Interfaces, 2011, 3, 1277–1281 CAS .
- A. M. El-Toni, S. Yin and T. J. Sato, J. Colloid Interface Sci., 2006, 300, 123–130 CrossRef CAS PubMed .
- T. Furusawa, K. Honda, E. Ukaji, M. Sato and N. Suzuki, Mater. Res. Bull., 2008, 43, 946–957 CrossRef CAS .
- I. A. Siddiquey, T. Furusawa, M. Sato, K. Honda and N. Suzuki, Dyes Pigm., 2008, 76, 754–759 CrossRef CAS .
- Y.-Y. Song, H. Hildebrand and P. Schmuki, Surf. Sci., 2010, 604, 346–353 CrossRef CAS .
- K.-D. Kim, H. O. Seo, C. W. Sim, M.-G. Jeong, Y. D. Kim and D. C. Lim, Prog. Org. Coat., 2013, 76, 596–600 CrossRef CAS .
- J. F. Di and J. G. Zou, Adv. Mater. Res., 2013, 821–822, 1291–1294 CrossRef .
- J. Zhao, M. Milanova, M. M. Warmoeskerken and V. Dutschk, Colloids Surf., A, 2012, 413, 273–279 CrossRef CAS .
- Q. Chen and N. L. Yakovlev, Appl. Surf. Sci., 2010, 257, 1395–1400 CrossRef CAS .
- T. Furusawa, Y. Kadota, A. Matsuzuka, F. Kurayama, N. M. Bahadur, M. Sato and N. Suzuki, J. Chem. Eng. Jpn., 2014, 47, 900–907 CrossRef CAS .
- A. M. Díez-Pascual and A. L. Díez-Vicente, ACS Appl. Mater. Interfaces, 2014, 6, 10132–10145 Search PubMed .
- Z. Hu, L. Li, B. Sun, S. Meng, L. Chen and M. Zhu, Prog. Nat. Sci.: Mater. Int., 2015, 25, 310–315 CrossRef CAS .
- P. Das, P. DesLauriers, D. R. Fahey, F. Wood and F. Cornforth, Polym. Degrad. Stab., 1995, 48, 11–23 CrossRef CAS .
- F. Cheng, S. M. Sajedin, S. M. Kelly, A. F. Lee and A. Kornherr, Carbohydr. Polym., 2014, 114, 246–252 CrossRef CAS PubMed .
- W. Ni, S. Wu and Q. Ren, Ind. Eng. Chem. Res., 2012, 51, 13157–13163 CrossRef CAS .
- S. Xiao, M. Textor, N. D Spencer, M. Wieland, B. Keller and H. Sigrist, J. Mater. Sci.: Mater. Med., 1997, 8, 867–872 CrossRef CAS PubMed .
- J. Kunze, A. Ghicov, H. Hildebrand, J. M. Macak, L. Traveira and P. Z. Schmuki, Phys. Chem., 2005, 219, 1561–1582 CAS .
- C. Ni, Z. Zhang, M. Wells, T. P. Beebe, L. Pirolli, L. P. M. De Leo and A. V. Teplyakov, Thin Solid Films, 2007, 515, 3030–3039 CrossRef CAS .
- A. Vesel, M. Mozetic, J. Kovac and A. Zalar, Appl. Surf. Sci., 2006, 253, 2941–2946 CrossRef CAS .
- G. Lu, S. L. Bernasek and J. Schwartz, Surf. Sci., 2000, 458, 80–90 CrossRef CAS .
- A. Azoulay, N. Shamir, E. Fromm and M. Mintz, Surf. Sci., 1997, 370, 1–16 CrossRef CAS .
- G. Beamson and D. Briggs, High resolution XPS of organic polymers, the scienta ESCA300 database, Wiley, Chichester, 1992, p. 295, hardcover, ISBN 0-471-93592-1 Search PubMed .
- L. Yeqiu, H. Jinlian, Z. Yong and Y. Zhuohong, Carbohydr. Polym., 2005, 61, 276–280 CrossRef .
- H. J. Martin, K. H. Schulz, J. D. Bumgardner and K. B. Walters, Appl. Surf. Sci., 2008, 254, 4599–4605 CrossRef CAS .
- R. Hong, T. Pan, J. Qian and H. Li, Chem. Eng. J., 2006, 119, 71–81 CrossRef CAS .
- X. Li, R. Song, Y. Jiang, C. Wang and D. Jiang, Appl. Surf. Sci., 2013, 276, 761–768 CrossRef CAS .
- R. G. Acres, A. V. Ellis, J. Alvino, C. E. Lenahan, D. A. Khodakov, G. F. Metha and G. G. Andersson, J. Phys. Chem. C, 2012, 116, 6289–6297 CAS .
- A. Arranz, C. Palacio, D. Garcia-Fresnadillo, G. Orellana, A. Navarro and E. Munoz, Langmuir, 2008, 24, 8667–8671 CrossRef CAS PubMed .
- K. M. Kallury, P. M. Macdonald and M. Thompson, Langmuir, 1994, 10, 492–499 CrossRef CAS .
- Y. Liu, Y. Li, X.-M. Li and T. He, Langmuir, 2013, 29, 15275–15282 CrossRef CAS PubMed .
- E. Asenath Smith and W. Chen, Langmuir, 2008, 24, 12405–12409 CrossRef CAS PubMed .
- J. Lin, J. A. Siddiqui and R. M. Ottenbrite, Polym. Adv. Technol., 2001, 12, 285–292 CrossRef CAS .
- Z. Cao, Z. Zhang, F. Wang and G. Wang, Colloids Surf., A, 2009, 340, 161–167 CrossRef CAS .
- B. De Witte, D. Commers and J. Uytterhoeven, J. Non-Cryst. Solids, 1996, 202, 35–41 CrossRef CAS .
- I. A. Siddiquey, E. Ukaji, T. Furusawa, M. Sato and N. Suzuki, Mater. Chem. Phys., 2007, 105, 162–168 CrossRef CAS .
- I. A. Siddiquey, T. Furusawa, M. Sato and N. Suzuki, Mater. Res. Bull., 2008, 43, 3416–3424 CrossRef CAS .
- J. Wang, T. Tsuzuki, B. Tang, P. Cizek, L. Sun and X. Wang, Colloid Polym. Sci., 2010, 288, 1705–1711 CAS .
|
| This journal is © The Royal Society of Chemistry 2017 |
Click here to see how this site uses Cookies. View our privacy policy here. 
 Open Access Article
 This Open Access Article is licensed under a
  *,
Bowen Cheng
*,
Bowen Cheng