 Open Access Article
Creative Commons Attribution 3.0 Unported Licence
Structural and magnetic properties and DFT analysis of ZnO:(Al,Er) nanoparticles
M. Bououdinaa,
S. Azzazab,
R. Ghomri c,
M. Nasiruzzaman Shaikhd,
J. H. Daie,
Y. Song
 *e,
W. Songf,
W. Caif and
M. Ghersc
aDepartment of Physics, College of Science, University of Bahrain, PO Box 32038, Kingdom of Bahrain
bDepartment of Physics, Faculty of Science, University 20 Août 1955 of Skikda, N. P. 26, Route d’El-Hadaiek, Skikda 2100, Algeria
cLaboratory of Surfaces and Interfaces (LESIMS), Department of Physics, Faculty of Science, University Badji Mokhtar, Annaba, Algeria
dCenter of Research Excellence in Nanotechnology (CENT), King Fahd University of Petroleum and Minerals, Dhahran, Saudi Arabia
eSchool of Materials Science and Engineering, Harbin Institute of Technology at Weihai, 2 West Wenhua Road, Weihai 264209, China. E-mail: sy@hitwh.edu.cn
fKey Laboratory of Materials Physics, Anhui Key Laboratory of Nanomaterials and Technology, Center for Environmental and Energy Nanomaterials, Institute of Solid State Physics, Chinese Academy of Sciences, Hefei 230031, P. R. China
First published on 28th June 2017
Abstract
The structural, optical and electrical properties of un-doped and (Al,Er) co-doped zinc oxide (ZnO) powders synthesized by hydrothermal method were investigated. The obtained samples were characterized by X-ray diffraction (XRD), transmission electron microscopy (TEM), energy-dispersive spectroscopy and magnetic measurements. XRD results reveal that the incorporation of Al and Er in ZnO matrix leads to the formation of a nanostructured hexagonal (würtzite) ZnO structure and α-Al2O3 secondary phase. High-resolution transmission electron microscopy image also shows the hexagonal shape of the ZnO nanoparticles. The magnetic behavior of the nanoparticles changes with concentration of dopant elements due to the competition between oxygen vacancies, secondary phase effect and exchange interaction between dopant elements.
1. Introduction
Development in materials technology over the last few years realizes the usage of wide-band gap semiconductors for various optoelectronic device applications. The semiconductor ZnO is an attractive material in the research community. It has a wide range of properties that depend on doping, including a range of conductivity from metallic to insulating (including n-type and p-type conductivity), high transparency, piezoelectricity, wide-band gap semiconductivity, room-temperature ferromagnetism, and huge magneto-optic and chemical-sensing effects.1ZnO can be doped with a wide variety of ions to meet the demands of several application domains.2–4 The elements used for doped ZnO are part low valent metals (Al, In, Ga) belonging to group III of the periodic table and rare earth elements (lanthanides) (Er, Nd, Sm, Eu, Tm). Al has been the most used dopant element due to its small ionic radius and low material cost. Al doped ZnO nanopowders possess room temperature ferromagnetism.5 In addition to that, the substitution of Zn2+ ions with Al3+ in ZnO lattice improves the electrical conductivity through the increase of charge carriers where it is reported that the electron concentration increases from 1016 to 1021/cm−3.6 Dghoughi et al.7 reported that 5 mol% Al doped ZnO film exhibited the preferential (002) orientation, and it also had a high transmittance, and minimum resistivity. Effects of the doping concentrations and annealing temperatures on the properties of the high oriented Al-doped ZnO films were deeply investigated.8
ZnO nanoparticles (NPs) doped with rare-earth ions are expected to be novel optical materials because of their sharp and intense optical emission spectra.9 Er-doped ZnO has attracted attention for use in optical communication applications because of its 1.54 μm emission.10 Lamrani et al. studied the effects of the dopant erbium on the structural, morphological, luminescent and nonlinear optical properties.11 They found that addition of erbium could effectively control the film surface morphology and its cathodoluminescent properties, and that the best crystallization and morphology were obtained at lower Er doping concentration. Chen et al.12 reported that, when the dopant Er was added, the crystalline quality of the doped ZnO films decreased due to the oxygen deficiency. Zhang et al.13 reported that the photoluminescence of Er-doped ZnO had an improvement in the visible emissions, compared with that of the pure ZnO, which was attributed to the defects or vacancies in the doped film.
The co-doping ZnO with erbium and aluminum ZnO:(Al,Er) could significantly improve its responses to visible light.14 Various fabrication methods such as ball milling, hydrothermal, co-precipitation, spray pyrolysis, solution combustion, microwave method, sol–gel, vapor deposition etc. were employed to fabricate various ZnO nanostructures.15 In this paper ZnO and (Al,Er) co-doped ZnO powders were fabricated by hydrothermal method. This technique is a promising alternative synthetic method because of the low process temperature, its suitability to any type of doping and very easy to control the particle size. The hydrothermal process has several advantages over other growth processes such as use of simple equipment, catalyst-free growth, low cost, ease of large scale production, eco-friendly and less hazardous.16 This method has also been successfully employed to prepare nano scale ZnO and other luminescent materials. The influence of Al and Er dopants on the properties of ZnO were analyzed by performing various spectroscopic investigations using XRD, TEM, EDX and magnetic characterizations.
2. Experimental details
2.1. Synthesis
The pure and co-doped ZnO NPs with Er and Al were prepared by hydrothermal synthesis method to study their structural and magnetic properties. The chemicals used in the experiment are zinc nitrate Zn(NO3)2, erbium nitrate Er(NO3)3 and aluminum nitrate Al(NO3)3 (Table 1).| Composition | Amount of Zn(NO3)2 (297.49 g mol−1) (purity: 99.97%) | NaOH (40 g mol−1) | Amount of Er(OAc)3·4H2O (416.45 g mol−1) (purity: 99.9%) | Amount of Al(NO3)3·9H2O (375.13 g mol−1) (purity: 99.98%) |
|---|---|---|---|---|
| Pure ZnO | 4 mmol in 20 ml (1.18 g) | 8 mmol (320 mg) in 8 ml water | — | — |
| Zn0.96Al0.03Er0.01O | 4 mmol (1.18 g) | 8 mmol (320 mg) | 0.04 mmol (0.016 g) | 0.12 mmol (0.045 g) |
| Zn0.95Al0.03Er0.02O | 4 mmol (1.18 g) | 8 mmol (320 mg) | 0.08 mmol (0.033 g) | 0.12 mmol (0.045 g) |
| Zn0.94Al0.03Er0.03O | 4 mmol (1.18 g) | 8 mmol (320 mg) | 0.12 mmol (0.050 g) | 0.12 mmol (0.045 g) |
For un-doped ZnO NPs, 4 moles of zinc nitrate Zn(NO3)2 were dissolved in 20 ml of ethylene glycol resulting in mixture of brown dispersion. After that, 8 moles of NaOH dissolved, separately, in 8 ml of water were added drop by drop to the above solution (500 μl in one min). For co-doped ZnO NPs, a predetermined quantities of Er(NO3)3 and Al(NO3)3 were added to the above mixture. The mixture was maintained under agitation during 2 hours and then transferred in a container containing 45 ml of acid solvent. The hydrothermal treatment was carried out at 165 °C during 24 hours. The remaining solution was washed with distilled water and ethanol to separate impurities attached with nanoparticles. The as formed solution was kept in an oven at around 100 °C till the precipitate dried and finally grinded to obtain powder.
2.2. Characterization
The structural characterization of the samples were studied using X-ray diffraction (XRD, X'Pert Pro Super, Philips Co., the Netherlands) at room temperature, with monochromatic Cu-Kα (λCu = 1.54156 Å), in a (θ–2θ) Bragg–Brentano geometry. The scan range was carried out between 20° and 90° with a step increment of 0.02°. High resolution transmission electron microscopy analysis was done by using JEM-2010 transmission electron microscope operating at 200 kV equipped with energy dispersive X-ray (EDX). Magnetic properties were measured by a Quantum Design superconducting quantum interference device (SQUID) magnetometer. We used a kind of plastic sample holder and cotton to fix the powder then we measure the sample holder and cotton alone as background, which will be removed after measuring our samples.3. Results and discussion
3.1. Structure and microstructure analyses
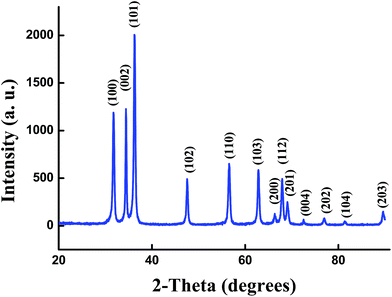
The XRD pattern of the un-doped ZnO NPs is shown in Fig. 1. The diffraction peaks can be indexed with the hexagonal würtzite type structure (space group P63mc), which are in agreement with JCPDS card No. 75-0576. For the (Al,Er) co-doped ZnO samples, the characteristic peaks related to Er and Al impurities do not appear in XRD patterns in comparison with the standard XRD patterns of bulk ZnO. However, additional weak peaks of Al2O3 appeared at about 43.35°, 50.91° and 61.38° (Fig. 2a–c), which shows that the phase segregation occurred in this system. The intensity of these peaks goes on increasing as Er content in the sample increased. Thus, it is understood that Al3+ and Er3+ ions were partially substituted into Zn2+ ions sites within the ZnO crystal due to their low solubility limit in the parent ZnO. In addition to that, all samples shows a preferred orientation along the (101) direction of the ZnO phase.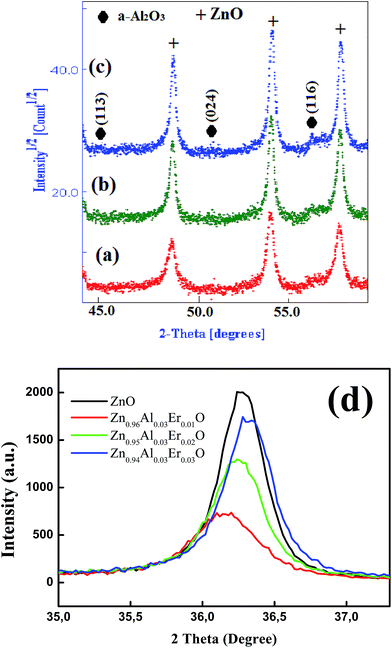 | ||
| Fig. 2 Zoom of Al2O3 diffraction peaks in (a) Zn0.96Al0.03Er0.01O, (b) Zn0.95Al0.03Er0.02O, (c) Zn0.94Al0.03Er0.03O and (d) main (101) ZnO diffraction peak evolution with dopant content. | ||
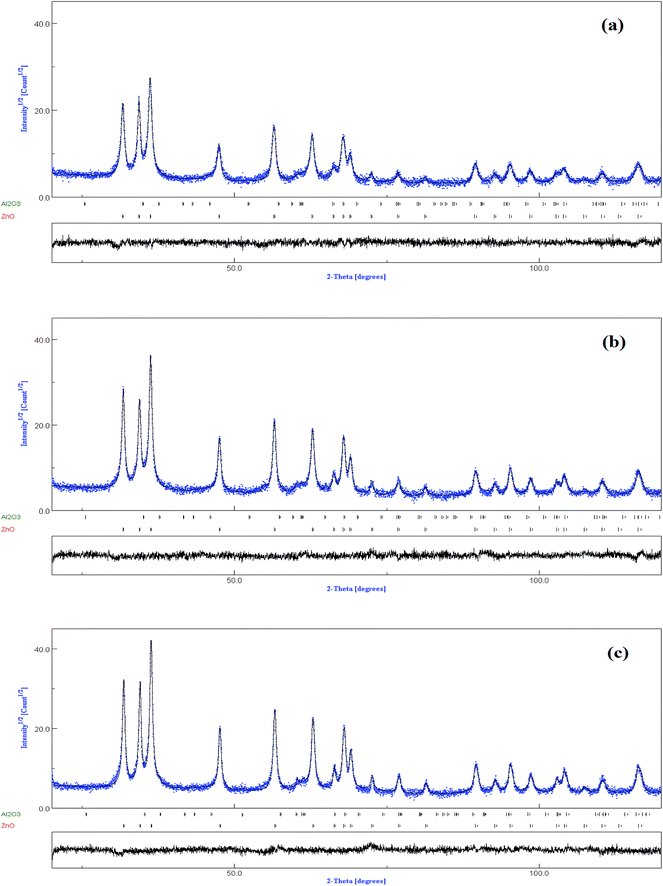
The increase of Er content from 1 to 3% causes notable increase in all ZnO peak intensities (Fig. 2d). However, the FWHM decreases with increasing Er concentration. More intense diffraction peaks of co-doped samples point out that Er doping enhances crystallinity compared to ZnO:(3% Al,1% Er) sample. Interestingly, the XRD pattern clearly shows that there is a shift in the peak position with increasing (Al,Er) content, suggesting a change in the lattice parameters. To characterize in detail the crystalline structure, including both the structural (cell parameters, site occupancy, atomic positions, thermal parameters, etc.) and microstructural parameters (crystallite size, microstrain, preferred orientation, etc.), we have used Rietveld refinement method. In this method, the peak shape profile is fitted by Voight or Pseudo-Voight functions.17 The Marquardt least-squares procedure was adopted for minimizing the difference between the observed and simulated powder diffraction patterns and the minimization was carried out by using the reliability parameters Rwp (weighted residual factor), RB (Bragg factor) and Rexp (expected residual factor).17,18 The goodness of fit (GoF) is obtained by comparing Rwp with Rexp (GoF = Rwp/Rexp). Refinement continues till convergence is reached with the value of the quality factor, GoF approaching 1, which confirms the goodness of refinement. The typical refinement plots of un-doped and (Al,Er) co-doped ZnO NPs are shown in Fig. 3 where the calculated patterns are shown in the same field as a solid line curve. The difference between the observed and calculated intensities is shown in the middle field. The best Rietveld refinement is obtained by the introduction of two phases: hexagonal würtzite ZnO with the space group P63mc and trigonal Al2O3 with the space group R![[3 with combining macron]](https://www.rsc.org/images/entities/char_0033_0304.gif) c:H. The obtained structural and microstructural parameters are listed in Table 2.
c:H. The obtained structural and microstructural parameters are listed in Table 2.
| Phases | Lattice parameters (Å) (±0.001) | d (nm) (±2) | 〈σ2〉1/2 (%) (±0.02) | Amount (%) (±0.1) | Refinement parameters | Dislocation density (×1015/m2) | R | |||
|---|---|---|---|---|---|---|---|---|---|---|
| a | c | RB (%) | GoF | |||||||
| a 〈σ2〉1/2: root mean square microstrain (r.m.s.); d: crystallite size. | ||||||||||
| Pure ZnO | ZnO | 3.2495 | 5.2085 | 35.431 | 0.115 | 100 | 6.879 | 1.100 | 0.796 | 1.1274 |
| Zn0.96Al0.03Er0.01O | ZnO | 3.2561 | 5.2109 | 24.832 | 0.117 | 95.214 | 10.053 | 0.993 | 1.622 | 1.0203 |
| Al2O3 | 4.7429 | 12.9458 | 21.221 | 0.205 | 4.786 | 2.220 | — | |||
| Zn0.95Al0.03Er0.02O | ZnO | 3.2502 | 5.2104 | 27.274 | 0.114 | 93.772 | 9.795 | 0.986 | 1.344 | 1.0185 |
| Al2O3 | 4.7435 | 12.9481 | 20.844 | 0.196 | 6.228 | 2.302 | — | |||
| Zn0.94Al0.03Er0.03O | ZnO | 3.2498 | 5.2089 | 28.970 | 0.109 | 91.285 | 7.855 | 1.012 | 1.191 | 1.0188 |
| Al2O3 | 4.7438 | 12.9502 | 22.783 | 0.127 | 8.715 | 1.926 | — | |||
As it can be seen from Table 2, the crystallite size decreases from 35.43 nm for un-doped ZnO to 24.83 nm for Zn0.96Al0.03Er0.01O, and then with increasing the Er doping concentration, it slightly increases reaching 28.97 nm for 3% Er. The co-doped ZnO NPs exhibit smaller crystallite size than the un-doped ZnO NPs, which may change the lattice parameters due to differences between ionic radii of Er3+, Al3+ and Zn2+.19 This mismatch may generate lattice strain (microstrain). This decrease of the crystallite size is further an evidence that the co-doping with (Al,Er) inhibits grain growth of ZnO, as it has been reported by other authors for ZnO:(Al,Er)20,21 and ZnO:Al22 systems. Senol et al.23 have reported that the addition of 5% of Er to ZnO NPs lead to increasing the crystallite size from 29.35 to 63.82 nm. These authors suggested that the increase of Er concentrations in ZnO matrix will increase the nucleation of the particles, which enhances the grain growth of ZnO:Er NPs.23
The entering of Er3+ and/or Al3+ ions into the ZnO structure may cause the formation of more nucleation center. By increasing Er3+ ion concentration, the intensity of the diffraction peaks increased and full width at half-maximum (FWHM) decreased. In fact, FWHM of the main pic (101) decreases from 0.58° to 0.40° for 1% and 3% Er, respectively. Similar results were obtained in other system such as Gd doped ZnO.24 It is interesting that by increasing (Er,Al) doping concentration we saw that the crystallite size is increased. The obtained values are lower than those observed for un-doped sample. This may be attributed to the increase of the defects in the crystal structure, such as oxygen vacancies. Dislocation density (δ) that is a measure of the amount of defects in the crystal structure is defined as the length of the dislocation lines per unit volume and it can be found by:25
| δ = 1/d2 | (1) |
It is well known that the lattice parameters of a semiconductor usually depend on the following factors: (i) free electron concentration acting via deformation potential of a conduction band minimum occupied by these electrons, (ii) concentration of foreign atoms and defects and their difference of ionic radii with respect to the substituted matrix ion, (iii) external strains (e.g., those induced by substrate), and (iv) temperature. From Rietveld refinement, the obtained lattice constants of pure ZnO are a = 3.2495 Å and c = 5.2085 Å. These values deviate slightly from that of the ideal würtzite crystal (a = 3.2417 Å and c = 5.1876 Å). This is probably due to lattice stability and ionicity. It has been reported that free charge is the dominant factor responsible for expanding the lattice proportional to the deformation potential of the conduction band minimum and inversely proportional to the carrier density and bulk modulus.26 The point defects such as zinc antisites, oxygen vacancies, and extended defects, such as threading dislocations, also increase the lattice constant, albeit to a lesser extent in the hetero-epitaxial layers. For Zn0.95Al0.03Er0.01O sample, the lattice parameters a and c of the würtzite phase increases to a = 3.2561 Å and c = 5.2109 Å. This increase may be attributed to the difference in the ionic radii of Al3+ (0.54 Å) and Er3+ (0.89 Å) as compared to Zn2+ (0.74 Å) one. This result is justified by the shift of (101) main peak toward lower angle (Fig. 2d).
Increasing Er content (2%, 3%) is observed to reduce the lattice parameters as indicated in Table 2. However, the obtained values are higher than the pure ZnO sample. This result may be explained by the diffusion of Er ions in Al2O3 phase. In fact the lattice parameters of this later, increase with increasing Er content from 2 to 3% as indicated in Table 2.
The change in ZnO crystal parameters indicates the distortion or compression of the crystal lattice when Al3+ and Er3+ ions enter into the ZnO lattice. The crystal lattice distortion degree is calculated by following relation:27
 | (2) |
3.2. Morphological observations
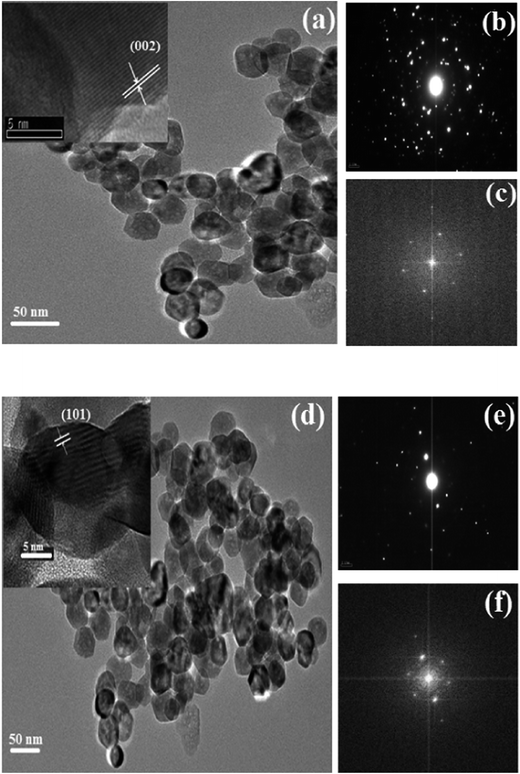
The crystallinity, morphology, and size of un-doped and co-doped ZnO nanoparticles were studied using transmission electron microscopy (TEM), as shown in Fig. 4a and d. The ZnO nanoparticles are not monodisperse and the nanoparticles agglomerate each other, which is very common for ZnO nanoparticles using hydrothermal method28 in consistence with XRD analysis.From HRTEM images (inset in Fig. 4a and d), the calculated interplanar d-spacing matches closely with the (002) (0.260 nm) and (101) (0.281 nm) plane d-spacing of hexagonal ZnO.29 In Fig. 4b and e, the selected area electron diffraction (SAED) patterns are presented for the un-doped ZnO and Zn0.95Al0.03Er0.02O samples, respectively, and the crystalline nature and preferential orientation of the patterns are found to match well with the würtzite structure of the XRD results. The Fast Fourier Transformation (FFT) images shown in Fig. 4c and f shows that it is a typical hexagonal structure consistent with würtzite ZnO.
The TEM images are used to prepare the histogram distribution of the particle size for the un-doped and co-doped samples. As observed Fig. 5, the histogram distribution is well modeled by a lognormal distribution. The mean particle size that exhibit hexagonal shape, estimated from the TEM micrograph using standard software (IMAGE J), are found to be 28 and 36 nm for pure ZnO and Zn0.95Al0.03Er0.02O, respectively, which is in good agreement with the mean crystalline size value determined from the XRD data analysis. The particles with such small size have very large specific surface area so that strong local aggregation can be found in the images. Few bigger particles are also seen in the micrograph, which may be due to the aggregation or overlapping of smaller particles.
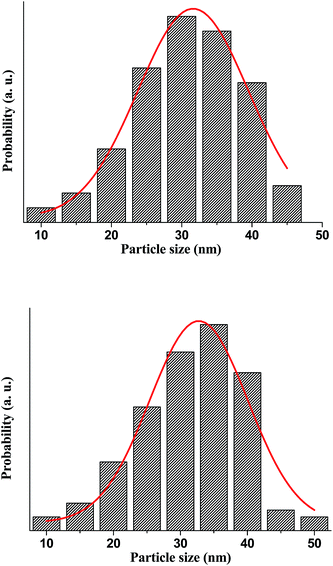 | ||
| Fig. 5 The histogram distribution of the particles size, where the solid line represents the lognormal function. | ||
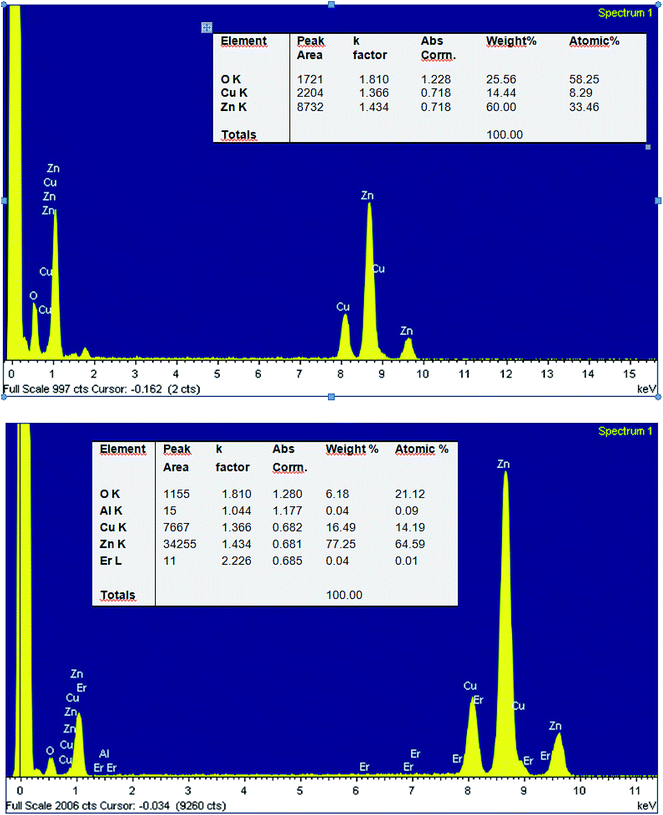
Fig. 6 depicts the energy-dispersive spectra (EDX) of pure ZnO and 2% Er-doped ZnO. The spectra reveal the existence of Zn, O, Al, Er and Cu elements in co-doped ZnO nanoparticles. Among them, Cu (8.17 keV) signal come from supporting Cu grid. The EDX results (insert table) show that the chemical composition vary slightly, almost close to the nominal composition. We note that for small concentrations, EDX is not very precise and the detection limit is dependent on the matrix and its surface. Furthermore, the greatest source of error – or at least uncertainty – in qualitative analysis can be found for constituents present at minor (1 < C < 10 wt%) and trace (C < 1 wt%) levels30 which is the case of Er and Al elements.
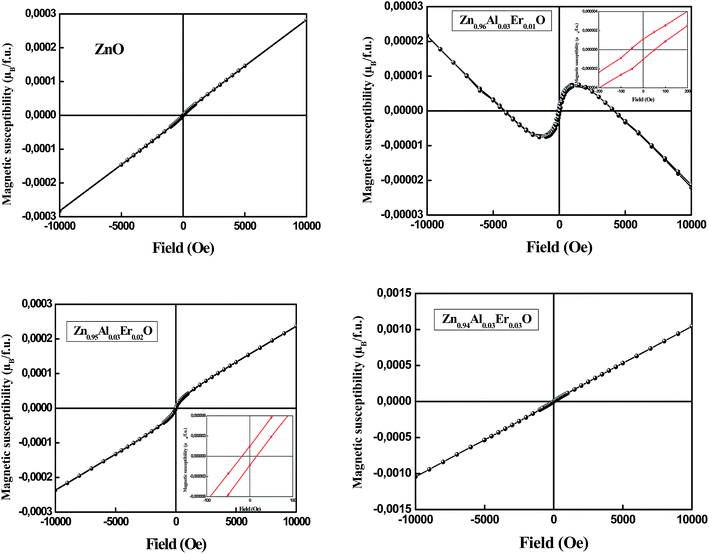
3.3. Magnetic properties
Fig. 7 shows the magnetization curve measured at room temperature for un-doped and doped ZnO NPs. When ZnO is un-doped, there is no hysteresis loop and the sample is paramagnetic at room temperature. Since bulk ZnO is diamagnetic, the origin of this behavior at nanoscale may be usually linked to defects.31 Extensive researches have indicated that defects like Zn and O vacancies (VZn, VO), oxygen interstitial (Oi) and cation interstitial (i.e. Zni) in wide gap oxide semiconductors are possibly the origin of the magnetism.30 We note that the oxygen deficiency exhibits a local magnetic moment.31,32 Therefore, it was reported that ferromagnetism can appear in un-doped ZnO thin films when Zn vacancies are introduced.33 The magnetization of very thin ZnO films was found to be much larger than that of the thicker films, suggesting that the vacancies must be located mostly at the surface. The origin of this magnetism has been shown theoretically34 to be due to the unpaired 2p electrons at oxygen sites around the Zn vacancy. In addition, Zn vacancies prefer to occupy the surface sites, and the formation energy of Zn vacancy is higher than that of the oxygen vacancies.For Zn0.96Al0.03Er0.01O sample, the data show the existence of two components, one is diamagnetic and the other is ferromagnetic. After removing the diamagnetic contribution, the magnetization curve exhibits ferromagnetic behavior with a coercive field of 53.51 Oe (Table 3). A linear trend is determined in the high magnetic field region for Zn0.95Al0.03Er0.02O sample which has been assigned to the paramagnetic behavior. However, in the low-field region, a ferromagnetic contribution is determined. After subtracting the paramagnetic contribution, a coercive field (HC) of 17.32 Oe has been determined. The ferromagnetic contribution becomes negligible as the Er content is increased to 3% as can be observed in Fig. 7 where the behavior is purely paramagnetic. A similar behavior has been determined for Er-doped SnO2 nanoparticles.35
| Sample molecular formula | Molecular weight | Mass (mg) | Mass susceptibility (cgs) | Mole susceptibility χm | Effective moment Peff (μB per f.u.) | Moment of Er (μB per f.u.) attributing paramagnetism only to Er | Saturation magnetic susceptibility (μB per f.u.) |
|---|---|---|---|---|---|---|---|
| ZnO | 81.3894 | 34.29 | +1.89 × 10⁻⁶ | 1.53826 × 10⁻⁴ | 0.60579 | N/A | |
| Zn0.96Al0.03Er0.01O | 81.2558 | 24.83 | −0.264 × 10⁻⁶ | −2.14515 × 0−5 | — | N/A | 1.72 × 10⁻⁵ |
| Zn0.95Al0.03Er0.02O | 82.2745 | 22.35 | +1.33 × 10⁻⁶ | 1.09425 × 10⁻⁴ | 0.51094 | 3.612 | 6.67 × 10⁻⁴ |
| Zn0.94Al0.03Er0.03O | 83.2932 | 38.18 | +7.07 × 10⁻⁶ | 5.88883 × 10⁻⁴ | 1.18529 | 6.843 | 3.32 × 10⁻⁴ |
There are still debates on the origin of the ferromagnetism in non magnetic elements-doped oxide semiconductors. Similar to that of transition metal doped oxide semiconductors, both element doping, defects and secondary phase are believed to contribute to the ferromagnetism dependent on the materials and fabrication parameters.28 Therefore, in Eu-doped ZnO thin films, the ferromagnetism was believed to originate from both the native and the substitutional defects through bounded magnetic polaron (BMP) model.36 The overlapping of BMP can lead to the ferromagnetism, which is formed by the coupling between the localised carriers from the defects and magnetic dopants within the same region. BMP theory is proposed to explain the ferromagnetism in Er-doped ZnO thin films as well.37,38 The BMP in Er–ZnO is formed by the magnetic exchange interaction between Zn or O vacancies and Er3+ ions, which leads to the alignment of Er3+ spins. Moreover, the synthesis method or technique seems to play a major role in the magnetism of these ODMS systems. ZnO:Er films synthesized by magnetron sputtering technique are reported to exhibit a coexistence of ferromagnetic and paramagnetic phases at room temperature.37 According to the authors, the strongest ferromagnetic signal has been observed for the 4.0% Er doped sample and that ferromagnetic contribution decreases with the increase of the Er content.
The increase of saturation magnetic susceptibility between 1 and 2% Er can be explained by the effect of Er ion since the magnetic moment attributing paramagnetism only to Er was observed to be 3.612 μB per f.u. for 2% Er (Table 3). On the other hand, the origin of room-temperature magnetism could be derived from secondary phase. In fact, Li et al. have confirmed recently by the first-principle calculations, that Al-vacancy can introduce magnetic moment for 3 μB in Al2O3 crystal and form stable VAl–VAl ferromagnetic coupling at room temperature.39,40 Ma et al. observed RT FM in Al doped ZnO after vacuum annealing and ascribed it to the charge transfer between Al and ZnO, which can cause the electronic structure alternation of Zn and Al.41 so, when analyzing the magnetic properties of these nano-oxides, it is particularly important to ensure that there is no contamination due to the use of iron based tools in any step of the sample handling.42,43
Increasing Er content to 3% lead to a drop in estimated magnetic susceptibility to about 3.32 × 10⁻⁴ μB per f.u. (Table 3) as compared to 2% Er doped sample (6.67 × 10⁻⁴ μB per f.u.), could be due to an increasing occurrence of antiferromagnetic coupling or super exchange interaction between neighboring ions at shorter separation distances, which was similar to the doped oxide semiconductor films like Cu-doped ZnO and Er-doped ZnO.38,44,45 Similarly, SnO2:Er nanoparticles prepared by sol–gel method show only the occurrence of a paramagnetism with the presence of a weak Er–Er antiferromagnetic interactions, which become stronger as the Er concentration increases.46 In fact, a strong paramagnetic-like behavior coexisting with a ferromagnetic order at room temperature has been determined for samples with Er content up to 5.0%. Above this concentration, only a paramagnetic behavior has been determined.
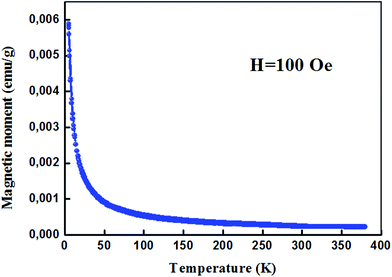
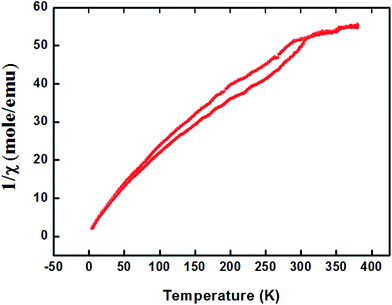
For proper investigation of the magnetic properties of Zn0.95Al0.03Er0.02O nanoparticles, the temperature dependence of the magnetic moment has been estimated at a constant magnetic field of 100 Oe. The behavior of the curve shown in Fig. 8 is a Curie type paramagnet, which is a type of magnetism resulting from the presence of atoms with unpaired electrons. Curie-type paramagnetism has a particular temperature dependence:
| χm(T) = Cm/T | (3) |
| Cm = bPeff2N | (4) |
3.4. First principle calculations
The Er and Al co-dopings were simulated by substituting four Zn atoms in the supercell with five different configurations. The concentration of dopants is 3.704 at%. The concentration of dopants is hard to decrease to close to the experimental value due to huge computation consume. The ferromagnetic (FM) and antiferromagnetic (AFM) orderings of the doped systems are simulated by altering the magnetic moment of the Er. The GGA + U (ref. 54) method was used to describe the exchange and correlation potential. The on-site Coulomb interaction Ueff = 5.5 eV and 5.0 eV is employed to describe the correlation effects in localized f orbital of Er and d orbital of Zn.
 | (5) |
Five different configurations of Er and Al co-doped ZnO systems with different distance between Er and Al are considered as shown in our previous study.55 The distance between Er and Al changes from 3.2 to 9.2 Å in these simulated cells. Table 4 shows the formation energies of Er and Al co-doped systems with different configurations ‘a’ to ‘e’. All co-doped configurations show negative formations energies indicating the Er and Al can be thermodynamically doped into ZnO. The AFM and FM magnetic orderings almost own same formation energies indicating the similar stabilities. Therefore, the total magnetic moments of these doped systems are almost the zero. For the Er doped systems, four different configurations are considered (a is equivalent to b configuration). The Er-d system is the most stable configuration among the studied systems. Its magnetic moment is 0.034 μB per cell, and therefore it shows weak FM property. However, there are some discrepancies with our experimental findings, which may be caused by the influence of defects and the segregations of Er element and/or the secondary phase.
| Doped systems | AFM | FM | ||
|---|---|---|---|---|
| ErAl | Er | ErAl | Er | |
| a | −2.5306 | −3.170 | −2.5305 | −3.170 |
| b | −2.5738 | — | −2.5740 | — |
| c | −2.6526 | −3.266 | −2.6527 | −3.266 |
| d | −2.6644 | −3.388 | −2.6643 | −3.388 |
| e | −2.7004 | −3.379 | −2.7004 | −3.378 |
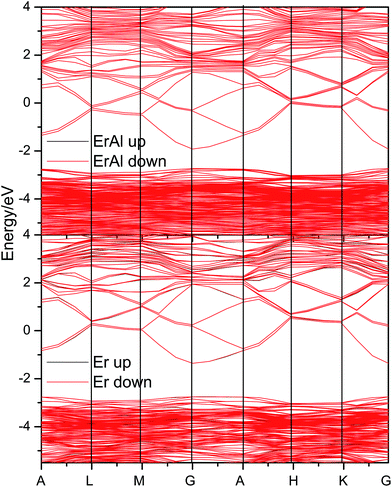
In order to study the influence of dopants on the electronic structures and magnetic properties, the band structures of the most stable Er and Al co-doped, and Er doped systems are evaluated and shown in Fig. 10. These two doped systems show similar band structure, except the different band gap. The Al pulls about 0.6 eV closer the conduction band to the valence band comparing the Er solely doped system. Therefore, the further doping of Al can adjust the band gap in Er doped systems. Furthermore, the Er and Al co-doped systems almost have no spin-polarization, i.e., the spin-up and spin-down band overlaps well. There are small difference between spin-up and spin-down band, which causing small magnetic moments.
4. Conclusion
In this study un-doped and (Al,Er) co-doped ZnO NPs have been successfully synthesized by hydrothermal method. The XRD results show that all doped samples have hexagonal structure with the preferential orientation along the (101) and low amount of α-Al2O3 secondary phase. The ZnO crystallites are in the nanometer range. The TEM results display that the incorporation of Al and Er ions in crystal structure of ZnO can't change the morphology of ZnO NPs. The magnetic properties are found to change with varying dopant content. The ab initio calculations reveals that Er and Al co-doped systems are thermodynamically stable. The Al can adjust the band gap of the Er doped system and hardly change the distributions of electronic structures.Acknowledgements
Dr Mohamed Bououdina would like to thank Chinese Academy of Science (CAS) through CAS President's International Fellowship Initiative Grant No. 2015 VTA016.References
- A. Kołodziejczak-Radzimska and T. Jesionowski, Materials, 2014, 7, 2833–2881 CrossRef.
- A. Kharatzadeh, F. Jamali-Sheini and R. Yousefi, Mater. Des., 2016, 107, 47–55 CrossRef CAS.
- R. F. Dezfuly, R. Yousefi and F. Jamali-Sheini, Ceram. Int., 2016, 42, 7455–7461 CrossRef CAS.
- A. Saáedi, R. Yousefi, F. Jamali-Sheini, A. K. Zak, M. Cheraghizade, M. R. Mahmoudian, M. A. Baghchesara and A. S. Dezaki, Phys. E, 2016, 79, 113–118 CrossRef.
- Y. Liu, W. Zhou and P. Wu, J. Alloys Compd., 2014, 615, 401–405 CrossRef CAS.
- M. B. Abbas and A. A. Araa, Journal of Kerbala University, 2011, 9(2), 249–255 Search PubMed.
- L. Dghoughi, F. Ouachtari, M. Addou, B. Elidrissi, H. Erguig, A. Rmili and A. Bouaoud, Phys. B, 2010, 405, 2277–2282 CrossRef CAS.
- S. Y. Kuo, W. C. Chen, F. I. Lai, C. P. Cheng, H. C. Kuo, S. C. Wang, W. F. Hsieh and J. Cryst, Growth, 2006, 287, 78–84 CrossRef CAS.
- X. Zhao, S. Komura, H. Isshiki, Y. Aoyagi and T. Sugano, J. Lumin., 2000, 87–89, 1254–1256 CrossRef CAS.
- P. G. Kik and A. Polman, Mater. Res. Soc. Bull., 1998, 23, 48–54 CrossRef CAS.
- M. A. Lamrani, M. Addou, Z. Sofiani, B. Sahraoui, J. Ebothé, A. El Hichou, N. Fellahi, J. C. Bernède and R. Dounia, Opt. Commun., 2007, 277, 196–201 CrossRef CAS.
- Y. Chen and X. L. Xu, Phys. B, 2011, 406, 3121–3124 CrossRef CAS.
- X. H. Zhang, J. Chen, Y. P. Wu, Z. X. Xie, J. Y. Kang and L. S. Zheng, Colloids Surf., A, 2011, 384, 580–584 CrossRef CAS.
- J. Huo, L. Fang, Y. Lei, G. Zeng and H. Zeng, J. Mater. Chem. A, 2014, 2, 11040–11044 CAS.
- A. Vanaja, G. V. Ramaraju and K. Srinivasa Rao, Indian J. Sci. Technol., 2016, 9, 1–6 Search PubMed.
- H. Bai, Mater. Lett., 2010, 64, 341–343 CrossRef CAS.
- H. M. Rietveld, J. Appl. Crystallogr., 1969, 2, 65–71 CrossRef CAS.
- R. A. Young and D. B. Wiles, J. Appl. Crystallogr., 1982, 15, 430–438 CAS.
- G. Marris, V. Volotchaev and T. T. M. Palstra, New J. Phys., 2004, 6, 153 CrossRef.
- X. Zhang, S. Dong, X. Zhou, L. Yan, G. Chen, S. Dong and D. Zhou, Mater. Lett., 2015, 143, 312–314 CrossRef CAS.
- J. Z. Kong, Z. Wang, C. Y. Luan, M. L. Wang, F. Zhou, X. M. Wu, W. J. Zhang, K. J. Zhu, J. H. Qiu, J. A. Zapien and S. T. Lee, J. Mater. Sci.: Mater. Electron., 2013, 24, 3868–3874 CrossRef CAS.
- M. Ahmad, E. Ahmed, Y. Zhang, N. R. Khalid, J. Xu, M. Ullah and Z. Hong, Curr. Appl. Phys., 2013, 13, 697–704 CrossRef.
- S. D. Senol, J. Mater. Sci.: Mater. Electron., 2016, 27(8), 7767–7775 CrossRef CAS.
- A. A. Dakhel and M. El-Hilo, J. Appl. Phys., 2010, 107, 123905–123906 CrossRef.
- M. Yilmaz, Phys. Scr., 2014, 89, 095802 CrossRef.
- U. Ozgur, Y. I. Alivov, C. Liu, A. Teke, M. A. Reshchikov, S. Dogan, V. Avrutin, S. J. Cho and H. Morkoc, J. Appl. Phys., 2005, 98, 041301 CrossRef.
- M. Gaudon, O. Toulemonde and A. Demourgues, Inorg. Chem., 2007, 46, 10996–11002 CrossRef CAS PubMed.
- Y. Wang, J. Piao, Y. Lu, S. Li and J. Yi, Mater. Res. Bull., 2016, 83, 408–413 CrossRef CAS.
- P. K. Giri, S. Bhattacharyya, B. Chetia, S. Kumari, D. K. Singh and P. K. Iyer, J. Nanosci. Nanotechnol., 2011, 11, 1–6 CrossRef.
- D. E. Newbury, Scanning, 2009, 31, 1–11 CrossRef PubMed.
- C. Peng, Y. Liang, K. Wang, Y. Zhang, G. Zhao and Y. Wang, J. Phys. Chem. C, 2012, 116(17), 9709–9715 CAS.
- M. Bououdina, Y. Song and S. Azzaza, Reference Module in Materials Science and Materials Engineering, 2016, DOI:10.1016/B978-0-12-803581-8.02431-0.
- G. Z. Xing, D. D. Wang, J. B. Yi, L. L. Yang, M. Gao, M. He, J. H. Yang, J. Ding, T. C. Sum and T. Wu, Appl. Phys. Lett., 2010, 96, 112511 CrossRef.
- S. Azzaza, M. El-Hilo, S. Narayanan, J. Judith Vijaya, N. Mamouni, A. Benyoussef, A. El Kenz and M. Bououdina, Mater. Chem. Phys., 2014, 143, 1500–1507 CrossRef CAS.
- F. H. Aragon, V. A. Chitta, J. A. H. Coaquira, P. Hidalgo and H. F. Brito, J. Appl. Phys., 2013, 114(203902), 1–7 Search PubMed.
- T. Yong-Sheng, F. Ze-Bo, C. Wei and H. Pi-Mo, Chin. Phys. B, 2010, 19, 097502 CrossRef.
- J. Qi, D. Gao, J. Liu, W. Yang, Q. Wang, J. Zhou, Y. Yang and J. Liu, Appl. Phys. A, 2010, 100, 79–82 CrossRef CAS.
- J. Qi, Y. Yang, L. Zhang, J. Chi, D. Gao and D. Xue, Scr. Mater., 2009, 60, 289–292 CrossRef CAS.
- Q. Li, J. Xu, J. Liu, H. Du and B. Ye, J. Appl. Phys., 2015, 117, 233904 CrossRef.
- A. Sundaresan, R. Bhargavi, N. Rangarajan, U. Siddesh and C. N. R. Rao, Phys. Rev. B: Condens. Matter Mater. Phys., 2006, 74(R), 161306 CrossRef.
- Y. W. Ma, J. Ding, J. B. Yi, H. T. Zhang and C. M. Ng, J. Appl. Phys., 2009, 105, 07C503 CrossRef.
- D. W. Abraham, M. M. Frank and S. Guha, Appl. Phys. Lett., 2005, 87, 252502 CrossRef.
- M. A. Garcia, E. Fernandez Pinel, J. de la Venta, A. Quesada, V. Bouzas, J. F. Fernández, J. J. Romero, M. S. Martín González and J. L. Costa-Krämer, J. Appl. Phys., 2009, 105, 013925 CrossRef.
- D. L. Hou, X. J. Ye, X. Y. Zhao, H. J. Meng, H. J. Zhou, X. L. Li and C. M. Zhen, J. Appl. Phys., 2007, 102, 033905 CrossRef.
- D. Chakraborti, G. R. Trichy, J. T. Prater and J. Narayan, J. Phys. D: Appl. Phys., 2007, 40, 7606 CrossRef CAS.
- S. Sambasivam, D. Joseph, J. Jeong, B. Choi, K. Lim, S. Kim and T. Song, J. Nanopart. Res., 2011, 13, 4623–4630 CrossRef CAS.
- S. K. Mandal, A. K. Das, T. K. Nath and D. Karmakar, Appl. Phys. Lett., 2006, 89, 144105 CrossRef.
- G. Kresse and J. Hafner, Phys. Rev. B: Condens. Matter Mater. Phys., 1993, 47, 558–561 CrossRef CAS.
- G. Kresse and J. Furthmüller, Phys. Rev. B: Condens. Matter Mater. Phys., 1996, 54, 11169–11186 CrossRef CAS.
- J. P. Perdew, J. A. Chevary, S. H. Vosko, K. A. Jackson, M. R. Pederson, D. J. Singh and C. Fiolhais, Phys. Rev. B: Condens. Matter Mater. Phys., 1992, 46, 6671–6687 CrossRef CAS.
- G. Kresse and D. Joubert, Phys. Rev. B: Condens. Matter Mater. Phys., 1999, 59, 1758–1775 CrossRef CAS.
- E. H. Kisi and M. M. Elcombe, Acta Crystallogr., 1989, 45, 1867–1870 Search PubMed.
- H. Rozale, A. Lakdja, A. Lazreg and P. Ruterana, Phys. Status Solidi B, 2010, 247(7), 1641–1644 CrossRef CAS.
- S. L. Dudarev, G. A. Botton, S. Y. Savrasov, C. J. Humphreys and A. P. Sutton, Phys. Rev. B: Condens. Matter Mater. Phys., 1998, 57, 1505–1509 CrossRef CAS.
- J. Arul Mary, J. Judith Vijaya, M. Bououdina, L. John Kennedy, J. H. Dai and Y. Song, Phys. B, 2015, 456, 344–354 CrossRef CAS.
| This journal is © The Royal Society of Chemistry 2017 |

