 Open Access Article
Creative Commons Attribution 3.0 Unported Licence
Preparation of conductive microfiltration membrane and its performance in a coupled configuration of membrane bioreactor with microbial fuel cell†
Lihua Huang abc,
Xiufen Li
 *ac,
Yueping Renac and
Xinhua Wang
 ac
ac
aLaboratory of Environmental Biotechnology, School of Environmental and Civil Engineering, Jiangnan University, Wuxi 214122, PR China. E-mail: xfli@jiangnan.edu.cn; Tel: +86 510 85326516
bSchool of Agriculture and Forestry Science, Linyi University, Linyi 276005, PR China
cJiangsu Key Laboratory of Anaerobic Biotechnology, Wuxi 214122, PR China
First published on 11th April 2017
Abstract
A conductive flat microfiltration membrane (G-FM) was prepared with polyvinylidene fluoride (PVDF), N-methyl-2-pyrrolidone (NMP), polyvinyl pyrrolidone (PVP) and reduced graphene oxide (RGO) on stainless steel mesh base by the method of immersion-precipitation phase transformation. The pure water flux and mean pore size of the prepared G-FM were 712 ± 62 L m−2 h−1 bar−1 and 0.09 ± 0.01 μm, respectively. Equipped with the prepared G-FM, the coupled configurations of membrane bioreactor (MBR) with microbial fuel cell (MFC) removed 96.6% ± 3.9% COD, 95.8% ± 5.7% NH3–N and 94.7% ± 5.2% total nitrogen and generated 349 ± 19 mW m−2 bioelectricity from the synthetic municipal wastewater. Moreover, the membrane fouling was reduced due to enhanced hydrophilicity and electrostatic repulsive forces. The coupled configuration with the G-FM presents a bright future in the field of wastewater treatment and greatly promotes the practical application of MBR and MFC.
1. Introduction
Microbial fuel cell (MFC) is a technology that uses exoelectrogens onto the anode to oxidize organic or reduced inorganic matter from waste streams and produces renewable energy in the form of bioelectricity.1–3 However, it is not sufficient as a standalone wastewater treatment process to achieve satisfactory effluent quality, and the effluent requires further treatment to meet the relevant requirements for water quality.4,5 Compared with the conventional activated sludge process, a membrane bioreactor (MBR) uses a membrane module for separation of solid from liquid, and higher sludge concentration has the capability of initiating a series of biological reactions to simultaneously remove organic carbon and nitrogen. It was of special interest due to excellent quality effluent, a smaller footprint and less waste-activated sludge and is gaining more and more popularity in the context of wastewater reclamation and reuse. However, there are still some issues, such as inevitable membrane fouling, higher energy consumption for aeration and stability for long-term operation, which limit its widespread application.6–8The combined configuration of MFC with MBR proposed recently has potential to simultaneously supply qualified water and bioelectricity from wastewater. For example, the waste stream is first passed through MFC and then through MBR for further treatment to achieve qualified effluent in the two-stage MFC and MBR system.9,10 Essentially, MFC and MBR were independent and spatially separated in those systems, leading to a larger footprint. Then, the integral hybrid MFC–MBR reactors appeared, which contained conductive membrane, such as conductive ultrafiltration membrane bio-cathode,5 polypyrrole and 9,10-anthraquinone-2-sulfonic acid modified stainless steel mesh cathode membrane,11 reduced graphene oxide (RGO)/polypyrrole modified polyester cathode membrane,12 an effective cathode membrane with carbon fiber cloth, polyvinylidene fluoride (PVDF) and a catalyst containing C, Mn, Fe and O elements,13 and stainless steel mesh with biofilm.14 The conductive membranes played a dual role by serving as the filter membrane in MBR and the cathode in MFC. However, the abovementioned conductive membranes were not traditional filter membranes. The stability and durability of these conductive membranes were of great concern in long-term operation, and nitrogen removal was not mentioned in those investigations.
In this manuscript, we prepared a conductive flat microfiltration membrane using a mixture of PVDF, N-methyl-2-pyrrolidone (NMP) and polyvinyl pyrrolidone (PVP) with RGO on a stainless steel mesh base by the method of immersion-precipitation phase transformation, herein, called RGO-flat membrane (G-FM). The fundamental performance parameters of G-FM accorded with traditional membranes. Equipped in single-chamber MFC reactors, the prepared G-FM functioned as a microfiltration membrane for MBR and a cathode for MFC, successfully integrating MBR and MFC together for treatment of synthetic municipal wastewater. A higher pollutant removal efficiency was achieved in the coupled configurations, which also synchronously outputted bioelectricity.
2. Experimental section
2.1. Preparation of the G-FM
First, 84 mL NMP (Sinopharm Chemical Reagent Co., Ltd, China), 4 g PVP (Mw = 40![[thin space (1/6-em)]](https://www.rsc.org/images/entities/char_2009.gif) 000 Da, Sinopharm Chemical Reagent Co., Ltd, China) and 12 g PVDF (FR904, Mw = 2.0 × 10⁶ Da, Mn = 6.0 × 10⁵ Da, Shanghai 3F New Materials Co., Ltd, China) were transferred to a 250 mL three-neck round flask in turn, and the solution was stirred (400 rpm) for 24 h at 60 °C. The addition of RGO to conventional casting membrane solution (CMS) was believed to make microfiltration membrane conductive, whereas overdosing RGO inevitably impacted the CMS viscosity and further the pore size of the prepared membrane. After the dosage of RGO was optimized, 5 g RGO was dispersed into the above solution, sonicated (KQ500DA, Kunshan, China) for 6 h at 400 W, and stirred (400 rpm) for 24 h at 60 °C to obtain homogeneous CMS. After fully degassing for 48 h, CMS was accurately casted at a thickness of 300 μm on a stainless steel mesh (above, 300 mesh, Shanghai Teson Sieving Filtrating Equipment Co., Ltd, China) and polypropylene non-woven base (below, 40 μm average pore size, 100 nm thickness, 60 g m−2, Shanghai SINAP Membrane Science and Technology Co., Ltd, China) using a coating machine (FA-102, Shanghai Fuan Enterprise Development Co., Ltd, China), wherein the stainless steel mesh served as current collector and polypropylene non-woven fabric as the supporting base. Then, the membrane precursor obtained was immediately immersed in a coagulation bath (here distilled water) for 48 h at 25 °C to remove all the residual solvent by refreshing distilled water frequently, and the prepared G-FM was finally obtained. The preparation process is demonstrated in Fig. S1.† RGO nanosheets were prepared with natural graphite powder (100 mesh) by a modified Hummers method (Fig. S2†).15
000 Da, Sinopharm Chemical Reagent Co., Ltd, China) and 12 g PVDF (FR904, Mw = 2.0 × 10⁶ Da, Mn = 6.0 × 10⁵ Da, Shanghai 3F New Materials Co., Ltd, China) were transferred to a 250 mL three-neck round flask in turn, and the solution was stirred (400 rpm) for 24 h at 60 °C. The addition of RGO to conventional casting membrane solution (CMS) was believed to make microfiltration membrane conductive, whereas overdosing RGO inevitably impacted the CMS viscosity and further the pore size of the prepared membrane. After the dosage of RGO was optimized, 5 g RGO was dispersed into the above solution, sonicated (KQ500DA, Kunshan, China) for 6 h at 400 W, and stirred (400 rpm) for 24 h at 60 °C to obtain homogeneous CMS. After fully degassing for 48 h, CMS was accurately casted at a thickness of 300 μm on a stainless steel mesh (above, 300 mesh, Shanghai Teson Sieving Filtrating Equipment Co., Ltd, China) and polypropylene non-woven base (below, 40 μm average pore size, 100 nm thickness, 60 g m−2, Shanghai SINAP Membrane Science and Technology Co., Ltd, China) using a coating machine (FA-102, Shanghai Fuan Enterprise Development Co., Ltd, China), wherein the stainless steel mesh served as current collector and polypropylene non-woven fabric as the supporting base. Then, the membrane precursor obtained was immediately immersed in a coagulation bath (here distilled water) for 48 h at 25 °C to remove all the residual solvent by refreshing distilled water frequently, and the prepared G-FM was finally obtained. The preparation process is demonstrated in Fig. S1.† RGO nanosheets were prepared with natural graphite powder (100 mesh) by a modified Hummers method (Fig. S2†).15
2.2. Reactors and operation
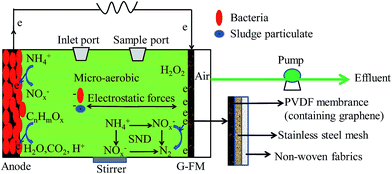
The plexi-glass reactors had a total effective volume of 28 mL and were constructed as previously described.16 Two types of reactors were equipped with the prepared G-FM cathodes and operated in open (G-FMopen) and closed circuit (G-FMclosed) modes, respectively. As controls, another two types of reactors were established with commercial flat membranes (FM, Jiangsu Lantian Peier Membrane Co., Ltd, China) and Pt/C electrodes to replace the G-FM cathodes, and the commercial FM reactors were also in open circuit. Therefore, the commercial FM and G-FMopen served as MBR, the Pt/C reactors as MFC, and the prepared G-FMclosed reactors were coupled configurations of MBR and MFC. The Pt/C cathode was prepared according to previous literature by applying platinum (0.5 mg cm−2 Pt, Hispec3000, Shanghai Hesen Electric Co., Ltd, China) and four diffusion layers (polytetrafluoroethylene, PTFE) on a wet-proofed carbon cloth (HCP330P, Shanghai Hesen Electric Co., Ltd, China).17 The graphite felt anode (3.0 cm diameter, 0.5 cm thickness, Beijing Sanye Carbon Co., Ltd, China) with a projected area of 7 cm2 was positioned in parallel opposite to the cathode across an external resistance of 1000 Ω in Pt/C and G-FMclosed reactors. The commercial FM and G-FM were fixed by the end plates with 0.3 cm diameter hole and bolted together with “O ring” rubber gasket. The holes served as the air channel for the oxygen reduction reaction (ORR) of the cathode and also enabled removal of the effluent under applied TMPs across FM at the end of each reaction cycle.The G-FMclosed and Pt/C reactors were inoculated with 14.0 mL effluent from the existing well-running MFC (originally seeded with Taihu Lake sediment, China) in our lab., and then 14 mL synthetic municipal wastewater was added. The synthetic municipal wastewater contained glucose (230 mg L−1), peptone (60 mg L−1), sodium acetate (40 mg L−1), beef extract (20 mg L−1), NaHCO3 (198 mg L−1), KH2PO4 (12 mg L−1), NH4HCO3 (170 mg L−1), MgCl2·6H2O (2.4 mg L−1), CaCl2 (1.2 mg L−1) and FeCl3·6H2O (1 mg L−1), with COD of 377 ± 8 mg L−1 and electrical conductivity of 893 ± 24 μS cm−1. After the G-FMclosed and Pt/C reactors outputted stable voltages for three consecutive cycles, the start-up of MFC reactors was successful. Then, all reactors were inoculated by the mixture of equal anaerobic (with moisture content of 78%) and aerobic (with moisture content of 83%) sludge with synthetic municipal wastewater, and the final suspended solids (SS) was around 4 g L−1. When the outputted voltage of the G-FMclosed and Pt/C reactors declined to 10 mV (∼3 days), the first cycle was over and the effluent was removed for water quality analysis. For the commercial FM, G-FMopen and G-FMclosed reactors, the effluent was filtered through membrane module using peristaltic pumps (YZ1515X-A, Baoding Longer Precision Pump Co., Ltd, China), and the TMP values were measured using a U-shaped mercury manometer. Before filtration, 2.8 mL of mixture for sludge viability was obtained by a syringe from a sample port at the end of each reaction cycle, and hence the sludge retention time (SRT) was about 30 days. A schematic of the G-FMclosed reactors is shown in Fig. 1. For the Pt/C reactors, the effluent was directly poured out of the sample port. All reactors mentioned above were operated in fed-batch mode at 25 ± 1 °C under stirring conditions (100 rpm) and each type of reactor was duplicated.
2.3. Analyses
The electrochemical analyses were performed using an electrochemical workstation (CHI660D, Shanghai Chenhua Instruments Co., Ltd, China) with a three-electrode model, wherein Pt wire was the counter electrode, and a saturated calomel electrode (SCE, type of 232, 0.2244 V vs. SHE, Shanghai Leici) was the reference electrode. The conductivity of bare cathodes was examined by cyclic voltammetry (CV) in 1 mol L−1 KCl solution (containing 0.05 mol L−1 potassium ferricyanide, pH = 7.0) from −0.2 to 0.8 V (vs. SCE) at a scan rate of 5 mV s−1. Linear sweep voltammetry (LSV) was applied to investigate the catalytic activity of cathode for ORR based on onset potential and current density in synthetic municipal wastewater from 0.4 to −0.5 V (vs. SCE) at a scan rate of 1 mV s−1. Tafel plots were conducted in synthetic municipal wastewater at a scan rate of 1 mV s−1, with the calculation of exchange current density (j0) and electron transfer number (n) during ORR according to the method previously described.18,19 Before electrochemical testing, the bare cathode, equipped as working electrode, was immersed in the relevant solution for 24 h. Cell voltage was automatically recorded using a data acquisition unit (34972A, Agilent Technologies Inc, USA) at a pre-determined sampling frequency across an external resistance of 1000 Ω. Polarization and power density curves were measured using the LSV method, scanning from open circuit voltage to zero at a scanning rate of 1 mV s−1,20 and the individual electrode potential was recorded by another electrochemical workstation synchronously, wherein the maximum power density (Pmax) and current density were normalized by the cathode projected area (7 cm2). Electrochemical impedance spectroscopy (EIS) was conducted over a frequency range of 1 × 10⁵ to 0.005 Hz under open-circuit voltage, with a sinusoidal perturbation amplitude of 10 mV.21 The activity variation of cultured Pt/C and G-FM cathodes through the scanning range for ORR was examined by CV from 0.4 to −0.8 V (vs. SCE) at a scanning rate of 1 mV s−1. Using oxygen as electron acceptor, coulombic efficiency (CE) was calculated based on COD removal by a method described by Kim et al.22 All of the electrochemical tests in MFC reactors were performed in situ for the purpose of obtaining the testing results closer to those of the actual system. Before electrochemical measurement, the Pt/C and G-FMclosed reactors were operated in open-circuit mode for over 1 h.The virgin commercial FM was immersed in deionized water for 48 h to remove glycerin covered on the surface. Then, the cleaned commercial FM together with the bare G-FM was vacuum freeze-dried for 24 h (Freezone 1L, Labconco), plunged into liquid nitrogen for 5 min, and then cut into small strips with scissors in liquid nitrogen for morphology observation using a scanning electron microscope (SEM, S-3400N, Hitachi) and element identification using energy dispersive X-ray spectroscopy (EDX). The biofouling layer attached on the membrane or cathode surface was observed using confocal laser scanning microscopy (CLSM, LSM 710, ZEISS) according to a previous study.23 Concanavalin A (ConA), calcofluor white (CW), fluorescein isothiocyanate (FITC) and SYTO 63 were used to label α- and β-D-glucopyranose polysaccharides, proteins and total cells, respectively. The hydrophilicity of the commercial FM and G-FM was evaluated by measuring the contact angle using the drop shape analysis system (OCA40, Dataphysics Company). A water droplet was deposited on the membrane surface and the instantaneous contact angle obtained within 0.2 s was recorded to ensure that observable vibration of the liquid drop had already ceased. The contact angle data were the average of measurements at five locations for each sample.24 Pure water flux was calculated by J = Q/(A × t),24 where Q is the volume of permeate within time t (L), A is the effective area of membrane (m2), and t is the time (h). The mean pore size was measured by the filtration velocity method based on the Guerout–Elford–Ferry equation,25 and the maximum pore size was determined by the bubble point method.26 Membrane porosity was measured using a gravimetric method and details of the procedure are available elsewhere.27
COD, NH3–N and TN were analyzed using a spectrophotometer (UV-1800, Shimadzu).28 The biomass density was determined by lipid-phosphorus method.29 The dissolved oxygen (DO) concentration in reactors was determined by portable detector (Multi 3430, WTW).
3. Results and discussions
3.1. Characterization of the prepared G-FM
As shown in Fig. S3,† a clear peak current of the redox reaction for Fe3+/Fe2+ was observed during CV scanning of the Pt/C and G-FM, indicating that the prepared G-FM was conductive. The conductive path was possibly bridged across the membrane matrix by RGO and a stainless steel mesh, which kept the prepared G-FM conductive. However, the conductivity of the prepared G-FM was slightly inferior to that of the Pt/C, based on the peak current density and difference of peak potentials. As seen from LSV curves of the bare Pt/C and G-FM cathodes (Fig. 2a), the onset potential was 0.175 ± 0.032 V (vs. SCE) for the Pt/C and −0.015 ± 0.002 V (vs. SCE) for the prepared G-FM, and the current density of the Pt/C cathode was significantly larger than that of the prepared G-FM one. It illustrated that the prepared G-FM had catalytic activity for the ORR, which was inferior to that of the Pt/C. Approximate j0 values calculated by Tafel curves (Fig. 2b) were 0.25 ± 0.03 mA cm−2 for the Pt/C and 0.14 ± 0.02 mA cm−2 for the prepared G-FM, also showing that the catalytic activity of the prepared G-FM was less effective than that of the Pt/C cathode. The calculated n values were 2.7 ± 0.4 for Pt/C and 2.2 ± 0.3 for the prepared G-FM cathode. The n value of the Pt/C for ORR was nearly 4 in previous literature, wherein the catalyst was uniformly coated on a glassy carbon disk electrode with a diameter of 4 mm assembled on rotating disk electrode in an O2-saturated environment.19 The smaller n value for the Pt/C cathode in this study might be associated with non-aerated electrolyte, larger projected area (7 cm2) and lower ionic strength (893 ± 24 μS cm−1). Under the examined conditions, the process for ORR with the Pt/C and G-FM cathodes was mainly dominated by 2 electronic processes, and doping was carried out by more or less 4 electronic processes.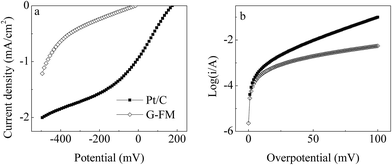 | ||
| Fig. 2 (a) LSV and (b) Tafel curves of the bare Pt/C and prepared G-FM in synthetic municipal wastewater at a scanning rate of 1 mV s−1. | ||
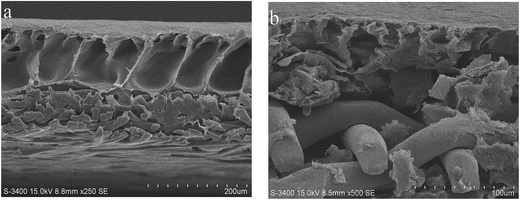
The cross-section structure of the bare commercial FM and prepared G-FM was revealed by SEM observation (Fig. 3). The commercial FM displayed a typical asymmetric morphology, containing a dense skin layer and a porous sub-layer with a finger-like structure (Fig. 3a).30,31 The prepared G-FM also displayed an asymmetric morphology. However, with the addition of RGO into CMS and the introduction of stainless steel mesh, the membrane structure was significantly transformed; the section of the prepared G-FM seemed irregular, and the finger-like macropore became much smaller (Fig. 3b).
The contact angles of the commercial FM and G-FM were 74.5° ± 3.7° and 61.2° ± 2.9°, respectively (Fig. S4†), indicating that the prepared G-FM was more hydrophilic. As identified by EDX analysis (Fig. S5†), the oxygen content of the prepared G-FM reached 4.08% and was higher than that of the commercial FM (not detected). Due to incomplete oxidation or reduction during the process of preparation, the RGO, prepared by redox method, usually contained a certain number of hydrophilic oxygen-containing groups, such as hydroxyl, carboxyl and carbon–oxygen bonds,32 that caused the addition of RGO into CMS to increase the hydrophilicity of the prepared G-FM. The mean and maximum pore sizes diminished to 0.09 ± 0.01 μm and 0.65 ± 0.06 μm for the prepared G-FM and from 0.11 ± 0.01 μm and 0.89 ± 0.08 μm for the commercial FM, respectively, with the result that the void ratio and pure water flux declined to 63.9% ± 4.2% and 712 ± 62 L m−2 h−1 bar−1 for the prepared G-FM and to 72.3% ± 8.7% and 1634 ± 124 L m−2 h−1 bar−1 for the commercial FM, respectively (Table 1).
| Parameter | Commercial FM | Prepared G-FM |
|---|---|---|
| a Values were averages ± standard errors based on the three pieces of each membrane. | ||
| Mean pore size (μm) | 0.11 ± 0.01 | 0.09 ± 0.01 |
| Maximum pore size (μm) | 0.89 ± 0.08 | 0.65 ± 0.06 |
| Void ratio (%) | 72.3 ± 8.7 | 63.9 ± 4.2 |
| Pure water flux [L m−2 h−1 bar−1] | 1634 ± 124 | 712 ± 62 |
3.2. Power generation
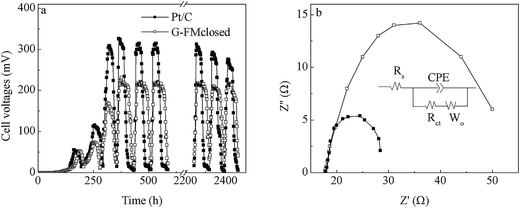
Over about 2 weeks, both Pt/C and G-FMclosed reactors started up successfully with 315 and 221 mV of cell voltages output, respectively (Fig. 4a). Although the stable outputted voltage of the Pt/C reactors was higher than that of the G-FMclosed reactors, the discharging time within one reaction cycle for stable outputted voltage in the G-FMclosed reactors (∼58 h) was longer than that in the Pt/C ones (∼39 h) at ≥100 mV, suggesting that the substrate in the Pt/C reactors was metabolized more quickly compared with the substrate in G-FMclosed reactors. For the Pt/C cathode, oxygen was permitted free access into the reactors via the air diffusion layer, leading to a micro-aerobic environment.17 However, the prepared G-FM cathode was infiltrated with water, indicating that there existed a larger resistance for oxygen to diffuse into the G-FMclosed reactors across the infiltrated layer. As the results show, the DO concentration in the G-FMclosed reactors at 0.45 ± 0.08 mg L−1 was lower than that in the Pt/C reactors (0.92 ± 0.13 mg L−1). In the Pt/C reactors, the exoelectrogens had to end the stable outputted voltage earlier due to lack of substrate, compared with the case of G-FMclosed reactors. It suggested that the difference between DO concentration in the Pt/C and G-FMclosed reactors led to the difference of discharging time for stable outputted voltage. The higher DO concentration may accelerate the substrate degradation rate by non-exoelectrogens. Although the stable outputted voltage in the G-FMclosed reactors was lower than that in the Pt/C ones, the discharging time in the G-FMclosed reactors was longer than that in the Pt/C ones. As a result, there was little difference in CE values with 26.4% ± 3.5% for the Pt/C reactors and 25.6 ± 3.2% for the G-FMclosed ones, based on the COD removal rates of 89.6 ± 7.6% in the Pt/C reactors and 93.7 ± 6.3% in the G-FMclosed ones.In the first reaction cycle, the Pmax values were 471 ± 24 mW m−2 for the Pt/C reactors and 349 ± 19 mW m−2 for the G-FMclosed ones (Fig. 5a). At the 23rd reaction cycle (two months later), these declined to 354 ± 16 mW m−2 for the Pt/C reactors and 306 ± 12 mW m−2 for the G-FMclosed ones by 24.8% and 12.3%, respectively (Fig. 5c). The Pmax value of the Pt/C reactors was 33.1% higher than that of the G-FMclosed ones at the first cycle, and it was only 14.0% after operation for two months. The anode potential of the two types of reactors changed negligibly and the cathode potential presented was quite different (Fig. 5b and d), indicating that the cathode performance was responsible for the variation in power generation. This suggested that the Pt/C cathode was more prone to being fouled than the prepared G-FM one, and the previous study had also showed that the catalyst activity of the Pt/C cathode decreased in long-term operation due to electrode pollution.33 The biomass density on the Pt/C cathodes was 6.47 ± 0.45 μg P per cm2, which was 3.6 times of that on the prepared G-FM, confirming that biofouling of the prepared G-FM cathodes was alleviated compared with that of the Pt/C ones. The difference in biomass density was assumed to be associated with the air diffusion efficiency across the cathodes as well as the DO concentration in the two types of reactors.
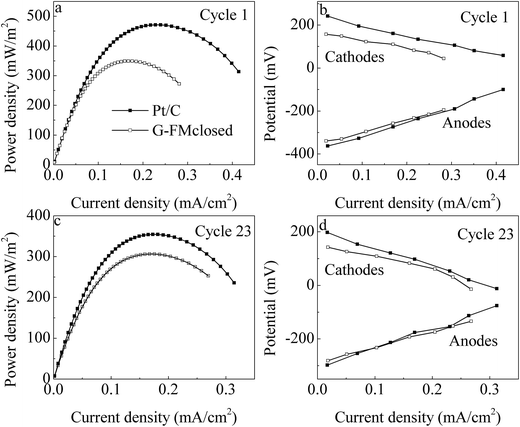 | ||
| Fig. 5 (a and c) Power density and (b and d) individual potential profiles in the Pt/C and G-FMclosed reactors. | ||
EIS was applied to analyze the resistance distribution, and it assumed that the cathode reaction was affected by both reaction kinetics and diffusion. A Randle equivalent circuit was usually chosen to model the complex impedance, in which the charge transfer resistance (Rct) at the electrode/electrolyte interface was equal to the diameter of the semicircle.34 Fig. 4b presents the Nyquist plot for the Pt/C and G-FMclosed reactors, each of which showed a semicircle without a straight line following it, demonstrating that the electrode reaction was controlled by the charge transfer step.21 The smaller Rct indicated a faster electron transfer rate between electrode and electrolyte.35 By fitting the data of the Nyquist plot using the Zview program, the solution resistance (Rs) was found to be little different between the Pt/C and G-FMclosed reactors. The Rct was 9.6 ± 0.8 Ω in the 3D-G reactors and 31 ± 4.5 Ω in the G-FMclosed reactors, which showed that the Pt/C cathode excelled the G-FMclosed one.
CV examination at the second and 20th reaction cycles was conducted to further compare the variation in catalytic activity of the cathode along with operation time (Fig. 6). The variation in the scan current density for the prepared G-FM cathodes was significantly less than that of the Pt/C ones, also showing that the catalytic activity of the prepared G-FM for ORR declined less than that of the Pt/C over long-term operation. In long-term operation, the prepared G-FM cathodes performed better than Pt/C ones and were favorable for sustainable generation of bioenergy.
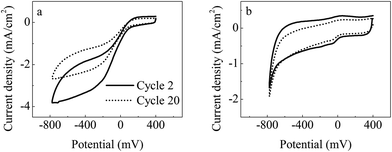 | ||
| Fig. 6 In situ CV (1 mV s−1) analysis of the cultured Pt/C (a) and G-FM (b) cathodes during operation. | ||
3.3. Effluent quality
After 9 cycles of operation, all reactors were in steady state and the effluent quality was analyzed by concentrations of COD, NH3–N and TN (Fig. 7). Due to no filtration, the Pt/C reactors removed the least pollutants with 87.2% ± 4.2% for COD, 51.3% ± 4.6% for NH3–N and 39.2% ± 3.9% for TN. The effluent quality in the FM, G-FMopen and G-FMclosed reactors was significantly superior to that in the Pt/C ones. The effluent concentrations of COD, NH3–N and TN were 29.8 ± 2.4, 5.5 ± 0.6 and 21.4 ± 1.2 mg L−1 in the FM reactors, 23.1 ± 2.3, 4.7 ± 0.5 and 16 ± 0.8 mg L−1 in the G-FMopen reactors, and 13.6 ± 0.2, 1.9 ± 0.1 and 3.5 ± 0.2 mg L−1 in the G-FMclosed reactors. Compared with the FM and G-FMopen reactors, there was a significant improvement in the G-FMclosed reactors with the removal efficiency of 96.6% ± 3.9% for COD, 95.8% ± 5.7% for NH3–N and 94.7% ± 5.2% for TN, suggesting that the current generation in the G-FMclosed reactors enhanced the pollutant removal efficiency. In the coupled configuration of MBR with MFC established here, the substrate metabolism of both bio-anode colonized by exoelectrogens/non-exoelectrogens and suspended sludge in the G-FMclosed reactor overlapped the pollutant removal efficiency.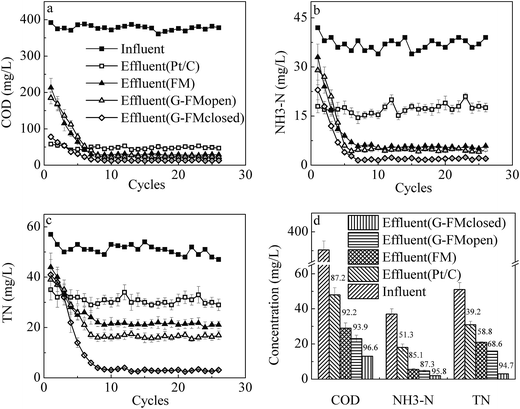 | ||
| Fig. 7 Removal rate of COD (a), NH3–N (b) and TN (c) during operation as well as effluent concentrations of COD, NH3–N and TN (d). | ||
Compared with the previous literature,5,9,14,36,37 the excellent nitrogen removal was mainly associated with DO concentration. It demonstrated that the micro-aerobic environment played an important role in nitrogen removal and a DO concentration of around 0.5 mg L−1 was conducive to complete simultaneous nitrification–denitrification (SND),37 during which NH3–N in synthetic wastewater was oxidized into NOx− and then further into N2.38,39 Air diffused passively into these reactors across the commercial FM and prepared G-FM, resulting in a micro-aerobic environment. The DO concentrations were 0.53 ± 0.06 mg L−1 for the FM reactors, 0.47 ± 0.05 mg L−1 for the G-FMopen reactors and 0.45 ± 0.08 mg L−1 for the G-FMclosed reactors. The higher DO concentration (0.92 ± 0.13 mg L−1) in the Pt/C reactors had harmed the nitrogen removal. In addition, the anaerobic ammonium oxidation near the bio-anode possibly contributed to TN removal, wherein NH3 could serve as an electron donor and be directly oxidized into N2.40 The reduction of NOx− to N2 by denitrification using the cathode as the electron donor also took place.38,39,41
3.4. Membrane fouling
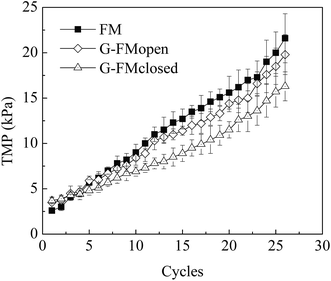
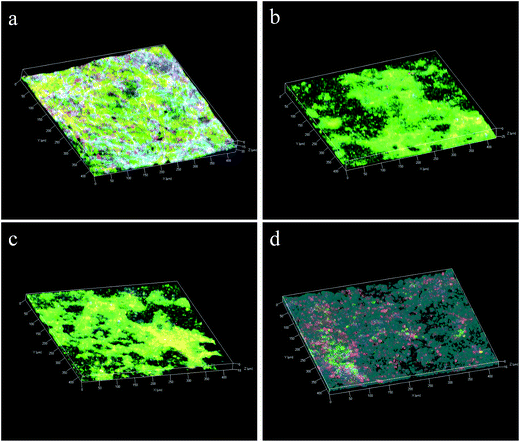
Over 26 reaction cycles (∼74 days) without membrane cleaning, the TMP values measured under constant flux condition increased to 16.3 ± 1.6 kPa from 3.7 ± 0.3 kPa in the G-FMclosed reactors, to 21.6 ± 2.7 kPa from 2.6 ± 0.3 kPa in the FM reactors, and to 19.8 ± 2.2 kPa from 3.5 ± 0.6 kPa in the G-FMopen reactors (Fig. 8). It indicated that the membrane fouling in the G-FMclosed reactors was less than that of the other two reactors. The membrane fouling layer in MBR generally contained an outer bio-cake layer (derived from suspended solid) on the membrane surface and an inner gel layer (derived from soluble microbial polymer or extracellular polymeric substance) within the membrane pores. The former contributed to reversible fouling and the latter to the irreversible fouling (blocking and clogging pores).42,43 The improvement in hydrophilicity of microfiltration membrane was able to weaken the interaction between foulants (colloids or extracellular polymeric substances) and membrane, which further alleviated irreversible fouling.24 In this study, it demonstrated that the introduction of RGO into CMS improved hydrophilicity of the prepared G-FM. In addition, there existed electrostatic repulsive forces between the negatively charged bacteria (or sludge) and the electron-loading cathode in the G-FMclosed reactors, which was also conducive to less biofouling.36,44 The foulants on the surface of the membrane were possibly oxidized by H2O2 produced by the cathode reduction, which contributed to alleviating the biofouling.36,44 The reconstructed images of the 3D CLSM in Fig. 9 demonstrated that there was a big difference between the thickness of bio-cake layer on various membranes (or cathodes), with 36 ± 4 μm for the Pt/C, 27 ± 4 μm for the commercial FM, 18 ± 3 μm for the G-FMopen and 16 ± 2 μm for the G-FMclosed. For Pt/C, there was higher oxygen concentration as discussed above, which was beneficial to microorganism proliferation, and the thickness of bio-cake layer was the highest. The G-FMclosed had a minimum thickness compared to the G-FMopen and the FM, which was attributed to improved hydrophilicity and electrostatic repulsive forces.4. Conclusions
A conductive flat microfiltration membrane modified with RGO was prepared by the method of immersion-precipitation phase transformation. Equipped with a coupled configuration, the prepared G-FM functioned as a microfiltration membrane for MBR and a cathode for MFC, gaining the removal efficiency of 96.6% ± 3.9% for COD, 95.8% ± 5.7% for NH3–N and 94.7% ± 5.2% for TN and synchronously generating ∼221 mV cell voltage in the processing of synthetic municipal wastewater. Moreover, the membrane fouling was reduced due to enhanced hydrophilicity and electrostatic repulsive forces between the negatively charged bacteria (or sludge) and the electron-loading cathode.Acknowledgements
This study was supported by a grant from the National Key Research and Development Program (2016YFC0400707), the Major Science and Technology Program for Water Pollution Control and Treatment of China (No. 2015ZX07306001-5), the Jiangsu Science & Technology Pillar Program-Social Development (No. BE2014606), the “Six Major Talent Peaks” of Jiangsu Province (No. 2011-JNHB-004) and the Fundamental Research Funds for the Central Universities (JUSRP51512).References
- A. E. Franks and K. P. Nevin, Energies, 2010, 3, 899–919 CrossRef CAS.
- M. Zhou, T. Jin, Z. Wu, M. Chi and T. Gu, in Sustainable Bioenergy and Bioproducts, Springer, 2012, pp. 131–171 Search PubMed.
- E. T. Sayed, N. A. M. Barakat, M. A. Abdelkareem, H. Fouad and N. Nakagawa, Ind. Eng. Chem. Res., 2015, 54, 3116–3122 CrossRef CAS.
- K. P. Katuri, C. M. Werner, R. J. Jimenez-Sandoval, W. Chen, S. Jeon, B. E. Logan, Z. Lai, G. L. Amy and P. E. Saikaly, Environ. Sci. Technol., 2014, 48, 12833–12841 CrossRef CAS PubMed.
- L. Malaeb, K. P. Katuri, B. E. Logan, H. Maab, S. P. Nunes and P. E. Saikaly, Environ. Sci. Technol., 2013, 47, 11821–11828 CrossRef CAS PubMed.
- S. Judd, Trends Biotechnol., 2008, 26, 109–116 CrossRef CAS PubMed.
- Z. Wang, Z. Wu and S. Tang, Water Res., 2009, 43, 2504–2512 CrossRef CAS PubMed.
- S. J. Kim, S. Yang, G. K. Reddy, P. Smirniotis and J. Dong, Energy Fuels, 2013, 27, 4471–4480 CrossRef CAS.
- L. Ren, Y. Ahn and B. E. Logan, Environ. Sci. Technol., 2014, 48, 4199–4206 CrossRef CAS PubMed.
- Y. Tian, C. Ji, K. Wang and P. Le-Clech, J. Membr. Sci., 2014, 450, 242–248 CrossRef CAS.
- Y. Li, L. Liu, J. Liu, F. Yang and N. Ren, Desalination, 2014, 349, 94–101 CrossRef CAS.
- L. Liu, Z. Feng, J. Liu and F. Yang, J. Membr. Sci., 2013, 437, 99–107 CrossRef CAS.
- Y. Li, L. Liu, F. Yang and N. Ren, J. Membr. Sci., 2015, 484, 27–34 CrossRef CAS.
- Y. K. Wang, G. P. Sheng, W. W. Li, Y. X. Huang, Y. Y. Yu, R. J. Zeng and H. Q. Yu, Environ. Sci. Technol., 2011, 45, 9256–9261 CrossRef CAS PubMed.
- D. C. Marcano, D. V. Kosynkin, J. M. Berlin, A. Sinitskii, Z. Sun, A. Slesarev, L. B. Alemany, W. Lu and J. M. Tour, ACS Nano, 2010, 4, 4806–4814 CrossRef CAS PubMed.
- H. Liu and B. E. Logan, Environ. Sci. Technol., 2004, 38, 4040–4046 CrossRef CAS PubMed.
- S. Cheng, H. Liu and B. E. Logan, Electrochem. Commun., 2006, 8, 489–494 CrossRef CAS.
- H. Dong, H. Yu, X. Wang, Q. Zhou and J. Sun, J. Chem. Technol. Biotechnol., 2013, 88, 774–778 CrossRef CAS.
- H. Dong, H. Yu and X. Wang, Environ. Sci. Technol., 2012, 46, 13009–13015 CrossRef CAS PubMed.
- Y. Wang, B. Li, L. Zeng, D. Cui, X. Xiang and W. Li, Biosens. Bioelectron., 2013, 41, 582–588 CrossRef CAS PubMed.
- Z. He and F. Mansfeld, Energy Environ. Sci., 2008, 22, 1754–56921 Search PubMed.
- J. R. Kim, B. Min and B. E. Logan, Appl. Microbiol. Biotechnol., 2005, 68, 23–30 CrossRef CAS PubMed.
- B. Yuan, X. Wang, C. Tang, X. Li and G. Yu, Water Res., 2015, 75, 188–200 CrossRef CAS PubMed.
- C. Zhao, X. Xu, J. Chen, G. Wang and F. Yang, Desalination, 2014, 340, 59–66 CrossRef CAS.
- J. Huang, K. Zhang, K. Wang, Z. Xie, B. Ladewig and H. Wang, J. Membr. Sci., 2012, 423, 362–370 CrossRef.
- S. Darvishmanesh, F. Tasselli, J. C. Jansen, E. Tocci, F. Bazzarelli, P. Bernardo, P. Luis, J. Degrève, E. Drioli and B. Van der Bruggen, J. Membr. Sci., 2011, 384, 89–96 CrossRef CAS.
- J. A. Kharraz, M. Bilad and H. A. Arafat, J. Membr. Sci., 2015, 475, 91–100 CrossRef CAS.
- A. P. H. Association, A. W. W. Association, W. P. C. Federation and W. E. Federation, Standard methods for the examination of water and wastewater, American Public Health Association, 1915 Search PubMed.
- P. Aelterman, S. Freguia, J. Keller, W. Verstraete and K. Rabaey, Appl. Microbiol. Biotechnol., 2008, 78, 409–418 CrossRef CAS PubMed.
- D. J. Lin, C. L. Chang, F. M. Huang and L. P. Cheng, Polymer, 2003, 44, 413–422 CrossRef CAS.
- V. Vatanpour, S. S. Madaeni, L. Rajabi, S. Zinadini and A. A. Derakhshan, J. Membr. Sci., 2012, 401, 132–143 CrossRef.
- J.-F. Dai, G.-J. Wang and C.-K. Wu, Chromatographia, 2014, 77, 299–307 CAS.
- K. Fricke, F. Harnisch and U. Schroeder, Energy Environ. Sci., 2008, 1, 144–147 CAS.
- T. Springer and I. Raistrick, J. Electrochem. Soc., 1989, 136, 1594–1603 CrossRef CAS.
- Z. He and F. Mansfeld, Energy Environ. Sci., 2009, 2, 215–219 CAS.
- Y. K. Wang, W. W. Li, G. P. Sheng, B. J. Shi and H. Q. Yu, Water Res., 2013, 47, 5794–5800 CrossRef CAS PubMed.
- E. V. Münch, P. Lant and J. Keller, Water Res., 1996, 30, 277–284 CrossRef.
- B. Virdis, K. Rabaey, R. A. Rozendal, Z. Yuan and J. Keller, Water Res., 2010, 44, 2970–2980 CrossRef CAS PubMed.
- H. Yan, T. Saito and J. M. Regan, Water Res., 2012, 46, 2215–2224 CrossRef CAS PubMed.
- Z. He, J. Kan, Y. Wang, Y. Huang, F. Mansfeld and K. H. Nealson, Environ. Sci. Technol., 2009, 43, 3391–3397 CrossRef CAS PubMed.
- R. R. Sayess, P. E. Saikaly, M. El-Fadel, D. Li and L. Semerjian, Water Res., 2013, 47, 881–894 CrossRef CAS PubMed.
- L. Chu and S. Li, Sep. Purif. Technol., 2006, 51, 173–179 CrossRef CAS.
- H. Choi, K. Zhang, D. D. Dionysiou, D. B. Oerther and G. A. Sorial, Sep. Purif. Technol., 2005, 45, 68–78 CrossRef CAS.
- J. Huang, Z. Wang, J. Zhang, X. Zhang, J. Ma and Z. Wu, Sci. Rep., 2015, 5, 9268 CrossRef CAS PubMed.
Footnote |
| † Electronic supplementary information (ESI) available. See DOI: 10.1039/c7ra01014a |
| This journal is © The Royal Society of Chemistry 2017 |

