 Open Access Article
Creative Commons Attribution 3.0 Unported Licence
Preparation and characterization of novel alkali-resistant nanofiltration membranes with enhanced permeation and antifouling properties: the effects of functionalized graphene nanosheets†
Quanling Xie abe,
Shishen Zhangbc,
Zongyuan Xiaoc,
Xiangfeng Huc,
Zhuan Hongbe,
Ruizao Yibe,
Wenyao Shao*c and
Qiuquan Wang*ad
aDepartment of Chemistry, The MOE Key Laboratory of Spectrochemical Analysis and Instrumentation, College of Chemistry and Chemical Engineering, Xiamen University, Xiamen 361005, China. E-mail: qqwang@xmu.edu.cn
bEngineering Research Center of Marine Biological Resource Comprehensive Utilization, SOA, The Third Institute of Oceanography of the State Oceanic Administration, Xiamen 361005, China
cDepartment of Chemical and Biochemical Engineering, College of Chemistry and Chemical Engineering, Xiamen University, Xiamen 361005, China. E-mail: wyshao@xmu.edu.cn
dState Key Laboratory of Marine Environmental Science, Xiamen University, Xiamen, 361005, China
eFujian Collaborative Innovation Center for Exploitation and Utilization of Marine Biological Resources, Xiamen, 361005, China
First published on 29th March 2017
Abstract
In this study, novel alkali-resistant nanocomposite nanofiltration (NF) membranes were prepared via phase inversion by immersion precipitation combined with the addition of two kinds of functionalized graphene nanosheets. The effects of the functional groups and the concentrations of the graphene-based nanosheets on the microstructures and performances of nanocomposite membranes were systematically investigated. Compared with the pure polyethersulfone (PES) membrane, incorporation of a small amount of sulfonated graphene (SG) or graphene oxide (GO) into the PES matrix did not change the membrane morphology. However, the hydrophilicity, permeability and antifouling capabilities were remarkably enhanced without obvious reduction in membrane rejection. Particularly, the water fluxes of optimized PES–SG and PES–GO NF membranes at 0.1 wt% were improved by 119.7% and 71.3%, respectively. Moreover, the PES–SG series membranes exhibited better hydrophilicity and membrane separation performance than the PES–GO series membranes, which was attributed to the different ionisable functional groups from the SG and GO nanosheets. Both the optimized PES–SG and PES–GO NF membranes exhibited long-term stability during a seven-day test in alkaline solution, but PES–SG demonstrated greater promise as a novel alkali-resistant NF membrane due to its superior permeability and antifouling performance.
1 Introduction
Nanofiltration (NF) membranes have been widely utilized in water treatment, and pharmaceutical and chemical industries because of their outstanding selectivity, high flux and low operation pressure compared with reverse osmosis (RO) membranes.1 The majority of currently commercially available NF membranes are polyamide thin film composite membranes prepared by interfacial polymerization. However, their industrial applications have long been limited to the processes with moderate pH, because the polyamide NF membranes are only structurally stable within pH 2–11.2 In fact, membrane corrosion by alkaline solutions such as caustic soda constitutes a critical challenge to all polyamide NF membranes.Polyethersulfone (PES) is a popularly used membrane material due to its excellent chemical, thermal, and mechanical stability. However, the hydrophobic characteristic of the PES membrane often leads to severe membrane fouling in aqueous filtration processes, limiting the wider application of PES in membrane preparation. To overcome this challenge, numerous modification methods, including chemical grafting,3,4 surface modification5,6 and physical blending7–9 have been developed to improve the hydrophilicity of PES membrane. Among these methods, physical blending is considered as one of the most straightforward and efficient technique. Nanomaterial-incorporated membranes have attracted considerable research interest in light of its potential for overcoming the trade-off relationship between permeability and selectivity as well as reducing membrane fouling.10–15 Recently, graphene oxide (GO) as a unique two-dimensional nanomaterial is gaining much more interest because of its exceptional physical properties and chemical stability. Moreover, GO bears abundant oxygen-containing functional groups (carboxyl, hydroxyl and epoxy) on their basal plane and edge. The presence of such hydrophilic groups endows GO with good dispersibility in polar organic solvent or aqueous medium,16 which is crucial for its application in membrane material. When GO nanosheets are properly blended into a polymer matrix, the performance of the obtained GO-incorporated membranes is significantly improved in comparison with pristine membranes. A variety of applications of GO-incorporated membranes have been explored, including microfiltration (MF),17,18 ultrafiltration (UF),19–25 NF,26,27 gas separation and pervaporation. Zinadini et al.26 studied the effect of the GO content on the microstructures and performances of mixed matrix NF membranes. It was found that 0.5 wt% GO-incorporated PES NF membrane exhibited the optimal pore radius, porosity, water flux and antibiofouling properties. Ganesh et al. found that the salt rejection of GO-incorporated polysulfone NF membrane improved with the pH increase of the feed solution because of the dissociation of GO's ionisable groups.27 However, GO is actually amphiphilic with an edge-to-center distribution of hydrophilic and hydrophobic domains.28,29 Many researchers reported that the anchoring –SO3H group on the graphene surfaces is a promising method to yield a highly conducting and dispersible graphene in aqueous medium.30,31 Therefore, sulfonated graphene (SG) was widely employed to enhance the proton conductivity of proton exchange membrane.
To the best of our knowledge, the influences of hydrophilic groups such as –SO3H, –COOH and –OH from functionalized graphene on the performance of alkali-resistant NF membrane was not investigated. In this study, alkali-resistant NF membranes were prepared by incorporating different functionalized graphene-based nanosheets into PES matrix using the immersion precipitation phase inversion method. The roles of the functional groups of graphene-based nanosheets on the nanocomposite membrane microstructures, hydrophilicities and performance were systematically investigated.
2 Experimental
2.1 Materials
Graphite powder (<44 μm, Qingdao Huatai), sulphuric acid (95–98%, Sinopharm), potassium permanganate (≥99.5%, Sinopharm), hydrogen peroxide (30%, Guandong Guanghua), hydrochloric acid (36–38%, Sinopharm) and barium chloride 2-hydrate (≥99.5%, Xilong Chemical) were used for preparing GO. PES (Ultrason® E6020P) and PVP K30 were supplied by BASF. Sulfonated graphene (SG) nanosheets were provided by Graphene-Tech Company (Suzhou, China). N-Methyl-pyrrolidone (NMP), acetone and sodium sulfate were obtained from Sinopharm (Shanghai, China). Bovine serum albumin (BSA) was purchased from BBI life sciences. The azo dye, amaranth (Mw = 604 Da), was purchased from J&K (Beijing, China). Water purified by a Millipore system was used as the coagulation medium.2.2 Preparation of GO
GO was prepared using natural graphite powder through a modified Hummers method.17 3 g graphite powder was added into a concentrated H2SO4 solution (90 mL) with ultrasonic stirring at 10–15 °C. Over a period of 1.5 h, KMnSO4 (15 g) was slowly added into the above reaction system maintained in an ice bath. The mixture was then stirred for additional 30 min in the water bath with controlled temperature of 38–40 °C. Distilled water (210 mL) was then slowly added into the mixture before the system was transferred into 100 °C water bath for 10 min incubation. H2O2 solution was then added into the mixture until no bubble generation was observed. Water was periodically added into such mixture, followed by 10 h incubation. After the mixture was centrifuged at 500 rpm for 30 min, supernatant was removed from the system. The water addition, centrifugation and supernatant removal were repeated for 3 times. The resulting viscous and brown precipitate was treated with another centrifugation at 500 rpm to remove residuals. 0.5% HCl was used to wash the precipitate until no precipitations was observed in the upper solution with the addition of BaCl2. The mixture was then further washed with water until the pH was neutral. The final GO product was obtained by freeze drying.2.3 Preparation of nanocomposite membranes
The compositions of casting solutions are listed in Table S1.† PES and PVP K30 concentrations were fixed at 27.0 wt% and 1.0 wt%, respectively. The concentrations of SG and GO were varied from 0 wt% to 0.3 wt%. Firstly, a measured amount of SG or GO was added into the mixed solvent (NMP and acetone) under the ultrasound treatment for 1 h to obtain stable GO and SG suspension. Subsequently, PES and PVP were dissolved into the above suspension by constant stirring for 12 h. The resultant homogenous solution was degassed under vacuum at room temperature for 12 h. Finally, the degassed casting solution was cast on a non-woven fabric by a casting knife with 0.1 mm thickness. The nascent membranes were immediately immersed into the coagulation bath (pure water, 20 ± 1 °C). After primary membrane formation in the coagulation bath, the membranes were transferred to another pure water bath for 24 h to remove residual solvent. The obtained membranes were named as PES–x-SG or PES–x-GO, where x denoted the SG or GO concentration in the casting solutions.During the period of membrane preparation, the room temperature was maintained at 20 ± 1 °C and the relative humidity was controlled at 40–60%. The viscosities of the degassed casting solutions were measured using a viscometer (Brookfiled DV-2, USA) at 20 ± 1 °C.
2.4 Characterization of SG and GO
The functional groups of SG and GO nanosheets were analyzed by attenuated total reflectance-Fourier transform infrared spectroscopy (ATR-FTIR, Bruker VERTXE 70, Switzerland). Transmission electron microscopy (TEM) observation of SG and GO nanosheets was performed using FEI Tecnai F30 operated at 100 kV. The element composition was determined using an elemental analyzer (Vario EL cube, Germany). The X-ray diffraction (XRD) measurement of SG and GO nanosheets were carried out with an X-ray diffractometer with Cu Kα radiation (λ = 0.154 nm, D/max-rB 12 kW Rigaku) which was operated at 15 mA and 35 kV from 5° and 90° with a step increment rate of 10° min−1.2.5 Characterization of membranes
The membrane cross-sectional morphologies were investigated with scanning electron microscope (SEM, Zeiss Sigma, Germany) operated at 15 kV.An atomic force microscope (AFM, MI5500, Agilent, USA) in tapping mode was employed to analyze the morphology and roughness of the membrane surfaces. The membrane surfaces were imaged at a scan size of 2 μm × 2 μm.
The surface hydrophilicity was evaluated using a contact angle goniometer (Beijing HARKE SPCAX3, China). At least five contact angles between water droplet and the membrane surface were measured to minimize the experimental measurement error.
The membrane surface zeta potential was determined using SurPass Electrokinetic Analyser equipped with an adjustable cell (AntonPaar, GmbH, Austria) based on the streaming potential method. All analysis was carried out with 1 mM KCl back ground solution at 25 °C and the solution pH values were adjusted between 3.0 and 10.0 by automatic addition of 0.1 M HCl or 0.1 M KOH. The Fair brother and Mastin approach was applied to calculate the surface zeta potential of membrane.
The overall porosity (ε) was determined by gravimetric method, as defined in the following equation:32
 | (1) |
Based on the water flux and porosity, the membrane mean pore radius (rm) was determined using the following Guerout–Elford–Ferry equation:32
 | (2) |
2.6 Membrane separation performance
The permeate flux and salt rejection were evaluated with a lab-scale cross-flow filtration system. The tested membranes were pre-pressurized at 2.0 MPa for 30 min to achieve a steady flux, whereas the temperature was maintained at 20 °C throughout the whole experiment. The permeate flux was calculated using the following equation:
 | (3) |
A UV-vis spectrophotometer (SHIMADZU® UV-1700, Japan) and conductivity meter (SG3, METTLER TOLEDO) were used to measure the amaranth and salt concentration, respectively. The membrane solute rejection, R (%) can be determined using the following equation:
 | (4) |
The alkali resistance of the prepared membranes were evaluated by immersing membrane discs into 1 M NaOH solution. The water flux and salt rejection of alkali-treated membranes were then remeasured at different time intervals.
The antifouling performance were evaluated by measuring the flux recovery ratio (FRR). First, the stable flux (J0) for pure water was measured. Then 1 g L−1 BSA solution was used to replace pure water and recycled in the experimental system continuously for 60 min. After the BSA filtration, the fouled membranes were washed with the pure water for 20 min, and then the water flux of cleaned membranes (JR) was measured again. The FRR was calculated as follows:
 | (5) |
3 Results and discussion
3.1 Characterizations of GO and SG
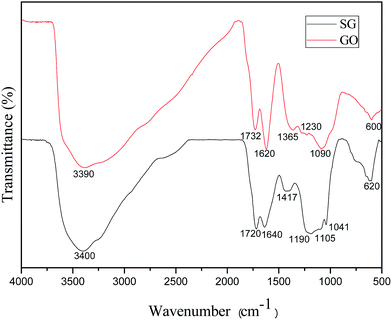
The presence of the functional groups in GO and SG were confirmed via FTIR (Fig. 1). The GO spectrum demonstrated several characteristic peaks which were attributed to carboxylic, hydroxyl and epoxide groups. The broad band at 3390 cm−1 and the peak at 1365 cm−1 corresponded to the stretching vibration and deformation vibration of O–H, the peak at 1732 cm−1 assigned to the C![[double bond, length as m-dash]](https://www.rsc.org/images/entities/char_e001.gif) O stretching vibration of carboxylic groups, and the peak at 1620 cm−1 was assigned to the vibrations of the adsorbed water molecules and the vibration of aromatic C
O stretching vibration of carboxylic groups, and the peak at 1620 cm−1 was assigned to the vibrations of the adsorbed water molecules and the vibration of aromatic C![[double bond, length as m-dash]](https://www.rsc.org/images/entities/char_e001.gif) C bonds. Two bands at 1090 cm−1 and 1230 cm−1 were due to the C–O stretching vibrations of alkoxy. The SG spectrum showed the characteristic peaks at 1190, 1105, and 1041 cm−1, which confirmed the presence of sulfonic acid group.
C bonds. Two bands at 1090 cm−1 and 1230 cm−1 were due to the C–O stretching vibrations of alkoxy. The SG spectrum showed the characteristic peaks at 1190, 1105, and 1041 cm−1, which confirmed the presence of sulfonic acid group.
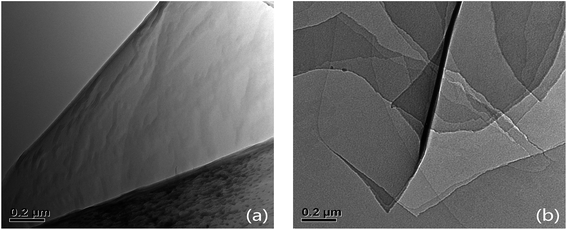
TEM images of GO and SG nanosheets were shown in Fig. 2. Fig. 2a shows the TEM image of GO nanosheets with a single layer. Fig. 2b shows the TEM image of SG nanosheets with multi-layers.
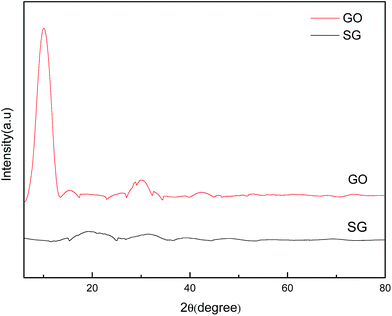
Fig. 3 shows the XRD patterns of GO and SG nanosheets. The feature diffraction peak at 2θ = 10.2° was attributed to the (002) plane of GO, which disappeared for SG nanosheets.33 It was reported that the diffraction peak would become weak or even vanish if the regular stacks of graphite oxide or graphite are destroyed by exfoliation.34 As such, when sulfonic acid groups were coated on the surface of graphene nanosheets in our study, the regular stacks were destroyed completely and thus the diffraction peak was not found. In addition, the results of elemental analysis (Table S2†) indicated that SG nanosheets were loaded with 2.86 mmol g−1 of –SO3H according to the sulfur percentage (9.14 wt%).
3.2 Surface hydrophilicity of membranes
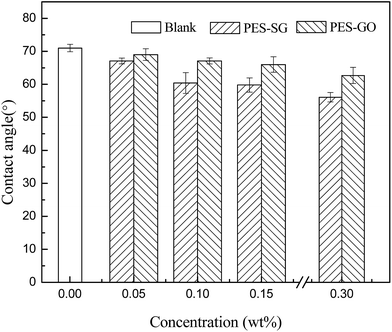
Lower water contact angle indicates the membrane surface has more hydrophilicity and better antifouling property. As shown in Fig. 4, the pure PES membrane had the highest water contact angle of 71.0°, but the contact angles significantly reduced to 56.1° and 62.7° for PES–0.30-SG and PES–0.30-GO, respectively. The water contact angles of both PES–SG and PES–GO series membranes gradually declined with increasing SG and GO concentrations. These results suggested that the nanocomposite membranes became more hydrophilic with higher SG and GO loading. It was well understood that the enhancement of membrane surface hydrophilicity results from the hydrophilic polar groups of SG (sulfonic acid group) and GO (carboxyl, hydroxyl, and epoxy groups). The hydrophilic functional graphene-based nanosheets in the casting solution migrated spontaneously to the membrane/water interface to reduce the interface energy during the phase inversion process.26,35,36 As a result, hydrophilic graphene-based nanosheets preferred to gather on the surface of nanocomposite membranes, which was confirmed by Zinadini et al. that the top surface of the membrane was darker than the bottom-side.26 In this study, the non-woven fabric was adopted to increase the membrane mechanical strength, therefore, the color of bottom layer could not be observed directly. But it was obvious that the membrane top surfaces became darker with increasing SG and GO concentration (Fig. S1†). This indicated that more SG and GO were incorporated into the PES matrix, which led to the enhancement of membrane hydrophilicity.As shown in Fig. 4, it was notable that PES–SG series membranes possessed considerably lower water contact angles than PES–GO series membranes. This indicates that PES–SG series membranes were more hydrophilic than PES–GO series membranes, which could be explained by two primary factors. First, the anchored –SO3H group in SG is a stronger H-bonding group compared to –COOH/–OH groups present in GO and it may strongly interact with H2O through H-bond formation with the –OH group of H2O. The strong nature of H-bonding interaction may yield the lower water contact angle. Second, the casting solutions of PES–SG had the lower viscosities than those of PES–GO (Fig. S2†), which consequently resulted in more SG nanosheets immigration to the membrane top surface and enhanced membrane hydrophilicity.
3.3 Morphologies of membranes
As illustrated in Fig. S3 and S4,† both the pure PES membrane and the nanocomposite membranes showed the typically asymmetric structure consisting of a dense skin top-layer and a finger-like porous sub-layer. In this study, a small amount of SG and GO nanosheets incorporated into the casting solutions had no obvious influence on the membrane morphology, which suggested that the main mechanism of membrane-structure formation for the nanocomposite membranes did not change during the process of immersion precipitation phase inversion.The surface AFM images of PES–SG and PES–GO series membranes were presented in Fig. 5 and 6, respectively. The roughness of nanocomposite membranes exhibited a decline trend with incorporating higher loading of functional graphenes. In comparison with the pure PES membrane, the PES–SG and PES–GO series membranes exhibited lower roughness and contact angles (Table 1). It is widely accepted that the membrane surface with high hydrophilicity and low roughness possess better membrane fouling resistance. Therefore, our results suggest that PES–SG and PES–GO series membranes should have the better antifouling property than the pure PES membrane.
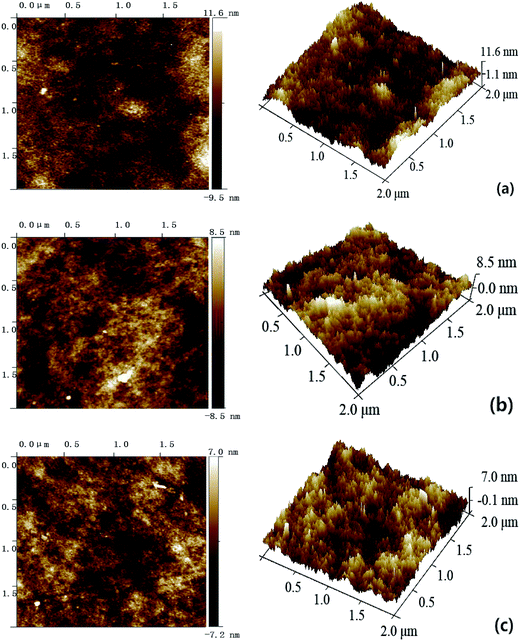 | ||
| Fig. 5 Surface AFM images of PES–SG membranes with different SG concentrations: (a) 0 wt%, (b) 0.1 wt% (c) 0.3 wt%. | ||
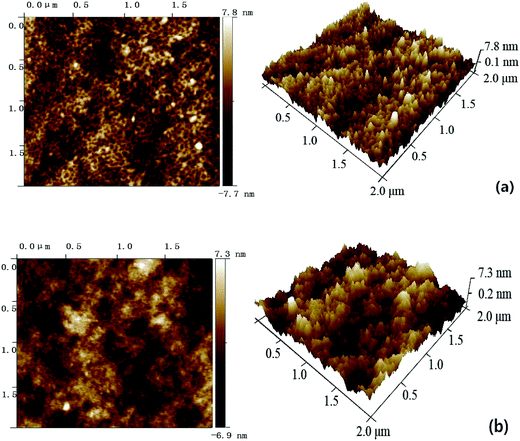 | ||
| Fig. 6 Surface AFM images of PES–GO membranes with different GO concentrations: (a) 0.1 wt%, (b) 0.3 wt%. | ||
| Membrane | Roughness | Contact angles (°) | ||
|---|---|---|---|---|
| Ra (nm) | Rq (nm) | Rz (nm) | ||
| Blank | 2.4 ± 0.2 | 3.2 ± 0.3 | 2.3 ± 0.1 | 71.0 ± 1.1 |
| PES–0.10-SG | 2.0 ± 0.1 | 2.7 ± 0.3 | 1.6 ± 0.1 | 60.4 ± 3.1 |
| PES–0.30-SG | 1.7 ± 0.1 | 2.2 ± 0.1 | 1.5 ± 0.2 | 56.1 ± 1.4 |
| PES–0.10-GO | 1.8 ± 0.1 | 2.4 ± 0.3 | 2.3 ± 0.1 | 67.1 ± 0.9 |
| PES–0.30-GO | 1.7 ± 0.1 | 2.2 ± 0.2 | 1.4 ± 0.2 | 62.7 ± 2.5 |
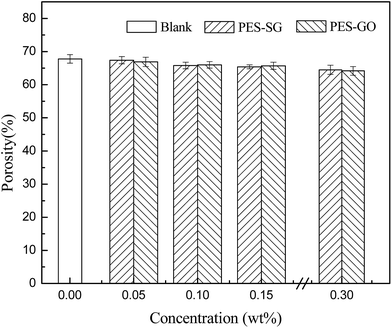
As shown in Fig. 7, the membrane porosity showed a very slight decrease with increasing SG and GO concentration. The viscosity of the casting solutions increased with the addition of SG and GO nanosheets, which delayed the phase separation and resulted in lower porosity.
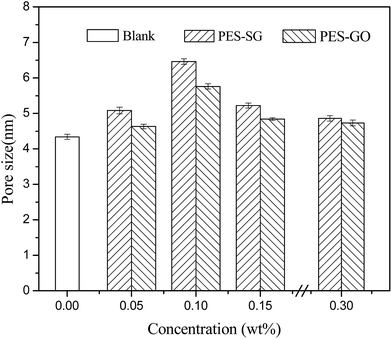
Fig. 8 shows the effects of SG and GO concentration on the surface mean pore sizes. The surface mean pore sizes were enlarged with increasing SG or GO concentration, and reached the maximal value at 0.1 wt%. It was observed that the PES–SG series membranes possessed the larger surface pore sizes than the PES–GO series membranes. These results could be well explained by the influence of functionalized graphene nanosheets on the thermodynamics of casting solutions and the kinetics during the immersion precipitation phase inversion process. From the perspective of thermodynamics, the introduction of SG and GO nanosheets enhanced the thermodynamic instability of casting solutions and increased the demixing rates. As a result, the pores formed by the fractured points became larger due to the higher rate of the polymer solution solidification.22,37 From the perspective of kinetics, the exchange of solvent and non-solvent during the phase inversion process was affected by the hydrophilicity and viscosity. When the SG and GO concentrations were below 0.1 wt%, the increase of viscosity was not obvious. However, the exchange of solvent and non-solvent was accelerated because of the introduction of hydrophilic SG and GO nanosheets, which led to the formation of larger pores.26,35 However, the increase of viscosity became dominating while SG and GO concentration over 0.1 wt%. At this point, resultant delayed demixing allows for creep relaxation that relieved the stresses, and induced the formation of smaller pores. The surface pore sizes were ranked as blank < 0.30 wt% < 0.05 wt% < 0.15 wt% < 0.10 wt%.
3.4 Water permeability and salt rejection
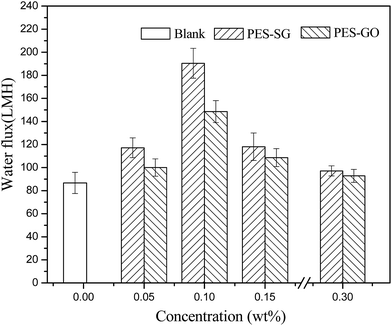
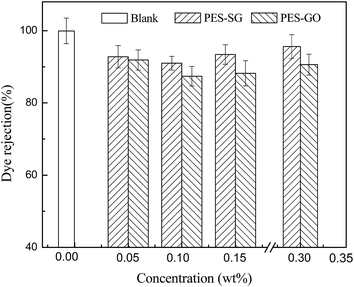
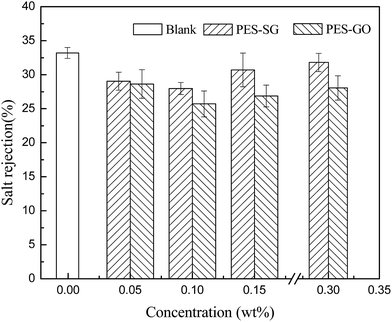
Membrane permeability is closely associated with many membrane properties such as membrane hydrophilicity, porosity, surface pore size and roughness. In this study, the porosity of nanocomposite membranes showed a slight decrease compared to the pure PES membrane, which correspondingly led to the decrease of water flux. However, both the hydrophilicity and surface pore size of nanocomposite membranes were enlarged with addition of SG and GO nanosheets, which also contributed to an increase of water flux. As shown in Fig. 9, the pure water fluxes of both PES–SG and the PES–GO series membranes increased significantly after incorporating a small amount of SG and GO nanosheets. The highest water flux was achieved at 0.1 wt% SG and GO. The water fluxes of PES–0.10-SG and PES–0.10-GO reached 190.5 L m−2 h and 148.6 L m−2 h, respectively, which corresponded to 219.7% and 171.3% of the pure PES membrane. The order of water flux matched quite well with the order of surface pore sizes. Nevertheless, the increase of the maximal water flux was remarkably higher than that of the largest surface pore size. Besides the enlarged pore size, PES–0.10-SG and PES–0.10-GO were more hydrophilic and smoother in comparison with the pure PES membrane, which promoted an overall faster flow of water molecules on their hydrophilic membrane surfaces with less friction. Notably, when SG or GO concentrations in the casting solutions were over 0.1 wt%, further increase of SG or GO concentrations led to a significant decrease in the water flux, which mainly resulted from a reduction of membrane surface pore size. The PES–SG series membranes demonstrated higher water flux than the PES–GO series membranes, mainly due to the larger surface pore sizes and the stronger hydrophilicities of the PES–SG series membranes.As shown in Fig. 10 and 11, both the dye and salt rejection first decreased with the SG and GO concentration increase, and then increased when SG and GO concentrations were over 0.1 wt%. The order of membrane rejections were blank > 0.30 wt% > 0.15 wt% > 0.05 wt% > 0.10 wt% for PES–SG series membranes and blank > 0.05 wt% > 0.30 wt% > 0.15 wt% > 0.10 wt% for PES–GO series membranes. Such orders did not match with the order of surface pore size. In comparison with the pure PES membrane, the salt rejection only dropped 15.7% for PES–0.10-SG and 22.6% for PES–0.10-GO, respectively, although the surface pore size was enlarged by 48.8% for PES–0.10-SG and 32.7% for PES–0.10-GO. Moreover, PES–SG series membranes showed higher rejection than PES–GO series membranes although PES–SG series membranes had larger surface pore size.
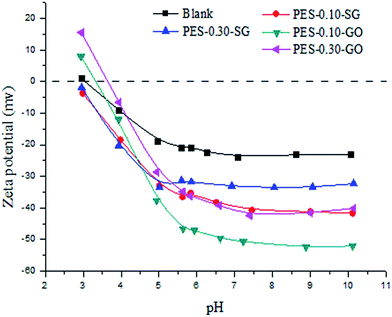
Besides the steric hindrance effect, surface charges also play a crucial role in a NF process according to the Donnan and dielectric effects for rejecting charged solutes.38 The zeta potentials of membrane surfaces at various pH values are shown in Fig. 12. The studied membrane surface showed negative zeta potential values when the pH value was greater than the isoelectric point (IEP). The pure PES NF membrane without fixed ionizable groups is negatively charged because of the anions (chloride and hydroxide) adsorption to hydrophobic PES surfaces. In contrast to pure PES membrane, the negative zeta potentials of nanocomposite membranes increased dramatically when pH value greater than 5, which attributed to the dissociation of the ionizable groups such as –SO3H group from SG and –COOH from GO. In this study, the rejections were measured at pH of 7.0, and the zeta potentials of PES–0.10-SG and PES–0.10-GO were −40.8 mV and −50.7 mV at this pH, which would greatly be in favor of the anion removals due to strong Donnan effect.
Once pH went beyond a specific value, PES–GO series membranes carried more negatively charged than PES–SG series membranes. This may be two reasons: (1) the amphiphilic GO has the stronger anions adsorption than super hydrophilic SG; (2) more oxygenated groups such as epoxide and hydroxyl dissociated from GO were generated as the pH value increased. Under the neutral pH condition, the order of zeta potentials for the nanocomposite membrane surfaces agreed well with those of functional graphene nanosheets (Fig. S5†). Compared to the zeta potentials at 0.30 wt%, both the functional graphenes and their membrane surfaces showed the large negative zeta potentials at 0.10 wt%. It was speculated that the dissociations of ionisable groups were hampered by the aggregation or stacking structure of functional graphenes at the high concentration, but the mechanism is still unclear and will be studied in our next work.
3.5 Antifouling performance
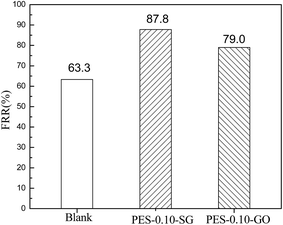
The antifouling performance of the pure PES membrane and the optimal nanocomposite membranes were evaluated based on FRR. It is widely accepted that higher value of FRR indicates better antifouling property of the membrane. As shown in Fig. 13, the FRR value of the pure PES membrane was 63.3%, but FRR values dramatically increased to 87.8% and 79.0% for PES–0.10-SG and PES–0.10-GO, respectively. Therefore, both PES–0.10-SG and PES–0.10-GO demonstrated the superior antifouling properties compared with the pure PES membrane. This result was explained as (1) the enhanced hydrophilicities of PES–0.10-SG and PES–0.10-GO could promote to adsorb water molecule and form a water layer, which prevented the adsorption of BSA; (2) PES–0.10-SG and PES–0.10-GO had more negatively charged surface compared with the pure PES membrane, which decreased the interactions between the membrane surface and BSA due to the charge repulsion effect. Furthermore, PES–0.10-SG showed better antifouling performance than PES–0.10-GO. As indicated above, PES–0.10-GO exhibited more negatively charged than PES–0.10-SG, but PES–0.10-SG was more hydrophilic than PES–0.10-GO. This implies that in comparison with surface negativity, membrane hydrophilicity played a crucial role in improving the antifouling performance.3.6 Alkali resistances
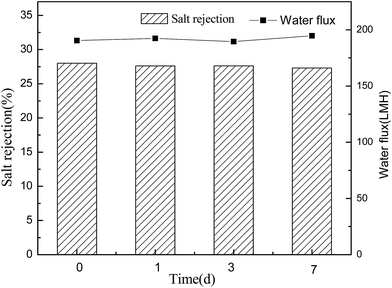
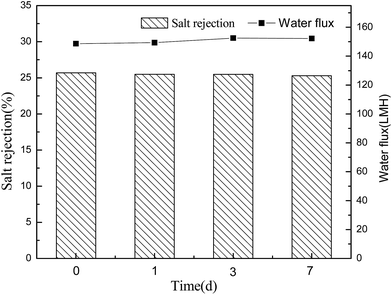
Conventional polyamide NF membranes usually have limited chemical resistance. Currently, only a few commercially available NF membranes including PES-based membranes can tolerate harsh caustic conditions.2 In this study, the alkali resistance of the optimal PES-based nanocomposite membrane was evaluated by analyzing the stabilities of salt rejection and water flux in alkaline environment. According to Fig. 14 and 15, both PES–0.10-SG and PES–0.10-GO showed stable salt rejection and the water flux even after immersing in 1 M NaOH solution for 7 days. This finding suggests that both PES–0.10-SG and PES–0.10-GO can be used as the alkali-resistant NF membrane with the enhanced performance. Particularly, PES–0.10-SG exhibited more promising application prospect in the treatment of alkaline solutions because of its superior permeability and antifouling performance.4 Conclusions
Two types of functionalized graphene nanosheets (SG and GO) were employed as nanofillers to improve the performance of PES NF membrane. The influence of the functional groups and the concentration of the graphene-based nanosheets on the microstructures and performance of nanocomposite membranes were in-depth studied. Compared with the pure PES membrane, the addition of a small amount of SG and GO into the casting solutions did not change the membrane morphology, but the hydrophilicity, water permeability and antifouling capability were remarkably enhanced without obvious reduction in the membrane rejection at the same time. The optimum concentration of SG or GO nanosheets for NF membranes was determined to be 0.1 wt%. Moreover, PES–SG series membranes exhibited superior hydrophilicity, water permeability, membrane rejection and antifouling capability than the PES–GO series membranes, which resulted from the different ionisable functional groups on the SG and GO nanosheets. Furthermore, both PES–0.10-SG and PES–0.10-GO demonstrated the long-term stability in alkaline environments, and PES–0.10-SG showed more promising application prospect as a novel alkali-resistant NF membrane due to its superior permeability and antifouling performance.Acknowledgements
We thank the financial supports from the Science & Technology Planning Project of Fujian Province (No. 2014H0027), the Scientific Research Foundation of Third Institute of Oceanography, SOA. (No. 2013015, No. 2016036), the National Natural Science Foundation of China (21535007), the National Basic Research 973 Program of China (2014CB932004) and Xiamen Ocean Research and Development Institute.References
- A. W. Mohammad, Y. H. Teow, W. L. Ang, Y. T. Chung, D. L. Oatley-Radcliffe and N. Hilal, Desalination, 2015, 356, 226–254 CrossRef CAS.
- R. Schlesinger, G. Gotzinger, H. Sixta, A. Friedl and M. Harasek, Desalination, 2006, 192, 303–314 CrossRef CAS.
- P. D. Peeva, T. Pieper and M. Ulbricht, J. Membr. Sci., 2010, 362, 560–568 CrossRef CAS.
- B. H. Fang, Q. Y. Ling, W. F. Zhao, Y. L. Ma, P. L. Bai, Q. Wei, H. F. Li and C. S. Zhao, J. Membr. Sci., 2009, 329, 46–55 CrossRef CAS.
- N. Bolong, A. F. Ismail, M. R. Salim, D. Rana and T. Matsuura, J. Membr. Sci., 2009, 331, 40–49 CrossRef CAS.
- L. J. Mu and W. Z. Zhao, Appl. Surf. Sci., 2009, 255, 7273–7278 CrossRef CAS.
- Y. A. Liu, Y. L. Su, X. T. Zhao, Y. F. Li, R. N. Zhang and Z. Y. Jiang, J. Membr. Sci., 2015, 486, 195–206 CrossRef CAS.
- W. F. Zhao, J. Y. Huang, B. H. Fang, S. Q. Nie, N. Yi, B. H. Su, H. F. Li and C. S. Zhao, J. Membr. Sci., 2011, 369, 258–266 CrossRef CAS.
- Y. Q. Wang, Y. L. Su, Q. Sun, X. L. Ma and Z. Y. Jiang, J. Membr. Sci., 2006, 286, 228–236 CrossRef CAS.
- J. Yin and B. L. Deng, J. Membr. Sci., 2015, 479, 256–275 CrossRef CAS.
- S. Daer, J. Kharraz, A. Giwa and S. W. Hasan, Desalination, 2015, 367, 37–48 CrossRef CAS.
- H. Dong, L. Zhang, H. L. Chen and C. J. Gao, Progr. Chem., 2014, 26, 2007–2018 CAS.
- H. M. Hegab and L. D. Zou, J. Membr. Sci., 2015, 484, 95–106 CrossRef CAS.
- R. Y. Li, L. B. Zhang and P. Wang, Nanoscale, 2015, 7, 17167–17194 RSC.
- H. B. Huang, Y. L. Ying and X. S. Peng, J. Mater. Chem. A, 2014, 2, 13772–13782 CAS.
- J. I. Paredes, S. Villar-Rodil, A. Martinez-Alonso and J. M. Tascon, Langmuir, 2008, 24, 10560–10564 CrossRef CAS PubMed.
- C. Q. Zhao, X. C. Xu, J. Chen and F. L. Yang, Desalination, 2014, 334, 17–22 CrossRef CAS.
- C. Q. Zhao, X. C. Xu, J. Chen, G. W. Wang and F. L. Yang, Desalination, 2014, 340, 59–66 CrossRef CAS.
- Z. H. Wang, H. R. Yu, J. F. Xia, F. F. Zhang, F. Li, Y. Z. Xia and Y. H. Li, Desalination, 2012, 299, 50–54 CrossRef CAS.
- X. J. Chang, Z. X. Wang, S. Quan, Y. C. Xu, Z. X. Jiang and L. Shao, Appl. Surf. Sci., 2014, 316, 537–548 CrossRef CAS.
- T. F. Wu, B. M. Zhou, T. Zhu, J. Shi, Z. W. Xu, C. S. Hu and J. J. Wang, RSC Adv., 2015, 5, 7880–7889 RSC.
- J. Lee, H. R. Chae, Y. J. Won, K. Lee, C. H. Lee, H. H. Lee, I. C. Kim and J. M. Lee, J. Membr. Sci., 2013, 448, 223–230 CrossRef CAS.
- S. J. Xia and M. Z. Ni, J. Membr. Sci., 2015, 473, 54–62 CrossRef CAS.
- J. G. Zhang, Z. W. Xu, W. Mai, C. Y. Min, B. M. Zhou, M. J. Shan, Y. L. Li, C. Y. Yang, Z. Wang and X. M. Qian, J. Mater. Chem. A, 2013, 1, 3101–3111 CAS.
- Y. F. Zhao, Z. W. Xu, M. J. Shan, C. Y. Min, B. M. Zhou, Y. L. Li, B. D. Li, L. S. Liu and X. M. Qian, Sep. Purif. Technol., 2013, 103, 78–83 CrossRef CAS.
- S. Zinadini, A. A. Zinatizadeh, M. Rahimi, V. Vatanpour and H. Zangeneh, J. Membr. Sci., 2014, 453, 292–301 CrossRef CAS.
- B. M. Ganesh, A. M. Isloor and A. F. Ismail, Desalination, 2013, 313, 199–207 CrossRef CAS.
- F. Kim, L. J. Cote and J. Huang, Adv. Mater., 2010, 22, 1954–1958 CrossRef CAS PubMed.
- L. J. Cote, J. Kim, V. C. Tung, J. Y. Luo, F. Kim and J. X. Huang, Pure Appl. Chem., 2011, 83, 95–110 CAS.
- R. K. Layek, S. Samanta and A. K. Nandi, Carbon, 2012, 50, 815–827 CrossRef CAS.
- Y. H. Liu, J. T. Wang, H. Q. Zhang, C. M. Ma, J. D. Liu, S. K. Cao and X. Zhang, J. Power Sources, 2014, 269, 898–911 CrossRef CAS.
- M. Safarpour, A. Khataee and V. Vatanpour, Sep. Purif. Technol., 2015, 140, 32–42 CrossRef CAS.
- H. Q. Wu, B. B. Tang and P. Y. Wu, J. Membr. Sci., 2014, 451, 94–102 CrossRef CAS.
- C. Xu, X. D. Wu, J. W. Zhu and X. Wang, Carbon, 2008, 46, 386–389 CrossRef CAS.
- V. Vatanpour, S. S. Madaeni, R. Moradian, S. Zinadini and B. Astinchap, J. Membr. Sci., 2011, 375, 284–294 CrossRef CAS.
- M. P. Sun, Y. L. Su, C. X. Mu and Z. Y. Jiang, Ind. Eng. Chem. Res., 2010, 49, 790–796 CrossRef CAS.
- V. Vatanpour, S. S. Madaeni, L. Rajabi, S. Zinadini and A. A. Derakhshan, J. Membr. Sci., 2012, 401–402, 132–143 CrossRef CAS.
- Y. Lv, H.-C. Yang, H.-Q. Liang, L.-S. Wan and Z.-K. Xu, J. Membr. Sci., 2015, 476, 50–58 CrossRef CAS.
Footnote |
| † Electronic supplementary information (ESI) available. See DOI: 10.1039/c7ra00928c |
| This journal is © The Royal Society of Chemistry 2017 |

![[thin space (1/6-em)]](https://www.rsc.org/images/entities/char_2009.gif) 000×).
000×).