DOI:
10.1039/C6RA28063C
(Paper)
RSC Adv., 2017,
7, 18765-18774
Preparation and characterization of surface molecularly imprinted films coated on multiwall carbon nanotubes for recognition and separation of lysozyme with high binding capacity and selectivity†
Received
12th December 2016
, Accepted 21st March 2017
First published on 27th March 2017
Abstract
In this work, a series of facile and efficient molecularly imprinted polymers (MIPs) for the selective recognition and separation of lysozyme were synthesized by combining self-polymerization and nanosized matrix. The imprinted materials containing recognition sites for the lysozyme were formed via using both carboxyl-functionalized multi-walled carbon nanotubes (MWCNTs-COOH) as a support and dopamine (DA) with excellent biocompatibility as a functional monomer. The obtained polymers were characterized and evaluated by using field-emission scanning electron microscopy (FESEM), field-emission transmission electron microscopy (FETEM), nitrogen physisorption experiments, Fourier transform infrared (FT-IR) spectroscopy and thermogravimetric analysis (TGA). The optimum reaction conditions and adsorption performance of the resultant nanomaterials were also investigated. MIPs synthesized by this method exhibited excellent imprinting factor (4.1) and high binding capacity (418 mg g−1) for lysozyme. After six adsorption–desorption cycles, the adsorption capacity of the MIPs was only reduced by 7.4%. In addition, the prepared MIPs were used to separate and condense lysozyme from chicken egg white successfully, which showed potential values in industrial protein purification, basic biomedical research and clinical diagnostics.
1. Introduction
Lysozyme (N-acetylmuramide glycanohydrolase) is a natural self-defense enzyme present in a wide variety of locations, including egg white, tears, serum and many organs of vertebrates. It can specifically hydrolyze the mucopolysaccharides in bacterial cell walls without any toxicity to human beings. Lysozyme has been used as a harmless antibacterial agent in food chemistry and a drug for treatment of infections, ulcers and cancers, since it has antiviral and anti-inflammatory activities.1,2 Commercially purified lysozyme could be obtained through various complex and time consuming processes, such as ultrafiltration, precipitation, ion exchange and chromatographic separation.3–5 However, the wide applications of these methods are limited by time-consuming processes, low binding efficiency and expensive equipment. Therefore, the design of more efficient, specific and economical strategies has attracted increasing research interest in lysozyme separation and purification from a complex matrix.
Molecular imprinting is considered as a relatively modern technique for the separation and analysis of specific compound in complex matrix. For this purpose, specific binding sites, known as synthetic receptors, are created on the surface of polymer network. It involves the polymerization of functional monomer and cross-linker in the presence of desired template and the subsequent removal of the template from the resulting polymers.6,7 Molecularly imprinted polymers (MIPs) have attracted great interest in terms of its applications in separation processes (chromatography, solid phase extraction, membrane separations), medical diagnostics, environmental monitoring and drug release/delivery.8–10 Advantages of using MIPs include easy preparation, low cost, predictable specific recognition, high specificity and high mechanical/chemical stability.11,12 Although the imprinting of small molecules has been well established and some have been developed to an industrial scale,13 high-molecular-weight protein imprinting still faces many challenges. The major difficulties include (a) the insolubility of proteins in commonly utilized imprinting solvents; (b) restricted mobility due to large molecular size and structural complexity; (c) the degradation of proteins under polymerization conditions such as high temperature.14–16 Diverse approaches have been proposed to solve these difficulties, such as moderately cross-linked hydrogels, metal coordination, microcontact imprinting, epitope imprinting and surface imprinting.15–23 Among the above methods, surface imprinting with the recognition cavities located on the surface of support materials has received more attention.
Surface imprinting method, which distributes the binding sites on the substrate surface, is considered to be an efficient way to overcome the restricted mass transfer and increase the binding affinity of the template.24 Among the various nanosized substrates, multiwalled carbon nanotubes (MWCNTs), ever since their discovery, have formed a part of extensive and multidisciplinary research due to their superior properties and wide range of applications over other materials. The unique properties of MWCNTs include, a high tensile strength (which can be 100 times more than that of stainless steel), good biocompatibility, good chemical stability and practical ability to establish different types of interactions with both organic and inorganic analytes. Moreover, MWCNTs have nm-sized diameters and μm-sized lengths, so they have around 1000 of the length-to-diameter ratio, resulting in large surface area and high absorption capacity. These properties determine that carbon nanotubes could be used as a good support material in separation science. When MWCNTs are used as MIPs supporting material, the binding sites of imprinting materials located in the outer layer of the composite. This fact is clearly opposed to that of traditional MIPs where the generated cavities could not be in the surface or partly embedded in the imprinting layer.25–27 Thus, the imprinting nano-structured materials can provide better site accessibility, well-defined shape, lower mass transfer resistance, and more complete removal of templates than traditional methods so that the high binding capacity and fast binding kinetics can be expected.28,29 In order to improve the weak interfacial adhesion, several functional groups (i.e., amino or vinyl group) were introduced to the surface of carbon nanotubes by covalent bonding to provide strong interfacial interactions between MWCNTs and MIPs.30–32 These polymerizations often involve multiple reaction steps under harsh conditions, which are inappropriate for the imprinting of biological molecules. Therefore, a simple and efficient chitosan (CS) modification strategy was used to improve the dispersion stability of MWCNTs and to increase the number of adsorption sites on MWCNTs for target protein. Moreover, a green and simple functional monomer was proposed to synthesize molecularly imprinted polymers. It is well known that dopamine (DA) with multifunctional groups shows excellent film-forming ability onto different kinds of materials in weak base solution at room temperature.33,34 Considering the solubility and complicacy of protein, dopamine (DA) was used as functional monomer and crossing linker to form imprinted shell on the surface of MWCNTs in this work.
Combining the advantages of MWCNTs and DA, we demonstrate a rather facile and effective strategy to imprint protein through self-polymerization and nanotechnology. The imprinted nanomaterial was obtained just by mixing MWCNTs, dopamine and template protein in weak alkaline aqueous solution. The preparation procedures were much simpler, and the whole process was highly suitable for the concept of “Green Chemistry”. Field emission scanning electron microscopy (FESEM), field-emission transmission electron microscopy (FETEM), Fourier transform infrared (FT-IR) spectroscopy and thermogravimetric analysis (TGA) were used to characterize the desired products. The adsorption properties of the prepared polymers were investigated by isothermal rebinding, dynamic adsorption and selectivity experiment. In addition, the practicability for biological application was further assessed by separation and enrichment of lysozyme from chicken egg white. Considering to the advantages of the proposed imprinting polymers, such as high selectivity, excellent biocompatibility, good practicability and especially simple operation processes, it could potentially broaden the applicability of imprinting technique to the enrichment and purification of protein in real samples.
2. Experimental
2.1 Materials and reagents
Carboxyl-functionalized multi-walled carbon nanotubes (outer diameter 20–30 nm, –COOH content 2.00 wt%) was purchased from Beijing DK Nano Technology Co., Ltd. (China). Dopamine hydrochloride was obtained from J&K Scientific Ltd. (China). Chitosan (CS) with 90% degree of deacetylation (MW = 600![[thin space (1/6-em)]](https://www.rsc.org/images/entities/char_2009.gif) 000 g mol−1) were purchased from Sinopharm Chemical Reagent Co., Ltd. Bovine serum albumin (BSA), human serum albumin (HSA) and pepsin were obtained from Sigma-Aldrich. Lysozyme (Lyz) and bromelain (BR) were purchased from J&K Scientific Ltd. (China). Absolute acetic acid (99%), N,N,N′,N′-tetramethylethylenediamine (TEMED), sodium dodecyl sulfate (SDS) and other chemicals were purchased from Sinopharm Chemical Reagent Co., Ltd. All other chemicals were of analytical reagent grade and provided by local suppliers.
000 g mol−1) were purchased from Sinopharm Chemical Reagent Co., Ltd. Bovine serum albumin (BSA), human serum albumin (HSA) and pepsin were obtained from Sigma-Aldrich. Lysozyme (Lyz) and bromelain (BR) were purchased from J&K Scientific Ltd. (China). Absolute acetic acid (99%), N,N,N′,N′-tetramethylethylenediamine (TEMED), sodium dodecyl sulfate (SDS) and other chemicals were purchased from Sinopharm Chemical Reagent Co., Ltd. All other chemicals were of analytical reagent grade and provided by local suppliers.
2.2 Preparation of Lyz-MIPs and NIPs
The general scheme for the synthesis of imprinting polymers for lysozyme (Lyz-MIPs) is shown in Fig. 1. The chitosan-wrapped carboxyl-functionalized multi-walled carbon nanotubes (MWCNT-COOH@CS) were prepared as follows: MWCNTs-COOH (300 mg) was dispersed in 40 mL of water and sonicated for 12 h to obtain a uniform dispersion of MWCNTs-COOH solution. Then, 30 mL of 1% HAc solution containing 0.04 g of chitosan (CS) was slowly added dropwisely into the suspension with constant mechanical stirring at room temperature. The reaction mixture was stirred for further 4 h at 40 °C, after that, the suspension was separated by centrifugation and washed 3 times using deionized water. The resulting powder was dried under vacuum at 60 °C for 12 h. The Lyz-MIPs was prepared as follows: MWCNT-COOH@CS (0.1 g) was dispersed in 10 mL of Tris–HCl buffer (pH 8.5, 50 mM) by stirring for 30 min. Then Lyz (35 mg) was added with consecutive stirring for 3 h to obtain the pre-assembled solution. After adding 0.06 g of DA, the mixed solution was stirred for another 12 h at 30 °C. The resulting products were washed with SDS-HAc (2%) to remove the embedded template protein until no adsorption was detected by UV-Vis spectrophotometer at 280 nm. The obtained Lyz-MIPs were centrifuged and washed with ultra pure water until the pH was shown to be neutral, and then dried under vacuum at 60 °C for 24 h. For comparison, non-imprinted nanomaterials (denoted as NIPs) were prepared following the same procedure in the absence of the template protein Lyz.
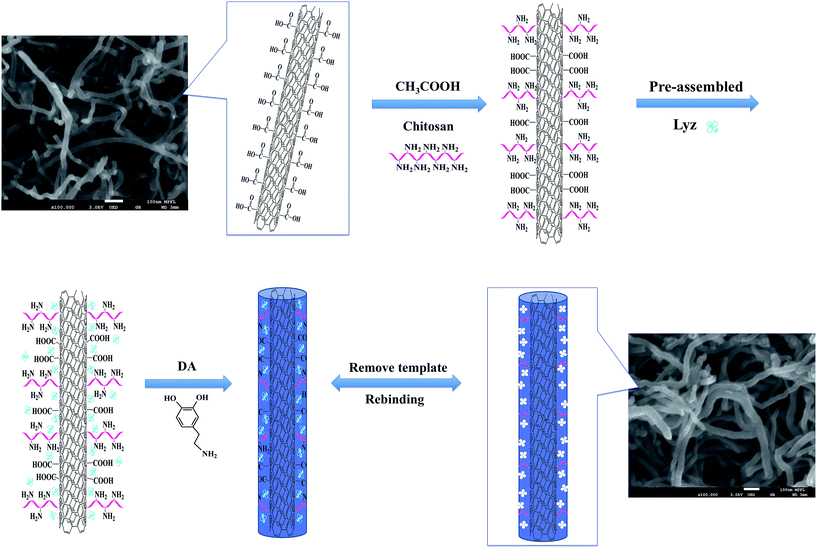 |
| | Fig. 1 Schematic of the synthetic route used to prepare Lyz-MIPs. | |
2.3 Characterization
The morphologies of the Lyz-MIPs and NIPs were observed by a G2F30 300 kV field-emission transmission electron microscopy (FETEM) (FEI, USA) and a JEOL 7800F field emission scanning electron microscopy (FESEM) (Hitachi, Japan). The surface areas of the polymers was measured by nitrogen adsorption and desorption experiments using an Autochem 2920 physical chemistry analyzer (Quantachrome, USA). The chemical compositions of the obtained materials were recorded by an FTIR-8400S spectrometer (Shimadzu, Japan) with a scanning range from 400 to 4000 cm−1 at room temperature. Thermo gravimetric analysis (TGA) of the Lyz-MIPs and NIPs were performed with an SDT-Q600 thermogravimetric analyzer (TA, New Castle, USA) with ramp 10 °C min−1 from room temperature to 800 °C.
2.4 Adsorption experiments
All the binding experiments were carried out in a triangular flask by using a batch technique. Before binding experiments, a calibration curve was obtained from the UV-Vis spectra of the Lyz solutions with different concentrations.
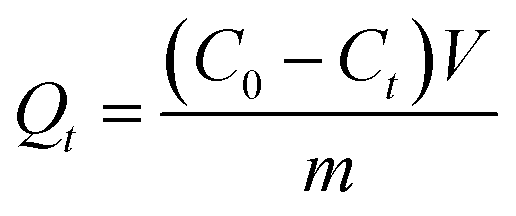
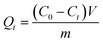
The adsorption kinetic experiments were performed as follows: 10 mg of Lyz-MIPs or NIPs was dispersed in 10 mL of Tris–HCl buffer solution (pH 8.5) with 0.60 mg mL−1 of Lyz. The flasks were shaken at 30 °C, 190 rpm for 90 min, then the mixture was centrifuged and the supernatant solution was collected. The maximum absorbances of Lyz in the supernatant before and after adsorption were measured by UV-Vis spectrophotometer at 280 nm with Tris–HCl buffer solution (pH 8.5, 50 mM) as the blank. The adsorption amount of Lyz (Qt, mg g−1) at time t (min) was calculated according to the following equation:
| |
 | (1) |
where
C0 (mg mL
−1) is the initial Lyz concentrations;
Ct (mg mL
−1) is the free Lyz concentration at time
t;
V (mL) and
m (g) are the volume of solution and mass of nano-adsorbent, respectively.
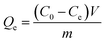
The isothermal adsorption experiments were proceeded as follows: 10 mg of Lyz-MIPs or NIPs was added to 10 mL of Tris–HCl buffer solution (pH 8.5, 50 mM) with varied initial concentration (0.10–0.70 mg mL−1) of Lyz. The adsorption experiments were carried out at 30 °C for 1 h to reach equilibrium. The residual Lyz concentration in the supernatant was measured by UV-Vis spectrophotometer at 280 nm. The equilibrium adsorption capacity Qe (mg g−1) of Lyz was calculated according to the following equation:
| |
 | (2) |
where
C0 (mg mL
−1) and
Ce (mg mL
−1) are the initial and equilibrium Lyz concentrations, respectively;
V (mL) and
m (g) are the volume of solution and mass of nanoadsorbent, respectively.
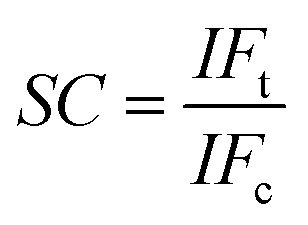
To evaluate the selective adsorption ability, 10 mg of Lyz-MIPs or NIPs was added to 10 mL of Tris–HCl buffer solution (pH 8.5, 50 mM) containing 0.3 mg mL−1 of BSA, HSA, BR and pepsin, respectively. The mixture was shaken at 30 °C, 190 rpm for 90 min. After that the extraction and detection procedures were conducted according to the method, which was described in the kinetic adsorption experiments. The imprinting factor (IF) and selectivity coefficient (SC) were used to evaluate the selectivity properties of Lyz-MIPs or NIPs toward the template protein and competitive protein. The IF and SC were calculated from the following equations:
| |
 | (3) |
| |
 | (4) |
where
QMIP and
QNIP (mg g
−1) represent the adsorption capacity of Lyz on Lyz-MIPs and NIPs, respectively;
IFt and
IFc are the imprinting factors for template protein and competitive protein, respectively.
2.5 Regeneration of Lyz-MIPs and NIPs
In order to test the reusability of Lyz-MIPs and NIPs, adsorption–desorption procedure for Lyz was repeated for 6 times by using the same polymers. For this purpose, 10 mg of Lyz-MIPs and NIPs were added to 10 mL of Lyz solution at a concentration of 0.30 mg mL−1 and incubated at room temperature for 1 h. Then, the polymers were separated by centrifugation and the concentration of Lyz in supernatant was quantified by UV-Vis spectrophotometer. The reused polymers were washed by SDS-HAc (2%) and purified water to remove the residual Lyz in the polymers. The recovered imprinting nanomaterials were used for another succeeding five adsorption–regeneration cycles to evaluate the reusability of Lyz-MIPs.
2.6 Application in real samples
The prepared Lyz-MIPs and NIPs were applied to purify Lyz from chicken egg white. The egg white was collected from fresh eggs and diluted to 50% (v/v) with Tris–HCl buffer solution (pH 8.5, 50 mM). The mixture was mechanically agitated in an ice bath for 30 min, and then centrifuged at 4 °C and 10000 rpm for 30 min. The supernatant fluid was diluted 10-fold and used as the source of lysozyme.
Twenty milligrams of Lyz-MIPs or NIPs were added to 10 mL of the prepared chicken white solution. After incubation at 25 °C for 30 min, the suspension was centrifuged at 4000 rpm for 15 min. The polymers were gently treated with Tris–HCl buffer solution (pH 8.5, 50 mM) to remove the weakly adsorbed proteins. Then, the strongly adsorbed proteins were exhaustedly washed by 0.1 M NaCl (2%) solution. The diluted, adsorbed and eluted samples were characterized by using SDS-PAGE.
3. Results and discussion
3.1 Preparation and characterization of Lyz-MIPs
Fig. 1 shows a schematic diagram of the synthetic route that was used to prepare the imprinting polymers (denoted as Lyz-MIPs). Firstly, chitosan was introduced to the surface of MWCNTs-COOH through oscillation and ultrasonication steps. The trace-chitosan-wrapped multi-walled carbon nanotubes structure can reduce the strong interactions among these nanotubes, prevent their aggregation and increase the number of adsorption sites for target protein. Then, a thin adherent PDA layer embedding Lyz on the surface of MWCNTs-COOH@CS was formed by a one-step spontaneous deposition of dopamine in weak alkaline solution. Because dopamine contains both amino and hydroxyl groups, these functional groups could interact with Lyz through multi-hydrogen bond and hydrophobic interaction, which is favorable to obtain high binding capacity and efficiency. Finally, SDS-HAc (2%) was used to remove the embedded Lyz, leading to the preparation of recognition cavities complementary to template protein on the surface of MWCNTs-COOH@CS.
The morphology of Lyz-MIPs, NIPs and bare MWCNTs-COOH were characterized using FETEM and FESEM. As shown in Fig. 2a and d, bare MWCNTs-COOH had very clean wall and central hollow tubular structure. The outer diameters of MWCNTs-COOH ranged from 20 to 30 nm, and their lengths were tens of microns. After the coating process, Lyz-MIPs (Fig. 2b) exhibited clearly rough surface compared with bare MWCNTs-COOH, indicating the deposition of PDA thin film over the surface of the nanotube successfully. On the other hand, the FESEM of NIPs (Fig. 2c) had some slight adhesion among neighboring NIPs particles, implying that the absence of the template protein during synthesis process would affect the uniformity of PDA layer. From FETEM Fig. 2e and f, it can be inferred that the diameter of Lyz-MIPs and NIPs became larger than that of the original MWCNTs-COOH (Fig. 2d), demonstrating the successful in situ spontaneous oxidative polymerization of dopamine on the surface of MWCNTs-COOH. The tubular layer of the highly uniformly coated PDA film was about 6 nm, which can provide a high mass-transfer between the solution and the imprinted sites. From the FESEM and FETEM images, it could be inferred that the imprinted nano-film were successfully introduced on the surface of MWCNTs-COOH. Moreover, the BET specific surface area of Lyz-MIPs was 79.94 m2 g−1, while that of NIPs was only 68.80 m2 g−1. The pore volumes of Lyz-MIPs and NIPs were found to be 0.288 and 0.250 cm3 g−1, respectively. Compared Lyz-MIPs with NIPs, the parameters of MIPs were all higher than those of NIPs, demonstrating that Lyz-MIPs had more mesopores than NIPs. The differences in mesoporosity may be due to the variation of the polymerization process in the presence of template protein.
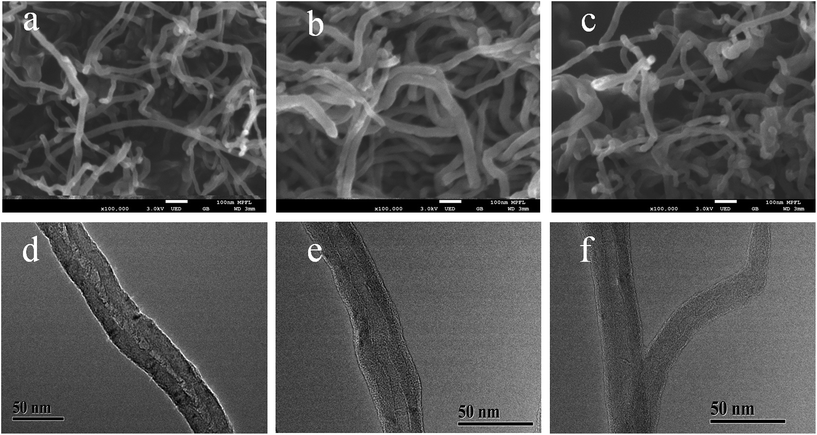 |
| | Fig. 2 FESEM and FETEM images of MWCNTs-COOH (a, d), Lyz-MIPs (b, e) and NIPs (c, f). | |
Thermogravimetric analysis (TGA) was performed to estimate the thermal stability of the prepared polymers. As indicated by the TGA results (Fig. S1†), when the temperature was below 200 °C, a relatively low proportion of mass loss was observed for Lyz-MIPs, due to the evaporation of physically absorbed water. The result indicates the thermostability of Lyz-MIPs in normal use. To estimate the amount of PDA film attached on the surface of Lyz-MIPs, the TGA analysis of the naked MWCNTs-COOH and Lyz-MIPs were conducted. As shown in Fig. S1,† in the temperature range of 200–480 °C, the mass loss ratio for MWCNTs-COOH was only about 4.83%. While Lyz-MIPs and NIPs showed higher weight losses, which were about 24.69% and 16.50%, respectively. From the stepwise increased weight loss results above, it can be deduced that the average mass content of PDA in imprinting polymers was about 17.82%, demonstrating that the polymerization of dopamine was achieved.
Fourier transform infrared (FT-IR) spectra provided a direct proof for the deposition of PDA on the surface of MWCNTs-COOH (Fig. S2†). The strong absorption peaks at approximately 3445 cm−1 (O–H) and 1110 cm−1 (C–O) were the characteristic peaks of the hydroxyl groups in the MWCNTs-COOH (Fig. S2a†). The peaks located at 1540 and 1398 cm−1 were corresponded to antisymmetrical vibration and symmetric vibration of COO− respectively. The weak band appearing at 1750 cm−1 was attributed to stretching vibration of C![[double bond, length as m-dash]](https://www.rsc.org/images/entities/char_e001.gif) O, indicating that large amounts of carboxylate groups covered on the surface of MWCNTs-COOH. After coated by the polydopamine (Fig. S2b and c†), the bands at both 1506 and 1640 cm−1 were attributed to the superposition of phenylic CC stretching and N–H bending, indicating the formation of polydopamine (PDA) layers.
O, indicating that large amounts of carboxylate groups covered on the surface of MWCNTs-COOH. After coated by the polydopamine (Fig. S2b and c†), the bands at both 1506 and 1640 cm−1 were attributed to the superposition of phenylic CC stretching and N–H bending, indicating the formation of polydopamine (PDA) layers.
3.2 Optimization of preparation conditions
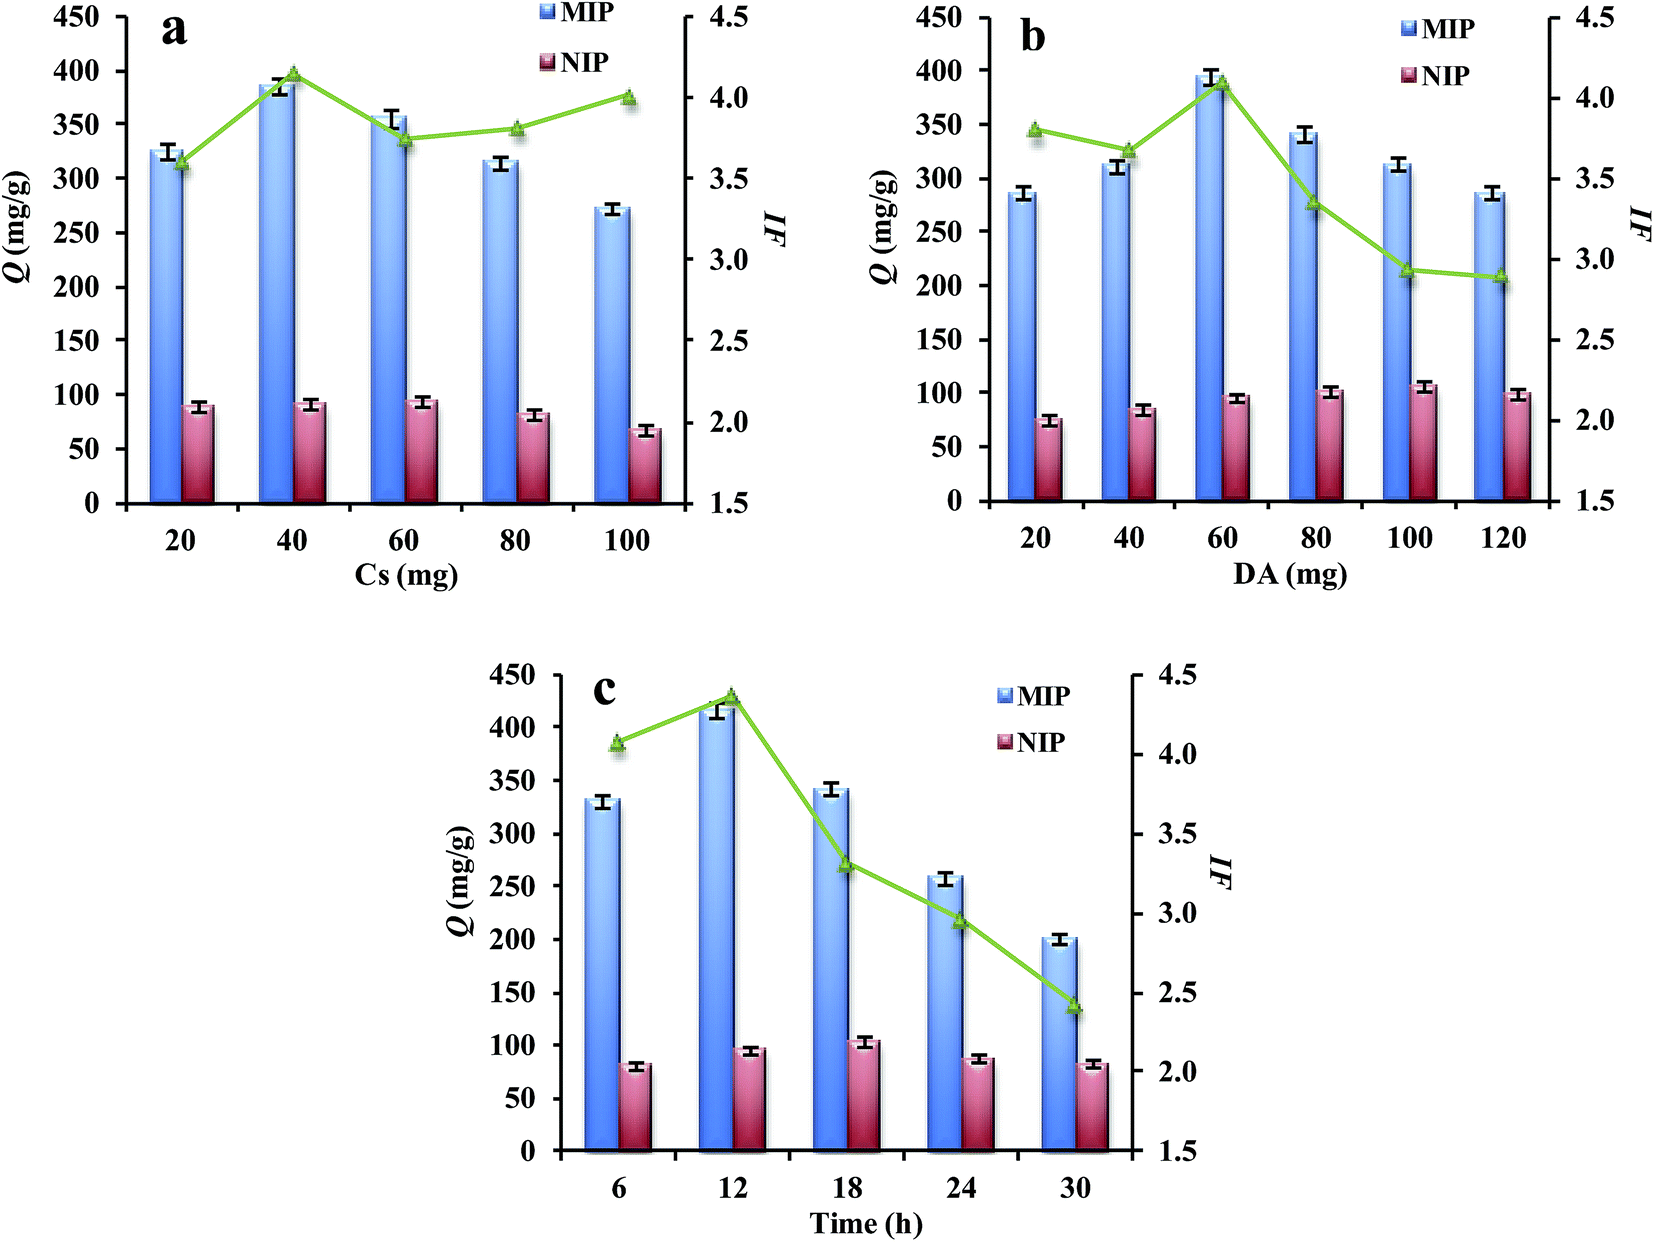
The recognition capability of Lyz-MIPs is greatly dependent on polymerization process. In order to obtain the most favorable molecular polymers, different influencing factors, including the amount of chitosan mobilized on MWCNTs-COOH, the concentration of DA and polymerization time, were optimized respectively.
3.2.1 Effect of chitosan amount. In this work, different amounts of chitosan, ranging from 20 to 100 mg, were studied in the preparation process. Fig. 3a presents the results of the adsorption of Lyz-MIPs. The binding amount of Lyz-MIPs increased with the increasing amount of chitosan. We presumed that the modification could effectively improve the dispersion stability of MWCNTs-COOH in hydrophilic fluids. Moreover, the abundant amino and hydroxyl groups of chitosan increased the adsorption sites for target protein on the surface of MWCNTs-COOH. However, a continuous increase amount of chitosan will introduce too much amino groups, which obstructed the electrostatic interaction between the target protein and sorbents. At the chitosan amount of 40 mg, the best binding amount and imprinting factor for Lyz were obtained. In order to prove the functional modification effect of chitosan, examination of the adsorption capability between MWCNTs-COOH@MIPs (generated in the same way as Lyz-MIPs but without addition of CS) and Lyz-MIPs was carried out for comparison. The adsorption capacity of Lyz-MIPs (418 mg g−1) was much higher than that of MWCNTs-COOH@MIPs (103 mg g−1), indicating that the chitosan plays an important role in the process of protein recognition.
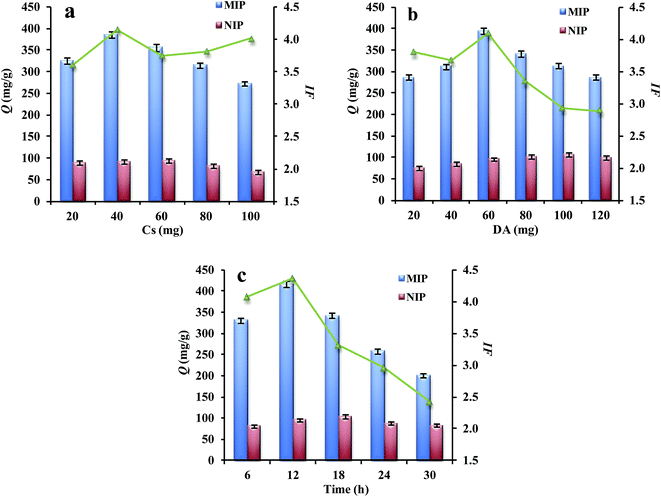 |
| | Fig. 3 Effect of the amount of CS (a), the amount of dopamine (b) and reaction time (c) on the adsorption performance of Lyz-MIPs and NIPs. | |
3.2.2 Effect of functional monomer (DA) amount. Similarly, the effect of DA concentration was also investigated in the range of 20–120 mg. As shown in Fig. 3b, when the mass of DA was increased from 20 mg to 60 mg, both Lyz-MIPs and NIPs exhibited increased adsorption for Lyz, and the optimal mass was found to be 60 mg. The reason for this might be that higher amount of DA could increase the thickness of PDA layer and thus lead to the sufficient binding sites available for Lyz on the surface of MWCNTs-COOH. When the DA concentration was higher than 6 mg mL−1, the further increase of the thickness of PDA film caused the burying of recognition cavities and consequently leading to a high ratio of non-specific adsorption. The excessive functional monomer may also self-polymerize and block the recognition sites, resulting in low imprinting effect.
3.2.3 Effect of reaction time. In order to maximize the formation of imprinting cavities and minimize the generation of non-specific interactions, the effect of the polymerization time was finally investigated. As shown in Fig. 3c, with increasing the polymerization time to 12 h, Lyz-MIPs exhibited the best binding amount and IF among all the tested polymers, indicating that the optimal recognition sites and the best PDA layer thickness were formed at this condition. Further prolonging the self-polymerization time could lead to poor site accessibility for template protein, resulting in low imprinting factor. Therefore, the optimized preparation conditions were found to be 40 mg of chitosan, 60 mg of DA, and 12 h of reaction time.
3.3 Adsorption kinetics
Fig. 4 shows adsorption kinetic curves for Lyz-MIPs and NIPs towards Lyz at 298 K. In the initial stage, owing to the existence of large empty binding sites, the adsorption amount quickly increased. Then, with increasing the contact time, the effective binding sites were gradually captured and the adsorption equilibrium was slowly achieved after 40 min. Moreover, Lyz-MIPs needed more time to reach the adsorption equilibrium, which might be due to the abundant specific recognition process to Lyz through size and space effects.
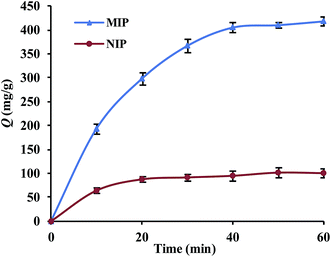 |
| | Fig. 4 The adsorption kinetics of Lyz on Lyz-MIPs and NIPs. Experimental conditions: 10 mL Lyz solution (0.60 mg mL−1, 50 mM Tris–HCl pH = 8.5) was incubated with 10 mg polymers at 30 °C. The points represent mean values of three measurements. | |
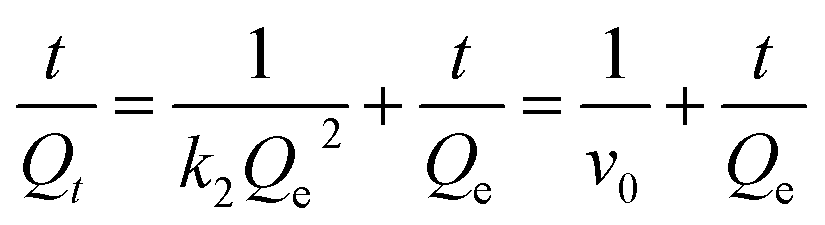
In order to further validate the adsorption mechanism, the experiment data were tested using pseudo-first-order and pseudo-second-order kinetic equations, which were shown as follows, respectively:
| | |
ln(Qe − Qt) = lnQe − k1t
| (5) |
| |
 | (6) |
where
Qe and
Qt are the amount of adsorbate onto sorbent at the equilibrium and time
t (min);
v0 (mg g
−1 min
−1) is the initial adsorption rate;
k1 and
k2 are the equilibrium rate constants of pseudo-first-order and pseudo-second-order equation, respectively.
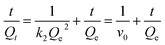
The related parameters were calculated and listed in Table 1. The R2 values of the pseudo-second-order kinetic equation were higher than that of the pseudo-first-order kinetic equation, indicating that chemical process was the rate-limiting step during the adsorption. The V0 of Lyz-MIPs (33.22 mg g−1 min−1) is much higher than that of NIPs (16.00 mg g−1 min−1), indicating the presence of specific recognition sites on the surface of Lyz-MIPs. All the results suggested that the adsorption process was better described by the pseudo-second-order kinetic model.
Table 1 Kinetic models and their statistical parameters
| Sorbents |
Pseudo-first-order equation |
Pseudo-second-order equation |
| R2 |
Qe,fa (mg g−1) |
k1 (min−1) |
R2 |
Qe,sb (mg g−1) |
k2 (min−1) |
v0 (mg g−1 min−1) |
| Qe,f (mg g−1) is the calculated value of Qe by Pseudo-first-order equation. Qe,s (mg g−1) is the caculated value of Qe by Pseudo-second-order equation. |
| Lyz-MIPs |
0.843 |
1914.29 |
0.136 |
0.991 |
555.56 |
0.108 × 10⁻³ |
33.22 |
| NIPs |
0.788 |
353.01 |
0.002 |
0.996 |
114.94 |
1.211 × 10⁻³ |
16.00 |
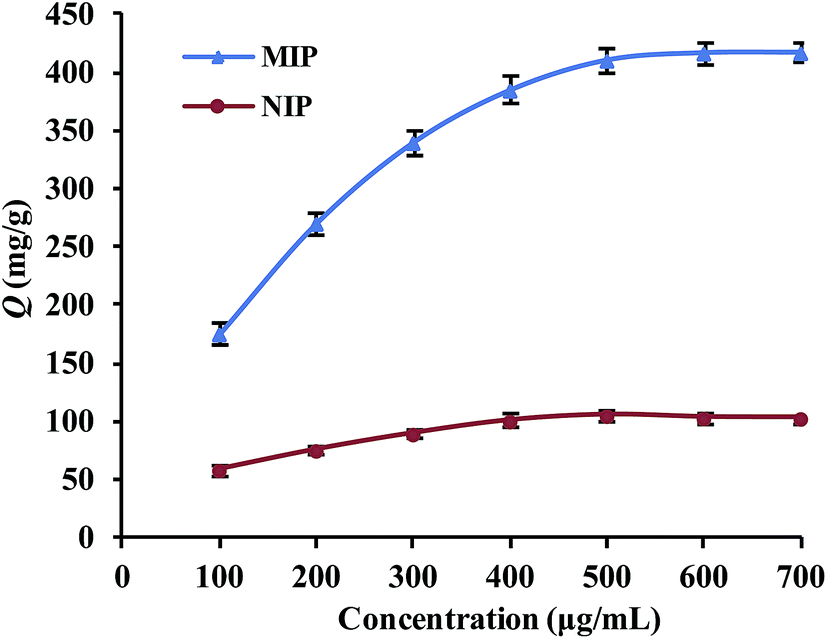
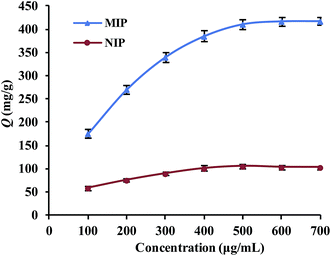
3.4 Adsorption isotherms
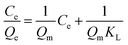
The binding capacities for the tested templates of initial concentrations in the range of 0.10–0.70 mg mL−1 were investigated for both Lyz-MIPs and NIPs. As observed from the isothermal curves (Fig. 5), the adsorption amount increased with the increase of the initial concentration and gradually reached the adsorption equilibrium. The amount of Lyz bounded to Lyz-MIPs (418 mg g−1) was about 4 times higher than that of NIPs (103 mg g−1), suggesting that the specific recognition sites complemented to the template on spatial structure, molecular size and chemical effect were successfully formed on Lyz-MIPs. Comparatively, the adsorption of NIPs was dominated by the non-specific effect. Langmuir and Freundlich isotherm models were used to analyze the equilibrium values, which can be expressed by the following equations, respectively:| |
 | (7) |
| |
 | (8) |
where Ce (mg mL−1) is the equilibrium concentration of adsorbate; Qe (mg g−1) is the adsorption capacity at equilibrium; Qm is the maximum adsorption capacity, theoretically; KL (mL mg−1) and KF (mg g−1) are the Langmuir and Freundlich constant respectively; 1/n is the Freundlich empirical constant that reflects the magnitude of the adsorption driving force.
 |
| | Fig. 5 The adsorption isotherms of Lyz on Lyz-MIPs and NIPs. Experimental conditions: 10 mL Lyz solution (0.10–0.70 mg mL−1, 50 mM Tris–HCl pH = 8.5) was incubated with 10 mg polymers at 30 °C. The points represent mean values of three measurements. | |
The isotherm constants and liner correlation coefficients obtained from the experimental data are presented in Table 2. Through the comparison of liner correlation coefficients, the Langmuir isotherm model (r > 0.99) fitted the adsorption process of Lyz onto the polymers significantly better than the Freundlich isotherm model (r < 0.94). Therefore, the adsorption of Lyz onto Lyz-MIPs and NIPs may be a monolayer adsorption process.
Table 2 Parameters for Langmuir and Freundlich isotherm equations
| Sorbents |
Qe,Ea (mg g−1) |
Langmuir isotherm equation |
Freundlich isotherm equation |
| R2 |
Qm,Lb (mg g−1) |
KL (mL mg−1) |
R2 |
n |
KF (mg g−1) |
| Qe,E (mg g−1) is the experimental value of Qe. Qm,L (mg g−1) is the calculated value of Qe by Langmuir isotherm equation. |
| Lyz-MIPs |
417 |
0.994 |
526.32 |
6.50 × 10⁻³ |
0.948 |
2.34 |
28.85 |
| NIPs |
103 |
0.994 |
119.05 |
11.85 × 10⁻³ |
0.938 |
3.45 |
17.06 |
Several imprinting methods have been reported in the literatures for specific binding of lysozyme. The imprinting factor and adsorption capacity (Qmax) of these literatures are summarized in Table 3. As can be seen, the Lyz-MIPs prepared in this work possessed remarkably higher Qmax and IF than those of other literatures.35–45 Therefore, it is obvious that the method reported here has an enormous improvement.
Table 3 Comparisonn of the adsorption capacity (Qmax) and imprinting factor (IF) with other published imprinted polymers for Lyz
| Polymers |
IF |
Qmax (mg g−1) |
Reference |
| Lyz-imprinted cryogels |
3.9 |
10.3 |
35 |
| Lyz-imprinted Fe3O4 nanoparticles |
1.5 |
67.6 |
36 |
| Lyz-imprinted magnetic nanocomposites |
29.0 |
125.0 |
37 |
| Lyz-imprinted silica nanoparticles |
4.0 |
53.3 |
38 |
| Lyz-imprinted Fe3O4 nanoparticles |
2.0 |
8.3 |
39 |
| Lyz-imprinted silica nanoparticles |
2.9 |
35.2 |
40 |
| Lyz-imprinted magnetic nanoparticles |
3.7 |
250.0 |
41 |
| Lyz-imprinted MCP beads |
2.5 |
31.7 |
42 |
| Lyz-imprinted magnetic nanoparticles |
2.0 |
23.3 |
43 |
| Lyz-imprinted Fe3O4 nanoparticles |
1.8 |
204.1 |
44 |
| Lyz-imprinted silica nanoparticles |
3.1 |
49.6 |
45 |
| Lyz-MIPs |
4.1 |
418.3 |
This work |
3.5 Adsorption specificity
To evaluate the selectivity of Lyz-MIPs, besides the template lysozyme, four other proteins with a wide range of isoelectric points (pI) and weight-average molecular weight (Mw) were chosen as control proteins to evaluate the selectivity of the prepared Lyz-MIPs. The pI and Mw of all the proteins studied are Lyz (Mw 14 kDa, pI 14.4), BSA (Mw 66.46 kDa, pI 4.7), pepsin (Mw 34.5 kDa, pI 1.0-2.5), HSA (Mw 67 kDa, pI 4.64) and BR (Mw 33 kDa, pI 9.35), respectively. As shown in Fig. 6, it was obvious that Lyz-MIPs exhibited the highest adsorption capacity and imprinting factor to Lyz among these five proteins, where the selectivity coefficient of BSA, pepsin, HSA and BR were 4.30, 7.12, 3.06 and 4.20, respectively. The adsorption capacity of Lyz-MIPs and NIPs for BR was nearly 91 mg g−1, which was similar to 103 mg g−1 of NIPs toward Lyz and much higher than that for BSA and HSA proteins. This might be because the Mw of BSA and HSA are larger than that of BR, so these proteins were hard to enter into the recognition cavities on the surface of Lyz-MIPs. Moreover, according to the pI of Lyz and BR, they were positively charged in adsorption solution while DA was negatively charged during the adsorption process, while BSA and HSA were negatively charged. Thus, Lyz-MIPs could selectively adsorb more BR than BSA and HSA according to the theory of electrostatic interactions. As for pepsin, the pI is so low that will lead to a remarkable decline in electrostatic interaction between the protein molecules and the formed Lyz-MIPs. Therefore, the adsorption capacity of pepsin was the lowest among five proteins, although it has similar molecular size to Lyz. The above results indicate that the imprinted cavities with a combination of complementarities in molecular size, shape and multiple functional groups play an essential role in the specific recognition of template protein.
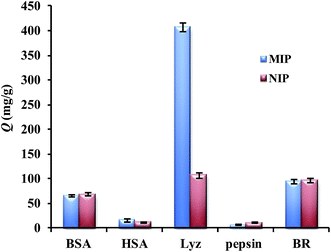 |
| | Fig. 6 The selective adsorption capacity of Lyz-MIPs and NIPs towards BSA, HSA, pepsin and BR. | |
3.6 Regeneration and reusability
The regeneration ability is one of the key factors for the application performance of adsorbents. A batch adsorption experiment for Lyz-MIPs was firstly conducted to reach saturation adsorption. The Lyz-MIPs could be regenerated after washing with SDS-HAc (2%). The experimental results are shown in Fig. 7. As can be seen, after six adsorption–desorption cycles, the adsorption capacity of the Lyz-MIPs for template protein was only reduced by 7.4%. The possible reason is that some recognition cavities in the DA layer of Lyz-MIPs particles might be blocked after regeneration or be destroyed after rewashing/centrifugation process, and thus they did not match with the template protein any more. Despite a small decreased, the absorption capacity of Lyz-MIPs was maintained 92.5% after six cycles, exhibiting a good stability and regeneration performance. All these results confirm that the Lyz-MIPs prepared by this method is suitable for practical application.
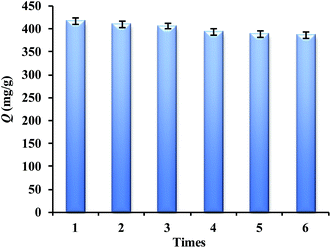 |
| | Fig. 7 Reusability of the Lyz-MIPs for six cycles. | |
3.7 Real sample ananlysis
The practical applicability of Lyz-MIPs was evaluated by direct purification of Lyz from the diluted egg white, and the results of SDS-PAGE are shown in Fig. 8. Compared with the 10-fold diluted egg white samples (lane 1), the intensity of Lyz band faded noticeably after being treated with Lyz-MIPs (lane 2). After elution with 0.1 M NaCl, there was only one band reappeared clearly on 14.4 kDa (lane 4), suggesting that Lyz was well isolated by prepared Lyz-MIPs and other proteins in the diluted egg white sample displayed no co-adsorption. In addition, the lysozyme molecules covered the same distance after the adsorption–elution process (lane 2 and 4), indicating that the efficient process did not denature the natural form of lysozyme structure. These results further confirm that the developed Lyz-MIPs with excellent imprinting effect and selectivity have obvious advantages for practical applications.
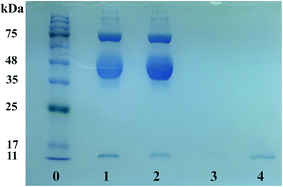 |
| | Fig. 8 SDS-PAGE analysis of chicken egg white before and after treatment with Lyz-MIPs and NIPs. Lane 0, marker; lane 1, fresh egg white diluted 10-fold; lane 2, remaining egg white after adsorption by Lyz-MIPs; lane 3, the absorbed egg white by NIPs eluted with SDS-HAc (2%); lane 4, the absorbed egg white by Lyz-MIPs eluted with SDS-HAc (2%). | |
4. Conclusions
In this work, a facile and effective surface protein imprinting method through self-polymerization and nano-sized matrix for selective separation of proteins has been developed successfully. Comparing with previous works using Lyz as the template, our imprinted nanomaterials exhibit the biggest binding capacity, significant selectivity, and excellent reproducibility among these articles. Furthermore, the synthesis process is much simpler and is more suitable with the concept of “Green Chemistry”, since we adopted MWCNTs-COOH as supports and DA as functional monomers. The practicability for biological application of as-prepared Lyz-MIPs was also evaluated by the successful usage in separating lysozyme from chicken egg white, showing potential values in industrial protein purification, basic biomedical research and clinical diagnostics. All these results indicated that the advantageous properties of this green method could significantly enhance the specific recognition ability of Lyz-MIPs and low the cost, thus this method would hold the potential to promote the development of molecular imprinting technique for protein.
Acknowledgements
This work was financially supported by National Natural Science Foundations of China (Grant No. 81573391 and 81173024), the National Key Projects of China (No. 81227802), China Postdoctoral Science Foundation (No. 2014M562428) and Shannxi Province Health Department Scientific Foundation (No. 2014D73). We are grateful to Dr Min Zhang and Prof. Ge Meng for revising the paper.
References
- L. Sheng, J. Wang, M. J. Huang, Q. Xu and M. H. Ma, Int. J. Biol. Macromol., 2016, 92, 600–606 CrossRef CAS PubMed.
- T. T. Wu, C. H. Wu, S. L. Fu, L. P. Wang, C. H. Yuan, S. G. Chen and Y. Q. Hu, Carbohydr. Polym., 2017, 155, 192–200 CrossRef CAS PubMed.
- G. Bayramoglu, T. Tekinay, V. C. Ozalp and M. Y. Arica, J. Chromatogr. B: Anal. Technol. Biomed. Life Sci., 2015, 990, 84–95 CrossRef CAS PubMed.
- M. Mayani, C. D. M. Filipe and R. Ghosh, J. Membr. Sci., 2010, 347, 150–158 CrossRef CAS.
- B. Bobály, E. Tóth, L. Drahos, F. Zsila, J. Visy, J. Fekete and K. Vékey, J. Chromatogr. A, 2014, 1325, 155–162 CrossRef PubMed.
- P. Q. Guo, Z. M. Luo, X. Y. Xu, Y. L. Zhou, B. L. Zhang, R. M. Chang, W. Du, C. Chang and Q. Fu, Food Chem., 2017, 217, 628–636 CrossRef CAS PubMed.
- P. Ma, Z. P. Zhou, J. D. Dai, L. Qin, X. B. Ye, X. Chen, J. S. He, A. Xie, Y. S. Yan and C. X. Li, RSC Adv., 2016, 6, 9619–9630 RSC.
- C. Wang, Z. H. Guo, L. Zhang, N. Zhang, K. Y. Zhang, J. G. Xu, H. Y. Wang, H. W. Shi, M. Qin and L. Ren, RSC Adv., 2016, 6, 49597–49603 RSC.
- P. Q. Guo, X. Y. Xu, L. Xian, Y. H. Ge, Z. M. Luo, W. Du, W. H. Jing, A. G. Zeng, C. Chang and Q. Fu, Talanta, 2016, 161, 830–837 CrossRef CAS PubMed.
- K. Hemmati, R. Sahraei and M. Ghaemy, Polymer, 2016, 101, 257–268 CrossRef CAS.
- W. Du, C. M. Lei, S. R. Zhang, G. Bai, H. Y. Zhou, M. Sun, Q. Fu and C. Chang, J. Pharm. Biomed. Anal., 2014, 91, 160–168 CrossRef CAS PubMed.
- Z. Y. Yang, Q. Z. Cai, N. Chen, X. M. Zhou and J. L. Hong, RSC Adv., 2016, 6, 12193–12204 RSC.
- Z. M. Luo, W. Du, P. Q. Guo, P. L. Zheng, R. M. Chang, J. Wang, A. G. Zeng, C. Chang and Q. Fu, RSC Adv., 2015, 5, 72610–72620 RSC.
- R. Liu, M. Sha, S. S. Jiang, J. Luo and X. Y. Liu, Talanta, 2014, 120, 76–83 CrossRef CAS PubMed.
- J. Erdoessy, V. Horváth, A. Yarman, F. W. Scheller and R. E. Gyurcsányi, Trends Anal. Chem., 2016, 79, 179–190 CrossRef.
- K. G. Yang, L. H. Zhang, Z. Liang and Y. K. Zhang, Anal. Bioanal. Chem., 2012, 403, 2173–2183 CrossRef CAS PubMed.
- L. Qin, X. W. He, W. Zhang, W. Y. Li and Y. K. Zhang, Anal. Chem., 2009, 81, 7206–7216 CrossRef CAS PubMed.
- H. Y. Lin, C. Y. Hsu, J. L. Thomas, S. E. Wang, H.
C. Chen and T. C. Chou, Biosens. Bioelectron., 2006, 22, 534–543 CrossRef CAS PubMed.
- G. Ertürk and B. Mattiasson, J. Chromatogr. B: Anal. Technol. Biomed. Life Sci., 2016, 1021, 30–44 CrossRef PubMed.
- H. C. Chen, J. Kong, D. Y. Yuan and G. Q. Fu, Biosens. Bioelectron., 2014, 53, 5–11 CrossRef CAS PubMed.
- K. Y. Zhao, B. B. Lin, W. K. Cui, L. Z. Feng, T. Chen and J. F. Wei, Talanta, 2014, 121, 256–262 CrossRef CAS PubMed.
- Z. M. Luo, H. Shu, P. Q. Guo, P. L. Zheng, X. Y. Pan, W. Du, R. L. Liu, A. G. Zeng, C. Chun and Q. Fu, RSC Adv., 2016, 6, 15549–15557 RSC.
- H. Nishino, C. S. Huang and K. J. Shea, Angew. Chem., Int. Ed., 2006, 45, 2392–2396 CrossRef CAS PubMed.
- Y. L. Wu, J. Zhao, C. Wang, J. Lu, M. J. Meng, X. H. Dai, Y. S. Yan and C. X. Li, Chem. Eng. J., 2016, 306, 492–503 CrossRef CAS.
- A. V. Herrera-Herrera, M. A. Gonzalez-Curbelo, J. Hernandez-Borges and M. A. Rodriguez-Delgado, Anal. Chim. Acta, 2012, 734, 1–30 CrossRef CAS PubMed.
- L. T. Yang, J. Yang, B. J. Xu, F. Q. Zhao and B. Z. Zeng, Talanta, 2016, 161, 413–418 CrossRef CAS PubMed.
- W. H. Chi, H. G. Shi, W. Shi, Y. Guo and T. Y. Guo, J. Hazard. Mater., 2012, 227–228, 243–249 CrossRef CAS PubMed.
- H. W. Wang, S. Yao, Y. Q. Liu, S. L. Wei, J. W. Su and G. X. Hu, Biosens. Bioelectron., 2017, 87, 417–421 CrossRef CAS PubMed.
- W. H. Wu, L. T. Yang, F. Q. Zhao and B. Z. Zeng, Sens. Actuators, B, 2017, 239, 481–487 CrossRef CAS.
- X. Yang, Z. H. Zhang, J. X. Li, X. Chen, M. L. Zhang, L. J. Luo and S. Z. Yao, Food Chem., 2014, 145, 687–693 CrossRef CAS PubMed.
- D. Zhang, D. J. Yu, W. J. Zhao, Q. Y. Yang, H. Kajiura, Y. M. Li, T. S. Zhou and G. Y. Shi, Analyst, 2012, 137, 2629–2636 RSC.
- L. M. Wu, F. Liu, G. L. Wang, Z. A. Guo and J. C. Zhao, RSC Adv., 2016, 6, 464–471 RSC.
- J. H. Kim, M. Lee and C. B. Park, Angew. Chem., Int. Ed., 2014, 53, 6364–6368 CrossRef CAS PubMed.
- Y. Q. Lv, T. W. Tan and F. Svec, Biotechnol. Adv., 2013, 31, 1172–1186 CrossRef CAS PubMed.
- K. Erol, K. KöSe, L. Uzun, R. Say and A. Denizli, Colloids Surf., B, 2016, 146, 567–576 CrossRef CAS PubMed.
- S. L. Ji, N. Li, Y. Shen, Q. Li, J. Qiao and Z. B. Li, Anal. Chim. Acta, 2016, 909, 60–66 CrossRef CAS PubMed.
- F. Lan, S. H. Ma, J. Ma, Q. Yang, Q. Y. Yi, Y. Wu and Z. W. Gu, Mater. Sci. Eng. C, 2017, 70, 1076–1080 CrossRef CAS PubMed.
- C. C. Yang, X. M. Yan, H. Guo and G. Q. Fu, Biosens. Bioelectron., 2016, 75, 129–135 CrossRef CAS PubMed.
- Q. Q. Gai, F. Qu, Z. J. Liu, R. J. Dai and Y. K. Zhang, J. Chromatogr. A, 2010, 1217, 5035–5042 CrossRef CAS PubMed.
- H. C. Chen, D. Y. Yuan, Y. Y. Li, M. J. Dong, Z. H. Chai, J. Kong and G. Q. Fu, Anal. Chim. Acta, 2013, 779, 82–89 CrossRef CAS PubMed.
- M. Zhang, X. H. Zhang, X. W. He, L. X. Chen and Y. K. Zhang, Nanoscale, 2012, 4, 3141–3147 RSC.
- R. X. Gao, X. Kong, X. Wang, X. W. He, L. X. Chen and Y. K. Zhang, J. Mater. Chem., 2011, 21, 17863–17871 RSC.
- N. Li, L. Qi, Y. Shen, J. Qiao and Y. Chen, ACS Appl. Mater. Interfaces, 2014, 6, 17289–17295 CAS.
- L. Qin, X. W. He, X. Yuan, W. Y. Li and Y. K. Zhang, Anal. Bioanal. Chem., 2011, 399, 3375–3385 CrossRef CAS PubMed.
- H. C. Chen, J. Kong, D. Y. Yuan and G. Q. Fu, Biosens. Bioelectron., 2014, 53, 5–11 CrossRef CAS PubMed.
Footnote |
| † Electronic supplementary information (ESI) available. See DOI: 10.1039/c6ra28063c |
|
| This journal is © The Royal Society of Chemistry 2017 |
Click here to see how this site uses Cookies. View our privacy policy here. 
 Open Access Article
 This Open Access Article is licensed under a Creative Commons Attribution-Non Commercial 3.0 Unported Licence
 *
*