 Open Access Article
Combustion synthesis as a low temperature route to Li4Ti5O12 based powders for lithium ion battery anodes
Dries De Sloovere ,
Wouter Marchal,
Fulya Ulu,
Thomas Vranken,
Maarten Verheijen,
Marlies K. Van Bael and
An Hardy*
UHasselt, Hasselt University, Institute for Materials Research (IMO), Imec Division IMOMEC, Inorganic and Physical Chemistry, Agoralaan, 3590 Diepenbeek, Belgium. E-mail: an.hardy@uhasselt.be
First published on 29th March 2017
Abstract
Spinel Li4Ti5O12 (LTO) is considered as a promising anode material for lithium ion batteries due to its high stability and its inherent safety. Since LTO is typically synthesized at high temperatures, a study of combustion synthesis of LTO is presented, wherein effects of oxidizer amount in the precursor and atmosphere during thermal decomposition are investigated. Combustion synthesis implies heating a precursor to a relatively low process temperature, after which the system generates the necessary energy for complete conversion and crystallization to the desired oxide. Hereto, the precursor and thermally treated powders were characterized by thermogravimetric analysis (TGA) coupled with differential scanning calorimetry (DSC) and Fourier transform infrared spectroscopy (FTIR), transmission electron microscopy (TEM), dynamic light scattering (DLS), X-ray diffraction (XRD), cyclic voltammetry (CV) and galvanostatic cycling. The study shows that the combustion process allows the synthesis of LTO at process temperatures as low as 300 °C, compared to around 800 °C for solid state reactions and sol–gel routes. The product consists of crystalline LTO with minor impurities. The product was used as an electrode material in a lithium battery coin cell and demonstrated a high stability and a capacity of 164 mA h g−1 at 0.1C and 132 mA h g−1 at 2C. This paper shows that combustion synthesis can considerably lower the temperature required for the synthesis of ceramic materials, after careful optimization of the precursor, since the mechanism of thermal degradation is complex and dependent on a large number of parameters.
1 Introduction
Today's portable electronic consumer devices and electric vehicles require rechargeable batteries, able to efficiently store and convert electrochemical energy.1 Furthermore, the implementation of renewable energy sources for electricity production requires an efficient means to store this energy, since they are intermittent energy sources.2,3 For example, the amount of generated solar power depends, apart from the day–night cycle, also strongly on cloud coverage and temperature.Because of their high energy and power density, the current rechargeable battery market is led by lithium ion batteries. The use of graphite as the anode material and lithiated transition metal oxides (LiMO2) as the cathode material in lithium ion batteries has greatly accelerated their commercialization.3 Notable examples of commercially used lithiated transition metal oxides are LiCoO2 (LCO), LiMn2O4 (LMO), LiNiMnCoO2 (NMC) and LiNiCoAlO2 (NCA). Both graphite and lithiated transition metal oxides are intercalation compounds, which undergo a relatively small volume expansion upon Li+ insertion, since the lithium atoms occupy interstitial sites. This significantly raises the safety of battery operation, because otherwise a large volume expansion and reduction would cause partial pulverization of the electrode material and thus capacity fading by loss of the electronic contact between parts of the electrode.4 However, since at the end of Li+ insertion into carbonaceous materials, the voltage reaches almost 0 V versus Li/Li+, additional mechanisms are required to guarantee safe battery operation, such as safety vents and circuit breakers.5,6
The use of Li4Ti5O12 (referred to as LTO) instead of graphite as the anode material solves this problem, since it exhibits an extremely flat working potential at 1.55 V versus Li/Li+.7,8 While this relatively high potential reduces the energy density in comparison to batteries based on graphite as the anode, it also avoids the reduction of the electrolyte at the surface of the negative electrode during charging.9 Furthermore, LTO is a zero-strain insertion material, which means that Li+ ion insertion or extraction happens without any noticeable change in the lattice dimensions, greatly contributing to its good cycling stability.8 The incorporation of 3 moles of lithium ions per mole of LTO corresponds to a theoretical capacity of 175 mA h g−1.
LTO may be synthesized using a variety of methods, each with its own advantages and disadvantages.9 Solid-state synthesis is simple, but energy consuming since high temperatures have to be used for extended periods. Also, the products are often irregular in shape and inhomogeneous in composition. Sol–gel synthesis offers molecular mixing, which makes it possible to create homogeneous multi-component systems as the intimate mixing makes for small diffusion distances.10 Therefore, this strategy has also been applied to the synthesis of LTO. An overview of the synthesis methods, temperatures and times of LTO reported in literature is presented in Table 1. Temperatures around 800 °C are typically necessary to produce a phase-pure product.
| Publication | Synthesis method | Temperature (°C) | Time (h) | Capacity (mA h g−1) | Stability (%) (cycles) |
|---|---|---|---|---|---|
| a Cycled between 1.0 and 3.0 V vs. Li/Li+.b Cycled between 1.0 and 2.5 V vs. Li/Li+.c Cycled between 1.2 and 2.0 V vs. Li/Li+.d Cycled between 1.0 and 2.0 V vs. Li/Li+. | |||||
| Yuan et al. (2011)11 | Solid-state | 750 | 5 | 160 (0.5C)a | 97.8 (40)a |
| Han et al. (2013)12 | Solid-state | 800 | 3 | 174 (0.1C)b | 100.0 (27)b |
| Cheng et al. (2010)13 | Solid-state | 800 | 9 | 150 (0.5C)a | 95.0 (1000)a |
| Wang et al. (2014)14 | Solid-state | 800 | 10 | 165 (0.5C)a | 94.6 (50)a |
| Lin & Duh (2011)15 | Solid-state | 800 | 10 | 167 (0.5C)b | 98.0 (200)b |
| Wang et al. (2014)16 | Solid-state | 800 | 12 | 154 (0.5C)a | >90.0 (300)a |
| Yi et al. (2014)17 | Solid-state | 850 | 24 | 200 (0.1C)a | 54.9 (80)a |
| Yan et al. (2009)18 | Sol–gel | 800 | 10 | 143 (0.21C)a | 98.6 (30)a |
| Khomane et al. (2011)19 | Sol–gel | 800 | 12 | 174 (0.2C)c | 94.3 (30)c |
| Venkateswarlu et al. (2005)20 | Sol–gel | 800 | 12 | 126 (0.2C)d | 92.0 (45)d |
| Xiang et al. (2011)21 | Sol–gel | 800 | 12 | 165 (0.2C)b | <94.0 (100)b |
| Wang et al. (2011)22 | Sol–gel | 800 | 15 | 144 (0.5C)a | 90.3 (50)a |
| Yuan et al. (2009)23 | Combustion | 700 | 5 | 187 (1C)a | ∼84.5 (50)a |
| Prakash et al. (2010)24 | Combustion | 800 | Seconds | 170 (0.5C)d | >95.0 (100)d |
| This work | Combustion | 300 | Seconds | 164 (0.1C)b | 94.9 (100)b |
Aforementioned studies indicate that high temperatures and times are required for the synthesis of LTO. A strategy to overcome these problems is to use combustion synthesis to attain the necessary synthesis temperature by an exothermic reaction occurring in the precursor itself. High local temperatures are generated, making it possible to synthesize oxides at low applied temperatures. The combustion synthesis method is based on a redox reaction between a fuel and an oxidizer.25–27 When the redox chemistry in such a system is balanced, organic impurities are readily removed and phase-pure products are formed. Prior to the combustion reaction, a precursor solution, which contains all the reactants for the combustion, must be developed. In an aqueous system, all reactants are dissolved in water and the resulting solution is heated. When heated to the necessary temperature, the precursor self-ignites, leading to the formation of the desired oxide. The combustion method comes with some challenges: the product properties depend severely on the combustion parameters such as the kind of fuel and the heating rate. The amounts of fuel and oxidizer in the precursor determine the combustion energy that is released upon heating the sample. This amount should be balanced with the formation energy of the desired product. If the amount of fuel and oxidizer in the sample is insufficient, the temperature required for phase crystallization or conversion of intermediary phases may not be attained. Besides enabling the formation of complex crystalline oxides at lower process temperatures, combustion synthesis is a fast and cost-effective method.25
The combustion synthesis of nanosized LTO powder was already reported in literature by Yuan et al. (2009)23 and Prakash et al. (2010).24 In the former case, a combustion reaction was observed at temperatures below 250 °C. However, this reaction yielded a poorly crystalline mixture of LTO, anatase TiO2 and rutile TiO2. A calcination at 700 °C for 5 hours was needed to obtain pure and crystalline LTO. Prakash et al. (2010)24 performed a combustion reaction at 800 °C, which yielded pure LTO after a few seconds. While in both cases a combustion reaction took place, high temperatures were still necessary to produce phase pure LTO.
This paper presents a new approach to the combustion synthesis method for the preparation of LTO as an anode material for powder batteries. Using thermogravimetric analysis coupled to differential scanning calorimetry and Fourier transform infrared spectroscopy, precursor and processing parameters are optimized to synthesize LTO at a temperature as low as 300 °C. Furthermore, in the same manner, the complex mechanism of the thermal processing of combustion precursors is looked into and the amount of oxidizer is evaluated accordingly. The ambiguous effect of NH4NO3 as oxidizer and combustion retardant is pointed out. The phase composition and the particle size of the synthesized product are assessed and the electrochemical characteristics of the synthesized product are determined by galvanostatic cycling.
2 Experimental
2.1 Precursor gel and powder synthesis
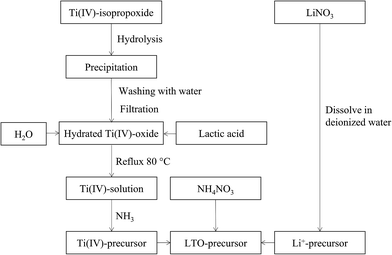
A flow chart of the precursor synthesis is shown in Fig. 1. Water based mono-metal ion solutions of Li+ and Ti4+ were prepared and subsequently mixed. Lithium nitrate (LiNO3, Sigma Aldrich, ≥98.0%) was dissolved in water at room temperature in order to obtain a solution with a concentration of 0.6 M. The titanium precursor was synthesized based on the procedure detailed by De Dobbelaere et al. (2011).28 Ti(IV)-isopropoxide (Ti[OCH(CH3)2]4, Acros Organics, 98+%) (22 mL) was added to 300 mL water. After hydrolysis and condensation, the resulting hydrated titanium hydroxide was filtered and washed with copious amounts of water. Lactic acid (Fisher Scientific, >88%) was added to the precipitate in a 3![[thin space (1/6-em)]](https://www.rsc.org/images/entities/char_2009.gif) :
:![[thin space (1/6-em)]](https://www.rsc.org/images/entities/char_2009.gif) 1 molar ratio together with 40 mL water. This mixture was refluxed at 80 °C until the precipitate was completely dissolved. Ammonia (35%) (NH3, Merck) was added to the obtained solution at room temperature to increase the pH to a value of ∼6.8. Since this process is exothermic, the solution was cooled to room temperature before finally adjusting the pH to 7. Inductively coupled plasma-atomic emission spectroscopy (ICP-AES, Optima 3300 DV, PerkinElmer) was used to measure the metal ion concentration in both mono-ion solutions and to determine the exact volumetric mixing ratio required. A varying amount of ammonium nitrate (NH4NO3, Merck Millipore) was dissolved in the mixed Li–Ti precursor solution.
1 molar ratio together with 40 mL water. This mixture was refluxed at 80 °C until the precipitate was completely dissolved. Ammonia (35%) (NH3, Merck) was added to the obtained solution at room temperature to increase the pH to a value of ∼6.8. Since this process is exothermic, the solution was cooled to room temperature before finally adjusting the pH to 7. Inductively coupled plasma-atomic emission spectroscopy (ICP-AES, Optima 3300 DV, PerkinElmer) was used to measure the metal ion concentration in both mono-ion solutions and to determine the exact volumetric mixing ratio required. A varying amount of ammonium nitrate (NH4NO3, Merck Millipore) was dissolved in the mixed Li–Ti precursor solution.
An overview of the various precursors presented in this paper is given in Table 2.
| Precursor | Li+![[thin space (1/6-em)]](https://www.rsc.org/images/entities/char_2009.gif) : :![[thin space (1/6-em)]](https://www.rsc.org/images/entities/char_2009.gif) Ti4+ ratio Ti4+ ratio |
Total metal ion concentration (M) | NH4NO3 (mol L−1) |
|---|---|---|---|
| LiTi | 4![[thin space (1/6-em)]](https://www.rsc.org/images/entities/char_2009.gif) : :![[thin space (1/6-em)]](https://www.rsc.org/images/entities/char_2009.gif) 5 5 |
0.8 | 0 |
| LiTiAN(a) | 4![[thin space (1/6-em)]](https://www.rsc.org/images/entities/char_2009.gif) : :![[thin space (1/6-em)]](https://www.rsc.org/images/entities/char_2009.gif) 5 5 |
0.8 | 7.11 |
| LiTiAN(b) | 4![[thin space (1/6-em)]](https://www.rsc.org/images/entities/char_2009.gif) : :![[thin space (1/6-em)]](https://www.rsc.org/images/entities/char_2009.gif) 5 5 |
0.8 | 3.56 |
The multi-metal ion solutions were dried at 60 °C for 12 hours until the formation of a viscous gel occurred. The dried precursor samples were heated at 300 °C under oxygen atmosphere in a preheated tube furnace. After combustion of the samples, they were immediately removed from the furnace and further cooled to room temperature in ambient conditions.
2.2 Gel and powder characterisation
The thermal decomposition and thermal transitions of the dried precursor gels were studied by thermogravimetric analysis (TGA, TA instruments Q500) with coupled differential scanning calorimetry (TGA/DSC, TA instruments Q600). Analysis of the evolving gases during thermal treatment of the precursor gels was obtained using a TGA (Mettler-Toledo TGA/DSC 1) on-line coupled with a Fourier transform infrared spectrometer (FTIR, Bruker Vertex 70). The procedure consisted of loading 3–4 mg of the dried precursor sample into an alumina crucible and heating of the sample to 600 °C.Information on the phase composition of the synthesized powders was gained by powder X-ray diffraction (XRD) (Bruker D8) using CuKα radiation. Physical particle characterisation was done by transmission electron microscopy (TEM) (FEI Tecnai G2 Spirit Twin). After a sonication step of 30 seconds, a small drop of a suspension of the sample was casted on a carbon coated copper grid (EMS, FCF-200-Cu), after which the whole was dried overnight under an infrared lamp. The TEM was operated at 120 kV. Furthermore, the particle size was also determined by dynamic light scattering (DLS) (Brookhaven Zetapals/90Plus) using a suspension of 1 mg mL−1.
The electrochemical characteristics of the synthesized materials were assessed by assembling coin cells (type CR2025). The cathodes were produced by ball-milling a mixture of 80% active material with 10% carbon black (Super C65, Imerys) and 10% poly(vinylidene fluoride) (PVDF, Alfa Aesar) dissolved in N-methyl-2-pyrrolidone (NMP, Alfa Aesar, 99.0%+). This slurry was tape casted on a 25 μm thick copper foil and subsequently dried under vacuum at 110 °C. From this coated foil, with a loading of around 1 mg cm−2, punches were made, which were further dried under vacuum at 110 °C overnight. The coin cells were assembled in an argon-filled glovebox (Sylatech) using lithium metal as the anode, a 1 M solution of LiPF6 in EC/DEC (1![[thin space (1/6-em)]](https://www.rsc.org/images/entities/char_2009.gif) :
:![[thin space (1/6-em)]](https://www.rsc.org/images/entities/char_2009.gif) 1) (SoulBrain) as the electrolyte and a Celgard 2400 separator. Afterwards, these cells underwent galvanostatic cycling between 1 V and 2.5 V (vs. Li/Li+) and between 1.65 V and 2.5 V (vs. Li/Li+) for varying current densities in a BCS-805 (Bio-Logic). For the former test, five cycles were performed for each current density. The stability of the combustion-prepared samples was determined by performing 99 cycles at 1C. Furthermore, cyclic voltammetry (CV) was performed on the cells between 1 V and 2.5 V (vs. Li/Li+) at a scanning rate of 0.2 mV s−1 for 11 cycles.
1) (SoulBrain) as the electrolyte and a Celgard 2400 separator. Afterwards, these cells underwent galvanostatic cycling between 1 V and 2.5 V (vs. Li/Li+) and between 1.65 V and 2.5 V (vs. Li/Li+) for varying current densities in a BCS-805 (Bio-Logic). For the former test, five cycles were performed for each current density. The stability of the combustion-prepared samples was determined by performing 99 cycles at 1C. Furthermore, cyclic voltammetry (CV) was performed on the cells between 1 V and 2.5 V (vs. Li/Li+) at a scanning rate of 0.2 mV s−1 for 11 cycles.
3 Results and discussion
3.1 Precursor optimization
While the lactate groups will act as the fuel in this precursor, nitrate groups, originating from LiNO3 and NH4NO3 will act as the internal oxidizers. To investigate the effect of the amount of oxidizer in the system, and hence also of the fuel-oxidizer balance, different amounts of NH4NO3 were added to a Li–Ti-precursor solution and their effect on the thermal degradation of the samples was assessed. Ammonium nitrate is used because in principle, only H2O, N2 and CO2 are formed when it reacts with lactate groups. It is also widely available and inexpensive.29 The used amounts were based on a calculation proposed by Jain et al. (1981).30 This calculation, based on the amount of oxidative and reductive valencies, allows to calculate the theoretical amount of oxidizer necessary to balance the fuel and oxidizer amounts, thereby optimizing the exothermic reaction. Applying the calculation to the system described in this paper leads to the following stoichiometrically balanced equation:| 4LiNO3 + 5Ti(C3H5O3)3OH + 80NH4NO3 → Li4Ti5O12 + 200H2O + 45CO2 + 82N2 | (1) |
The relative amounts of reagents in precursor LiTiAN(a) correspond to this reaction equation. This approach assumes the complete combustion of the sample, along with the absence of byproduct formation. Furthermore, to apply this calculation to the Li+–Ti4+ system, ammonia is assumed to be completely removed during the drying of the precursor solution and all lactate groups are assumed to be complexed to Ti4+ ions. A precursor with balanced amounts of fuel and oxidizer is expected to be autocombustible, which means that the precursor can be combusted without any participation of the surrounding atmosphere. Furthermore, after the combustion reaction, no leftover fuel or oxidizer should be present. While this calculation provides a valuable means for estimating the relative amounts of fuel and oxidizer, real systems often present secondary phenomena, such as preliminary thermal degradation reactions of the fuel or of the oxidizer. This means that the relative amounts of fuel and oxidizer often require experimental optimization.
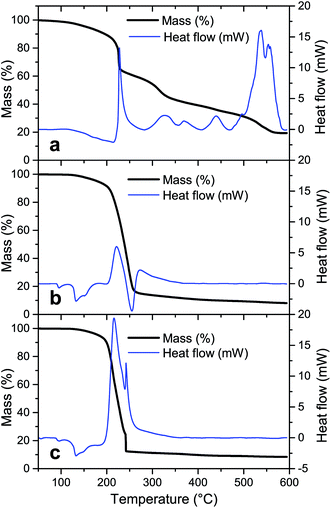
To evaluate the degradation process of the precursor without NH4NO3, the thermal decomposition profile of the sample LiTi is shown in Fig. 2a. The thermal decomposition profile under dry air shows several distinct steps that relate to exothermic or endothermic reactions, as shown by DSC. An exothermic reaction occurs at 230 °C, which relates to a sharp decrease in the sample weight. However, this reaction is not exothermic enough to trigger the complete conversion of the precursor sample, since this step only accounts for a mass loss of ∼15% of the initial sample weight. The sample is left with 65% of its initial weight, whilst theoretically, a complete conversion would lead to a residual mass of 23.8%. This means that the fuel is not completely degraded and the sample is left with amounts of incompletely oxidized fuel. These intermediate degradation products must be removed at higher temperatures. Indeed, at higher temperatures, mass is continuously lost from the sample, with slightly increased mass loss rates around temperatures of 320 °C and 540 °C. Here, the incomplete degradation products of the fuel are further degraded, as evidenced by TG-IR analysis, which showed the formation of predominantly CO2 at these temperatures (results not shown).
For the precursor LiTiAN(a), which contains the theoretically necessary amount of NH4NO3 to balance the fuel and oxidizer amount (Table 2), the thermal decomposition path under dry air shows a different profile (Fig. 2b). A broad endothermic process takes place at a temperature around 133 °C. This peak can be attributed to polymorph transitions of NH4NO3 and the melting of the precursor, as is clearly observed macroscopically when the precursor is heated on a hot plate.31 Between 200 °C and 300 °C, two broad exothermic events take place. These two peaks can also be interpreted as two superposed peaks, the broader one of which is exothermic whilst the other one is endothermic. The broad exothermic peak may be the result of the reaction between the fuel and oxidizer, whilst the endothermic peak may relate to the thermal degradation of an excess of NH4NO3, which is known to be degraded endothermically to NH3, NO2, H2O and O2 between 225 °C and 325 °C when heated at high heating rates.31 Since the exothermic reaction heats up the sample to a temperature higher than the temperature of the atmosphere in the TGA, the endothermic degradation of NH4NO3 in this sample may be observed here at lower measured temperatures than for pure NH4NO3. In this way, the endothermic degradation of the excess of oxidizer may counteract the combustion reaction, since heat cannot be accumulated. When the excess is almost entirely degraded, the overall process may become exothermic again, since less and finally no more heat can be extracted from the sample by NH4NO3. This is seen in Fig. 2b as a second exothermic peak around a temperature of ∼270 °C. Theoretically, complete conversion of the precursor sample would lead to a residual mass of 5.5% according to eqn (1). Since the actual residual mass after the biggest mass loss step is ∼16% of the initial mass, significant amounts of (degradation products of) fuel and oxidizer are still present in the sample at a temperature of 260 °C. After further heating to 600 °C, 8% of the initial mass is left in the sample. This means that certain degradation products are formed during the thermal treatment that can only be removed at higher temperatures. However, one should still be aware of the assumptions that were made in eqn (1), which render the correct calculation of the expected end mass more an estimation than a precise value. Instead, the calculation provides a convenient starting point for experimental optimization.
Since NH4NO3 can degrade endothermically and can capture heat, a more exothermic process might be occurring when the amount of added NH4NO3 in the precursor is reduced. Fig. 2c shows the thermal decomposition profile and corresponding DSC result of LiTiAN(b), which contains 50% of the amount of NH4NO3 added to LiTiAN(a). Also in this case, the precursor melts at a temperature around 133 °C. Mass is gradually lost between 190 °C and 240 °C. At a temperature of 241 °C, a high amount of mass is lost, as expected in a combustion reaction: the sample heats up to a very high temperature, thereby triggering the conversion of the sample, together with the inherent mass loss, in a very short time frame. This is also indicated by the occurrence of a sharp exothermic peak. After the combustion step, the sample contains 12% of its initial weight, with respect to 9% according to the theoretical calculation (with previously mentioned assumptions). This indicates that also in this case, there may be additional mass loss at higher temperatures, albeit to a lesser extent. At a temperature of 600 °C, the sample still contains 8.5% of its initial weight, which correlates reasonably well to the theoretical calculation.
Since the endothermic decomposition of NH4NO3 places severe restrictions on its use as an oxidizer, it cannot be used in the Li–Ti-system as sole oxidizer to balance the combustion reaction. In the precursor LiTiAN(b), only half of the theoretically necessary amount of NH4NO3 was used. This means that the missing oxidizing molecules must have been provided by the environment of the precursor, in this case, the oxygen present in the dry air flowing over the sample. Eqn (1) has to be altered to account for the reaction with molecular oxygen:
| 4LiNO3 + 5Ti(C3H5O3)3OH + 40NH4NO3 + 20O2→ Li4Ti5O12 + 120H2O + 45CO2 + 42N2 | (2) |
With the same assumptions which were previously mentioned. Molecular oxygen is present in the reaction equation, which means that the atmosphere and gas flow rate during thermal treatment will have an effect on the combustion reaction and thereby also on the product properties. The reaction is not an autocombustion reaction, where all reagents are present in the reagent mixture, but rather a mixed combustion reaction, since molecular oxygen, as additional oxidizer next to NH4NO3, has to be drawn from the atmosphere and is not present in the precursor itself.
3.2 Effect of atmosphere
Since molecular oxygen is present in eqn (2), the TG analysis of LiTi, LiTiAN(a) and LiTiAN(b) was performed again under oxygen flow. For both LiTi and LiTiAN(a), the thermogravimetric profiles (Fig. 3a and b, respectively) were very similar to their thermogravimetric profiles when heated under dry air (Fig. 2a and b, respectively).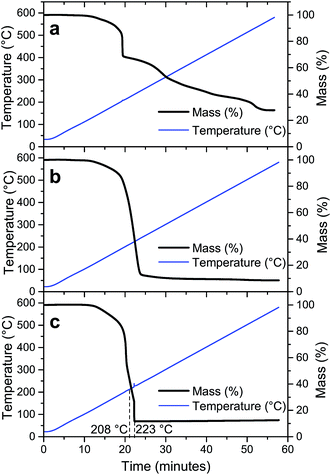 | ||
| Fig. 3 Thermal decomposition profiles of LiTi (a), LiTiAN(a) (b) and LiTiAN(b) (c). The samples were heated under oxygen atmosphere at 10 °C min−1. | ||
Fig. 3c shows the thermal decomposition profile of LiTiAN(b) treated under oxygen atmosphere. A sudden mass loss reaction occurs at a temperature of 223 °C, considerably lower than was the case for heating under dry air (Fig. 2c). Furthermore, at higher temperatures, there is no further mass loss. The exothermicity of the reaction is evidenced by the sudden increase of the observed temperature. These characteristics point at the adequacy of both precursor and processing parameters for combustion processing.
3.3 The role of ammonium nitrate in the precursor
In Section 3.1, it was mentioned that NH4NO3 can be degraded endothermically. This endothermic degradation may capture the heat generated during the exothermic reaction between fuel and oxidizer. If this is the case, the amount of NH4NO3 in the precursor has to be limited and additional oxidizing molecules may have to be drawn from the atmosphere, as was discussed in Section 3.2. To prove that these reactions are indeed taking place, the TGA of LiTiAN(b) under oxygen atmosphere was repeated with analysis of the evolving gases using FTIR.At 208 °C, the precursor is experiencing fast but gradual mass loss (Fig. 3c). The FTIR spectrum of the evolving gases at this temperature (Fig. 4a) shows the formation of H2O, CO2, NO2, N2O and NH3 as gaseous species. The presence of N2O in the exhaust gas could point at the occurrence of an exothermic reaction between lactates and the oxidizing nitrates, where the nitrate groups are not completely reduced to molecular nitrogen. This reaction also accounts for the formation of H2O and CO2.
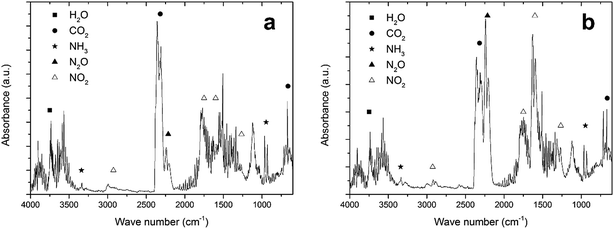 | ||
| Fig. 4 FTIR spectrum of the effluent gases of LiTiAN(b) at 208 °C (a) and 232 °C (b). The sample was heated under oxygen atmosphere at 10 °C min−1. | ||
However, ammonium nitrate can be degraded exothermally as well as endothermally:29,30
Endothermic
| NH4NO3 → NH3 + HNO3 | (3) |
| HNO3 → NO2 + ½H2O + ¼O2 | (4) |
Exothermic
| NH4NO3 → ½N2 + NO + 2H2O | (5) |
| NH4NO3 → N2O + 2H2O | (6) |
The formation of N2O can thus also be due to the exothermic degradation of NH4NO3. Both NH3 and NO2 were observed in the evolving gas, which can point to the endothermic decomposition of NH4NO3. Another explanation could be that ammonia, which is added during the precursor preparation, is evaporating, while NO2 can also be formed in the reaction between fuel and oxidizer, when the nitrates are incompletely reduced.
Also at 232 °C, when a high amount of mass is lost and the temperature in the sample rises quickly (Fig. 3c), the evolving gases were identified with FTIR (Fig. 4b). A large amount of N2O is formed, together with CO2 and H2O. These gases can be formed during a combustion reaction. While the relative amount of NO2 compared to CO2 in the evolving gas is higher compared to the case at 208 °C, the amount of NH3 (that may be formed during the endothermic degradation of NH4NO3) is lower. This might indicate that the endothermic degradation reaction does not significantly contribute to the formation of NO2. Since the exothermic degradation of NH4NO3 implies the presence of NO in the exhaust gas (reaction (5)), which is not detected in the FTIR spectrum, the generated heat may be developed during the reaction between fuel and oxidizer. This might indicate that a true combustion reaction is happening at this temperature, where the exothermic reaction heats up the sample to a high temperature at which the sample is completely converted to the product, while keeping the process temperature low.
Although it is not proven, since other endothermic reactions might take place (such as the decarboxylation of lactate groups, which would mean that N2O is formed during the exothermic decomposition of NH4NO3), the TG-IR results corroborate the hypothesis that was formulated in the beginning of this section: while NH4NO3 partakes in the exothermic reaction between fuel and oxidizer, it may also be degraded endothermically, thereby possibly acting as a retardant for the combustion reaction. This makes it necessary to carefully optimize the amount of NH4NO3 in the sample, but also to consider the atmosphere in which the reaction takes place, since additional oxidizing molecules may be necessary to design a complete combustion reaction.
3.4 Characterization of low-temperature synthesized LTO
In Section 3.3, an optimal combustion process was developed, according to thermogravimetry, when precursor LiTiAN(b) was heated under oxygen atmosphere. An annealing temperature of 300 °C was chosen. The resulting product was analysed using XRD, as shown in Fig. 5a.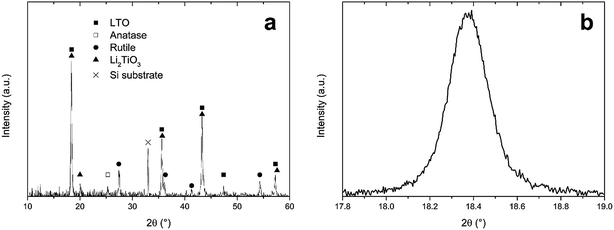 | ||
| Fig. 5 (a) X-ray diffraction pattern of precursor LiTiAN(b) after heat treatment in oxygen atmosphere at 300 °C, (b) excerpt of the same diffraction pattern. | ||
The X-ray diffraction pattern shows that LTO was formed, as evidenced by the peaks that are in agreement with the JCPDS standard for LTO (card no. 49-0207). The peaks at 2θ values of 18.4°, 35.6°, 43.3°, 47.4° and 57.3° are indexed as originating from the (111), (311), (400), (331) and (333) planes of the spinel structure of LTO with space group Fd3m. However, the peak at a 2θ value of 20.0° indicates that there was also the formation of an amount of Li2TiO3. This monoclinic structure with space group C2/c (JCPDS card no. 33-0831) also has peaks at 2θ values of 18.5°, 35.8°, 43.6° and 57.6°. This means that, due to the broadness of the peaks, it is impossible to discriminate between the peaks arising from the presence of LTO and those arising from the presence of Li2TiO3, as is proven in Fig. 5b, which shows the (111) peak of LTO. Next to the lithium-rich phase Li2TiO3, also anatase (JCPDS card no. 21-1272) and rutile (JCPDS card no. 21-1276) TiO2 were formed during the combustion process. The presence of anatase is evidenced by the peak at 25.3°. The peaks at 27.4°, 36.1°, 41.3° and 54.3° prove the formation of rutile. While rutile can accommodate only a small amount of Li (<0.1 Li per TiO2 unit) at room temperature, anatase can accommodate 0.6 lithium ions in LixTiO2 at 1.78 V vs. Li+/Li and is thus a performant anode material.32 This corresponds to a theoretical capacity of 201 mA h g−1.
TEM analysis (Fig. 6) shows that the thermally processed LiTiAN(b) is submicron sized: there are particles with a size as small as 200–300 nm, although also bigger particles are present with a size in the micrometer range. The particles are agglomerates of nanoparticles, resulting in a rough surface morphology.
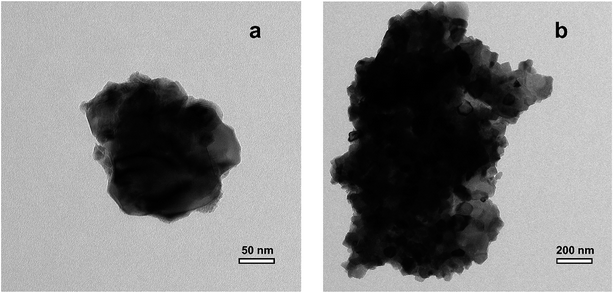 | ||
| Fig. 6 TEM images of LiTiAN(b) heat treated at 300 °C under oxygen atmosphere, (a) small agglomerate, (b) large agglomerate. | ||
The hydrodynamic particle size distribution of thermally processed LiTiAN(b) in oxygen atmosphere at 300 °C as determined by dynamic light scattering (Fig. 7) corroborates the conclusions from the TEM images: particles with a diameter of 200–300 nm are present, together with larger particles of about 1–2 μm. The absence of particles with a size in an intermediate range may signify that the larger particles are in fact agglomerates of the submicron particles.
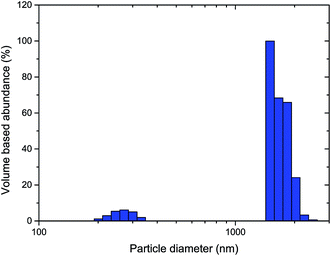 | ||
| Fig. 7 Particle size distribution of thermally processed LiTiAN(b) in oxygen atmosphere at 300 °C as determined by dynamic light scattering. | ||
3.5 Electrochemical characteristics of low-temperature synthesized LTO
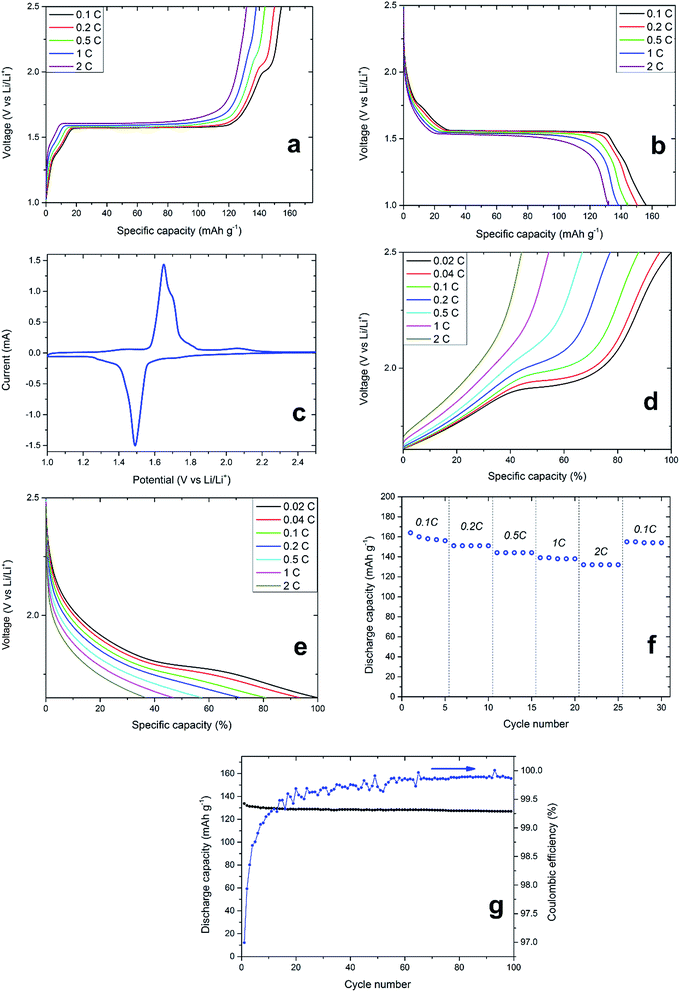
Thermally processed LiTiAN(b) in oxygen atmosphere at 300 °C was incorporated in a coin cell-type battery and subjected to galvanostatic cycling and CV between 1.0 and 2.5 V (vs. Li/Li+) to gain knowledge about its electrochemical characteristics and thus of its performance as an anode material. Fig. 8a and b show the variation of cell voltage with the amount of incorporated or extracted charge, and this for varying charge and discharge rates. A voltage plateau around 1.55 V, which is characteristic for LTO, is prominent at every current density, which proves that LTO is the main electrochemically active material present in the sample, thereby corroborating the interpretation of the XRD pattern. Two peaks relating to the oxidation and reduction of titanium ions in LTO are also prominent in the CV of the sample (Fig. 8c). The oxidation of Ti3+ ions and the related delithiation of Li7Ti5O12 occur at a voltage of 1.65 V, whereas the reduction of Ti4+ and lithiation of LTO occur at a voltage of 1.49 V (both at a scan rate of 0.2 mV s−1). At lower C-rates, electrochemical contributions of impurities can also be found in the galvanostatic charging profiles (Fig. 8a). When charging at a rate of 0.1C, a voltage plateau at approximately 2 V appears which can be related to anatase.33 The CV also shows a broad peak relating to the oxidation of anatase around a voltage of 2 V (Fig. 8c). With increasing charging rate, the plateau of anatase in the galvanostatic charging profile becomes smaller while shifting to higher potentials, ultimately disappearing at 2C (Fig. 8a). While the same effect can be observed for the LTO voltage plateau around 1.55 V, both the voltage plateau shift and reduction are less prominent. While the high-rate performance of LTO is limited by its low electronic conductivity of 10−13 S cm−1, this is typically not the case for anatase.34 Thus, the absence of electrochemical contribution of anatase in LiTiAN(b) cannot be explained by its electronic conductivity. From Fig. 8a and b, it is apparent that the amount of anatase in the sample is significantly smaller than the amount of LTO. This means that the anatase phase in the sample experiences a higher effective C-rate than was initially calculated. The applied current during galvanostatic cycling was calculated assuming a pure phase sample of LTO. Since the electrochemical reactions of LTO and anatase are separate in time, as shown by their distinct voltage plateaus, the same current is applied to lower amounts of material than it was intended for, resulting in an increased current density and thus a higher effective C-rate for each phase.35 Phases with a smaller weight contribution experience a higher effective C-rate. Take for example a sample consisting of two separate phases with the same capacity but reacting at different potentials. If the C-rate for the total sample is 1C, the effective C-rate for the first phase, providing 90% of the mass, would be 1.11C. For the second phase, contributing the remaining 10% of mass, the effective C-rate would be 10C. Applied to the system presented in this paper, anatase would experience a much higher C-rate than LTO, thereby explaining its poor rate performance.During charging at 0.1C, 20% of the total capacity is contributed between 1.65 V and 2.5 V. Since the anatase plateau lies in this voltage window, more information on the rate capability of the anatase fraction of the sample may be acquired by cycling between these limits (Fig. 8d and e). Although in this voltage range, the battery only shows 20% of its total capacity, the indicated C-rates are those corresponding to the full capacity of the battery, to make comparison more convenient. Thus, an indicated C-rate of 0.02C corresponds to an actual C-rate of 0.1C in this voltage range. As in Fig. 8a and b, the anatase plateau decreases and ultimately disappears at higher C-rates. When cycling at slower C-rates of 0.02C and 0.04C (corresponding to 0.1C and 0.2C for the capacity in this voltage range, respectively), the anatase plateau becomes more pronounced. This proves that the poor rate performance of the anatase fraction in the sample is due to the increased current density.
The specific discharge capacity of thermally processed LiTiAN(b) in relation to the cycle number and at different discharge rates is shown in Fig. 8f. In the first cycle, the material has a discharge capacity of 164 mA h g−1, which is close to the theoretical capacity of LTO of 175 mA h g−1. Due to irreversible reactions, this capacity drops to 156 mA h g−1 for the fifth cycle. The use of LTO is considered to avoid the formation of an SEI (solid electrolyte interface), since it is not cycled at voltages where electrolyte reduction typically occurs (∼0.7 V). He et al. (2013),36 however, reported that SEI formation can still occur for LTO at voltages higher than 1 V because of an interfacial reaction between the electrolyte and LTO. Powders with an irregular shape were shown to form an SEI within a small number of cycles. Thus, the capacity loss in the beginning of cycling might also be due to SEI formation. At discharge rates of 0.2C, 0.5C, 1C and 2C, the discharge capacities are respectively 151, 144, 139 and 132 mA h g−1. Cycling at higher rates does not damage the material, as the discharge capacity at 0.1C after cycling at 2C is comparable to that of the fifth cycle at 0.1C.
After 99 cycles at 1C, the synthesized material still shows 94.9% of its specific discharge capacity of the first cycle (Fig. 8g). Capacity loss mainly occurs during the first few cycles, as is also shown by the coulombic efficiency. The coulombic efficiency of the first cycle is 97.0% and this value follows an increasing trend during the subsequent cycles. After 50 cycles, the coulombic efficiency never falls below 99.7% and values of 99.9% are common. Thus, loss of capacity is mainly due to irreversible reactions occurring during the first cycles. A high stability is a typical property of LTO and the presence of impurities in the combustion-prepared samples does not appear to diminish this quality.
4 Conclusion
An LTO based anode material was synthesized at a significantly lower temperature (300 °C), with a shorter processing time (few minutes) and without further calcination steps, in comparison to the typical reported processing parameters (around 800 °C for hours), thereby avoiding high energy costs. The low temperature synthesis method required careful optimization of both precursor and processing parameters. The oxidizer in the precursor, NH4NO3, may degrade endothermically, thereby possibly capturing the heat released during the reaction between fuel and oxidizer, and therefore its amount must be limited. This means that experimental optimization of the oxidizer amount in the precursor was necessary. Since the limited amount of NH4NO3 cannot provide all the necessary oxidizing power for a complete combustion reaction, molecular oxygen is drawn from the atmosphere. Thermal processing of the precursor in oxygen atmosphere lead to an efficient combustion process. The synthesized product consisted of crystalline LTO with both lithium rich and lithium poor impurities. Particles of 200–300 nm and larger aggregates (1–2 μm) were determined to be present in the product. A high initial capacity of 164 mA h g−1 was found at 0.1C, dropping to 132 mA h g−1 at 2C. The main electrochemically active material in the product was determined to be LTO, with a small contribution of anatase. This small amount of anatase experiences a very high effective C-rate, resulting in a poor rate performance compared to LTO. This is an important consideration for future work performed on samples containing multiple phases. The material exhibited a high stability when cycled, with still 94.9% of the initial capacity after 99 cycles, with a coulombic efficiency of 99.9%.Acknowledgements
This work was supported by the FWO, the Research Foundation Flanders [project G041913N] and SBO project SOSLion (IWT-Flanders). This project receives the support of the European Union, the European Regional Development Fund ERDF [project 936], Flanders Innovation & Entrepreneurship and the Province of Limburg.References
- F. Cheng, J. Liang, Z. Tao and J. Chen, Adv. Mater., 2011, 23, 1695–1715 CrossRef CAS PubMed.
- International Energy Agency, 2016.
- V. Etacheri, R. Marom, R. Elazari, G. Salitra and D. Aurbach, Energy Environ. Sci., 2011, 4, 3243–3262 CAS.
- G. Sandí, J. New Mater. Electrochem. Syst., 2001, 265(4), 259–265 Search PubMed.
- J. R. Dahn, R. Fong and M. J. Spoon, Phys. Rev. B: Condens. Matter Mater. Phys., 1990, 42, 6424–6432 CrossRef CAS.
- P. G. Balakrishnan, R. Ramesh and T. Prem Kumar, J. Power Sources, 2006, 155, 401–414 CrossRef CAS.
- E. Ferg and R. Gummow, J. Electrochem. Soc., 1994, 141, 9–12 CrossRef.
- T. Ohzuku, J. Electrochem. Soc., 1995, 142, 1431 CrossRef CAS.
- T.-F. Yi, S.-Y. Yang and Y. Xie, J. Mater. Chem. A, 2015, 3, 5750–5777 CAS.
- J. Livage, M. Henry and C. Sanchez, Prog. Solid State Chem., 1988, 18, 259–341 CrossRef CAS.
- T. Yuan, R. Cai and Z. Shao, J. Phys. Chem. C, 2011, 4943–4952 CAS.
- S. W. Han, J. H. Ryu, J. Jeong and D. H. Yoon, J. Alloys Compd., 2013, 570, 144–149 CrossRef CAS.
- L. Cheng, J. Yan, G.-N. Zhu, J.-Y. Luo, C.-X. Wang and Y.-Y. Xia, J. Mater. Chem., 2010, 20, 595–602 RSC.
- D. Wang, X. Wu, Y. Zhang, J. Wang, P. Yan, C. Zhang and D. He, Ceram. Int., 2014, 40, 3799–3804 CrossRef CAS.
- C. Y. Lin and J. G. Duh, J. Alloys Compd., 2011, 509, 3682–3685 CrossRef CAS.
- Y. Wang, W. Zou, X. Dai, L. Feng, H. Zhang, A. Zhou and J. Li, Ionics, 2014, 20, 1377–1383 CrossRef CAS.
- T. F. Yi, S. Y. Yang, X. Y. Li, J. H. Yao, Y. R. Zhu and R. S. Zhu, J. Power Sources, 2014, 246, 505–511 CrossRef CAS.
- G. Yan, H. Fang, H. Zhao, G. Li, Y. Yang and L. Li, J. Alloys Compd., 2009, 470, 544–547 CrossRef CAS.
- R. B. Khomane, A. S. Prakash, K. Ramesha and M. Sathiya, Mater. Res. Bull., 2011, 46, 1139–1142 CrossRef CAS.
- M. Venkateswarlu, C. H. Chen, J. S. Do, C. W. Lin, T. C. Chou and B. J. Hwang, J. Power Sources, 2005, 146, 204–208 CrossRef CAS.
- H. Xiang, B. Tian, P. Lian, Z. Li and H. Wang, J. Alloys Compd., 2011, 509, 7205–7209 CrossRef CAS.
- J. Wang, X.-M. Liu, H. Yang and X. Shen, J. Alloys Compd., 2011, 509, 712–718 CrossRef CAS.
- T. Yuan, R. Cai, K. Wang, R. Ran, S. Liu and Z. Shao, Ceram. Int., 2009, 35, 1757–1768 CrossRef CAS.
- A. S. Prakash, P. Manikandan, K. Ramesha, M. Sathiya, J. M. Tarascon and A. K. Shukla, Chem. Mater., 2010, 22, 2857–2863 CrossRef CAS.
- K. C. Patil, Chemistry of Nanocrystalline Oxide Materials, World Scientific, 2008 Search PubMed.
- S. T. Aruna and A. S. Mukasyan, Curr. Opin. Solid State Mater. Sci., 2008, 12, 44–50 CrossRef CAS.
- W. Marchal, C. De Dobbelaere, J. Kesters, G. Bonneux, J. Vandenbergh, H. Damm, T. Junkers, W. Maes, J. D'Haen, M. K. Van Bael and A. Hardy, RSC Adv., 2015, 5, 91349–91362 RSC.
- C. De Dobbelaere, J. Mullens, A. Hardy and M. K. Van Bael, Thermochim. Acta, 2011, 520, 121–133 CrossRef CAS.
- C. Oommen and S. R. Jain, J. Hazard. Mater., 1999, 67, 253–281 CrossRef CAS PubMed.
- S. R. Jain, K. C. Adiga and V. R. Pai Verneker, Combust. Flame, 1981, 40, 71–79 CrossRef CAS.
- S. Biamino and C. Badini, J. Eur. Ceram. Soc., 2004, 24, 3021–3034 CrossRef CAS.
- D. Deng, M. G. Kim, J. Y. Lee and J. Cho, Energy Environ. Sci., 2009, 2, 818 CAS.
- Y.-M. Jiang, K.-X. Wang, H.-J. Zhang, J.-F. Wang and J.-S. Chen, Sci. Rep., 2013, 3, 3490 Search PubMed.
- S. Goriparti, E. Miele, F. De Angelis, E. Di Fabrizio, R. Proietti Zaccaria and C. Capiglia, J. Power Sources, 2014, 257, 421–443 CrossRef CAS.
- L. Yang, H. Z. Li, J. Liu, Y. Lu, S. Li, J. Min, N. Yan, Z. Men and M. Lei, J. Alloys Compd., 2016, 689, 812–819 CrossRef CAS.
- Y. B. He, M. Liu, Z. D. Huang, B. Zhang, Y. Yu, B. Li, F. Kang and J. K. Kim, J. Power Sources, 2013, 239, 269–276 CrossRef CAS.
| This journal is © The Royal Society of Chemistry 2017 |

