 Open Access Article
Evaluation of serum phosphopeptides as potential biomarkers of gastric cancer†
Guijin Zhaiad,
Liping Yangb,
Qun Luoac,
Kui Wu a,
Yao Zhaoa,
Jianan Liua,
Shaoxiang Xionga and
Fuyi Wang
 *ac
*ac
aBeijing National Laboratory for Molecular Sciences, National Centre for Mass Spectrometry in Beijing, CAS Key Laboratory of Analytical Chemistry for Living Biosystems, CAS Research/Education Center for Excellence in Molecular Sciences, Institute of Chemistry, Chinese Academy of Sciences, Beijing 100190, PR China. E-mail: fuyi.wang@iccas.ac.cn
bCancer Research Centre, Tumour Hospital Affiliated to Nantong University, Nantong 226361, Jiangsu, PR China. E-mail: liping.yang@ntu.edu.cn
cUniversity of Chinese Academy of Sciences, PR China
dDepartment of Biochemistry and Molecular Biology, Tianjin Key Laboratory of Medical Epigenetics, Tianjin Medical University, Tianjin, 300070, PR China
First published on 18th April 2017
Abstract
Gastric cancer (GC) is the fourth most commonly diagnosed cancer and the third leading cause of cancer-related deaths. Most GC deaths can be prevented by early diagnosis. However, biomarkers with high sensitivity and specificity are rare. Comprehensive serum phosphopeptides analysis may lead to the discovery of novel biomarkers for GC. In this work, we report a mass spectrometric strategy for the evaluation of serum phosphopeptides separated and enriched by ZrAs-Fe3O4@SiO2 nanoparticles. Four endogenous phosphopeptides in sera generated by degradation of fibrinogen were synthesized with light- and heavy-glycine residues, respectively, as external/internal standards, and used to gain multi-point standard calibration curves for absolute quantification of phosphopeptides by LC-ESI-MS following ZrAs-Fe3O4@SiO2 enrichment. The ESI-MS signal ratios of the four pairs of light-/heavy-phosphopeptide standards captured by ZrAs-Fe3O4@SiO2 from aqueous solutions are linearly correlated with the molar ratios of the “light” to “heavy” phosphopeptides over the range of 0.05–5 μM with an r2 of up to 0.998 and a slope of close to 1. The recovery of the four phosphopeptides spiked at low, medium and high levels in human sera were 94.7–107.5% with RSDs in the range of 0.6–8.2%. The validated method was utilized to measure the phosphopeptide levels of serum samples from 30 healthy persons and 60 GC patients. Receiver operating characteristic (ROC) analysis shows that one phosphopeptide (F3: DpSGEGDFLAEGGGVR) yields high sensitivity and specificity of 90.0% and 96.7%, respectively, in the validation set for discriminating GC patients from healthy controls. Overall, 53 of 60 GC cases and 29 of 30 controls were correctly classified, including eight of nine GC patients at stage I. These results suggest that F3 in sera may be a potential biomarker for GC diagnosis, particularly for early stage cases.
Introduction
Gastric cancer (GC) is the fourth most commonly diagnosed cancer and the third leading cause of cancer-related deaths. In 2008, approximately 9![[thin space (1/6-em)]](https://www.rsc.org/images/entities/char_2009.gif) 894
894![[thin space (1/6-em)]](https://www.rsc.org/images/entities/char_2009.gif) 600 new cancer cases of GC and 738
600 new cancer cases of GC and 738![[thin space (1/6-em)]](https://www.rsc.org/images/entities/char_2009.gif) 000 deaths as a consequence of this disease occurred worldwide.1 The five-year survival rate for GC patients identified at the early stage can be 90% or higher. Unfortunately, the majority of cases are diagnosed at later stages and the five-year survival rates are very low, typically less than 20 percent.2
000 deaths as a consequence of this disease occurred worldwide.1 The five-year survival rate for GC patients identified at the early stage can be 90% or higher. Unfortunately, the majority of cases are diagnosed at later stages and the five-year survival rates are very low, typically less than 20 percent.2
Cancer-specific biomarkers play important roles in cancer diagnosis and prognosis,3,4 as most cancer-related deaths can be prevented through early diagnosis and surgical removal of early stage cancer.5 The carcinoembryonic antigen (CEA) and carbohydrate antigen 19-9 (CA19-9) are recommended biomarkers for the detection and management of GC, even though these markers lack specificity and are not highly sensitive.6–8 Thus, it is in great demand to identify and characterize novel biomarkers for the early detection of GC.
Serum peptidome, which represents thousands of peptides produced by degradation of endogenous proteins by proteases or exoproteases,9–12 have recently been recognized as potential signature pool for cancers as the amount and repertoire of serum peptides change dynamically according to the physiological or pathological state of an individual.13–17 Moreover, post-translational modifications such as phosphorylation make the serum peptidome more esoteric because phosphorylation of proteins/peptides remains a critical role in a series of biological processes including growth, metabolism, differentiation and invasion of cells.18–21 Therefore, comprehensive analysis of serum phosphopeptides may lead to discovery of novel biomarkers or new diagnosis approaches.
Liquid chromatography coupled with mass spectrometry (LC-MS) approach was considered to be a valuable strategy for the simultaneous measurement of multiple phosphopeptides. However, mass spectrometric identification and quantification of serum phosphopeptides is a challenge due to the ion suppression effect of highly abundant proteins/nonphosphopeptides in serum. To be successful at this predicament, a number of strategies have been developed. Among them, immobilized metal affinity chromatography (IMAC) and metal oxide affinity chromatography (MOAC) have been proven to be highly applicable to phosphopeptides enrichment prior to MS analysis. IMAC, which relies on the specific affinity of the phosphate group to metal ions, is one of the widely used methods for phosphopeptides. However, the specificity of the IMAC is not very high since some non-phosphopeptides can also bind to the metal ions.22,23 To reduce the unexpected absorption of non-phosphopeptides, an alternative IMAC was developed by incorporating a flexible linker terminated with phosphonate groups that chelate zirconium or titanium ions. The chelated metal ions can achieve specifically binding to phosphopeptides.24 Recently, one of us developed a similar materials, ZrAs-Fe3O4@SiO2 nanoparticles,25 which show excellent and robust enrichment power for isolating phosphopeptides from complicated biological samples. The ZrAs-Fe3O4@SiO2 nanoparticles couple arsenate groups for chelation and immobilization of Zr4+ via coordination between Zr4+ and the As–O bond, which create a favorable structure orientation for the selective binding of phosphopeptides.24
Meanwhile, a number of approaches based on mass spectrometry have been developed for the quantification of serum phosphopeptides, and most are relative quantification. Recently, Zou and co-workers26 developed a type of modified phosphoric acid functionalized mesoporous organo-silica (EPO) nanomaterials as the adsorbent for in situ enrichment and isotopic labeling of endogenous phosphopeptides in serum. The subsequently relative MS quantification revealed differences in the abundance of the phosphopeptides between 10 hepatocellular cancer patients and 10 healthy controls. However, relative quantification of phosphorylation dynamics carries limited information about biological basal state. Acting as a clinical examination index, absolute level of site-specific phosphporylation is required. Therefore, a number of methods have been developed to establish absolute quantification of protein phosphorylation. Among them, AQUA27 is fairly straightforward. However, it relies on single-point calibration and may generate erroneous estimates if the endogenous peptides span a large dynamic range across various cases.28 Moreover, all these reports focused on the development of new quantification approaches for phosphopeptides but put less emphasis on the screening and discovery of reliable phosphopeptide biomarkers that can be applied for early detection of cancers.
We have previously developed an MS method for absolute quantification of endogenous phosphopeptides in serum in combination with enrichment by titania coated magnetic hollow mesoporous silica microspheres (TiO2/MHMSS) and stable isotopic acetyl labeling which carried out after phosphopeptide enrichment and separate processing. We found that the level of the phosphopeptide, DpSGEGDFLAEGGGVR, in the serum samples of gastric cancer patients is significantly down-regulated in comparison to that in the sera of healthy group.29 In the present work, in order to evaluate further serum phosphopeptides as biomarkers for diagnosis of GC cases, we develop a novel strategy for the mass spectrometric absolute quantification27,30,31 of phosphopeptides separated and enriched by ZrAs-Fe3O4@SiO2 nanoparticles. The four serum phosphopeptides, which were commonly identified in serum29,32 and generated from fibrinogen A,33 are chemically synthesized with and without incorporation of deuterated glycine residues as ideal external standards to gain multi-point standard calibration curves. The synthetic deuterium-labeled phosphopeptides of which the sequences match exactly to endogenous peptides are added to serum as internal standards before samples processing, which significantly improves the accuracy of the quantification of phosphopeptides. The absolute concentration of the four phosphopeptides in sera of 30 healthy persons as controls and 60 GC patients, which were randomly divided into training set and validation set and grouped according to the disease stages, were precisely measured by the developed method. Mann–Whitney analysis was employed to compare serum phosphopeptide levels of control and GC samples. Receiver operating characteristic (ROC) curves were used to evaluate the sensitivity and specificity of serum phosphopeptides as potential GC biomarkers.
Experimental
Reagents and material
The phosphopeptides DpSGEGDFLAEGGGV (F1), ADpSGEGDFLAEGGGV (F2), DpSGEGDFLAEGGGVR (F3) and ADpSGEGDFLAEGGGVR (F4), and the respective triply D2-glycine-incorporated phosphopeptides, designated as D6-F1–D6-F4, were synthesized by HysBio Ltd. (Beijing, China). Acetonitrile (ACN) was purchased from Tedia, trifluoroacetic acid (TFA) was obtained from Sigma-Aldrich (USA). The deionized water used in the experiments was prepared by a Milli-Q system (Millipore, Milford, MA).Titania coated magnetic mesoporous silica microspheres (TiO2/MHMSS) and zirconium arsenate-modified magnetic nanoparticles (ZrAs-Fe3O4@SiO2) were prepared following the methods described previously.25,34 The chemicals used for the fabrication of the microspheres and magnetic materials were purchased from Shanghai General Chemical Reagent Factory (Shanghai, China).
Participants
All procedures of this study involving human participants were performed according to the ethical standards with the Helsinki Declaration and the China's Ministry of Health “Ethical Review of Human Biomedical Research (Tentative, 2007)”. The study was approved by the Research Ethics Board of the Tumor Hospital Affiliated to Nantong University. Written informed consent was obtained from all human subjects included in the study.Serum samples of 30 healthy persons and 60 GC patients were collected at the Tumor Hospital Affiliated to Nantong University, from the year of 2011 to 2013. GC samples were obtained from patients before surgery, and all patients had pathologically verified GC by the Department of pathology in the tumor hospital. Controls were proven without any cancers before sample collection.
Blood collection
To minimize institutional bias attributable to sample handling, all samples were collected and handled with the same standard procedures. Briefly, all blood samples were collected in 7.0 mL glass red-top tubes (BD; 366431), allowed to clot at room temperature for 1 hour, and centrifuged at 2000g for 10 min at room temperature. Sera (upper phase) were then transferred to 1.5 mL cryovials with 1 mL serum in each and stored frozen at −80 °C until further use.Separation and enrichment of phosphopeptides
For capturing endogenous phosphopeptides from human serum, 10 μL of each serum sample was diluted with 80 μL 50% ACN/0.1% TFA. Subsequently the diluted serum sample was incubated with 10 μL of ZrAs-Fe3O4@SiO2 (30 mg mL−1) with vibration for 30 min, then the supernatant was removed by a magnet and the nanoparticles with captured phosphopeptides were then washed with 100 μL 50% ACN/0.1% TFA and 30% ACN/0.1% TFA in turn. Finally the bound peptides were eluted with 30 μL 2.5% ammonium hydroxide (pH 11.5) for 10 min. After separating the ZrAs-Fe3O4@SiO2 nanoparticles from the sample solution by applying an external magnet, the supernatant was collected and lyophilized to dryness. For comparison, TiO2/MHMSS was also used for phosphopeptides enrichment following the same procedure described above.Mass spectrometry
MALDI-TOF mass spectrometry analysis was performed on an Autoflex III mass spectrometer (Bruker, Germany) under positive-ion mode. The instrument was equipped with a delayed ion-extraction device and a pulsed nitrogen laser operating at 337 nm. Typically, 1200 scans were averaged. The MALDI uses a groundsteel sample target with 384 spots. For the analysis of phosphopeptides, 20 mg mL−1 2,5-dihydroxybenzoic acid (DHB) in 50% ACN/1% phosphoric acid was used as the matrix. An aliquot (3 μL) of samples was mixed with the matrix solution in a 1![[thin space (1/6-em)]](https://www.rsc.org/images/entities/char_2009.gif) :
:![[thin space (1/6-em)]](https://www.rsc.org/images/entities/char_2009.gif) 1 ratio prior to deposition onto the target plate for data collection. The Flexanalysis (ver. 3.0) software was used for analysis and post processing.
1 ratio prior to deposition onto the target plate for data collection. The Flexanalysis (ver. 3.0) software was used for analysis and post processing.
Positive-ion electrospray ionization mass spectrometry (ESI-MS) analysis was performed on a Micromass II Q-TOF mass spectrometer (Waters) coupled to a Waters CapLC system. The phosphopeptides captured from human serum samples were separated on a symmetry-C18 column (1.0 × 50 mm, 100 Å, 3.5 μm, waters). Mobile phases were A: 95% H2O containing 4.9% acetonitrile and 0.1% formic acid, and B: 95% acetonitrile containing 4.9% H2O and 0.1% formic acid. The peptides were eluted with a 30 min linear gradient from 1% to 80% of B at a rate of 30 μL min−1. The eluent was directly infused into the mass spectrometer through the ESI probe. The spray voltage of the mass spectrometer was 3.30 kV and the cone voltage 35 V. The desolvation temperature was 413 K and source temperature 353 K. Nitrogen was used as both cone gas and desolvation gas with a flow rate of 40 L h−1 and 400 L h−1, respectively. The collision energy was set up to 5 V. All spectra were acquired in the range of 500–2000 m/z. Mass Lynx (ver. 4.0) software was used for analysis and post processing.
Quantification of phosphopeptides
To generate the calibration curves for the absolute quantification of endogenous phosphopeptides in human serum, 5 μL of a solution containing D6-labeled phosphopeptides (D6-F1–D6-F4, 1 μM each) was mixed with equal volume of light phosphopeptide solution at different concentrations, giving rise to a series of standards with a gradient molar ratio (H6-Fi/D6-Fi) of 0.05, 0.1, 0.2, 0.5, 1, 2, 5, and then the resulting mixtures were diluted with 50% ACN–0.1% TFA to 100 μL. Subsequently, the enrichment by ZrAs-Fe3O4@SiO2 was performed for each standard sample prior to LC-MS analysis following the procedure described above. The peak intensity ratios of light-/heavy-peptide measured by LC-MS versus the respective molar ratios of light-/heavy-peptide were plotted and fitted to linear regression formula, generating calibration equation for each phosphopeptide. To determine endogenous phosphopeptides in human serum, 1 μL of standard solution containing D6-labled phosphopeptide standards (D6-F1–D6-F4, 5 μM each) was spiked into 10 μL of each serum sample, and then diluted with 89 μL 50% ACN-0.1% TFA. Subsequently the diluted serum sample was subject to ZrAs-Fe3O4@SiO2 separation and enrichment followed by LC-MS analysis. The peak intensity ratio of each endogenous phosphopeptide to respective heavy standard peptide was used to calculate its concentration in the serum sample using the established calibration equation.Statistical methods
Mann–Whitney analysis was used to compare serum phosphopeptide levels between controls and GC samples. Receiver operating characteristic (ROC) curves were plotted to evaluate the sensitivity and specificity of serum phosphopeptides as biomarkers predicting GC. A two-tailed P value less than 0.05 were considered to be statistically significant. All data analyses were performed using Origin (version 8) and SPSS 19.Study design
The general data flow for discovery and validation of biomarker clusters is shown in Fig. 1. The present work enrolled 60 GC cases and 30 healthy controls. The GC samples were randomly divided into training set (TS) and validating set (VS) to identify serum phosphopeptides as a surrogate biomarker for GC. In the analysis process, serum phosphopeptides were isolated and enriched using IMAC and subsequently identified and quantified by our developed method. Nonparametric test was used to compare serum phosphopeptides levels between the training set (40 GC cases) and healthy controls for the discovery of phosphopeptides that could distinguish the two groups significantly. ROC characterization was applied to refine and assess the screened phosphopeptides. Then, to assess accuracy of the serum phosphopeptides-based biomarkers in predicting GC, the validation set of subjects (20 GC cases) was analyzed by the same method.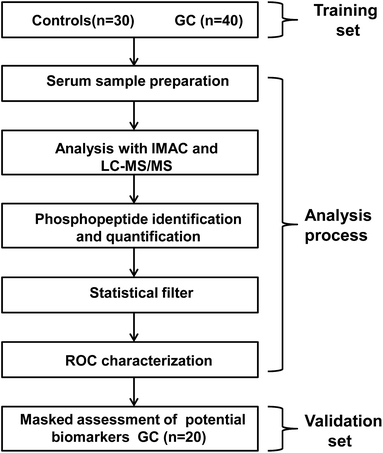 | ||
| Fig. 1 Schematic representation of sampling process and data acquirement and post analysis procedure in this work. | ||
Results and discussion
Comparison of ZrAs-Fe3O4@SiO2 and TiO2/MHMSS for enrichment of phosphopeptides
In previous reports, we used TiO2 coated magnetic hollow mesoporous silica spheres (TiO2/MHMSS)34 to isolate and enrich phosphopeptides from sera.29 However, the application of TiO2/MHMSS to capture phosphopeptides was not very satisfactory, perhaps due to the relatively lower efficiency of the TiO2/MHMSS materials for capturing the phosphopeptides in sera. Recently, Feng et al. have shown that zirconium arsenate-modified magnetic nanoparticles (ZrAs-Fe3O4@SiO2) had high selectivity for phosphopeptides and excellent capture capability towards multiply-phosphopeptides.25 Herein, to compare the enrichment selectivity and efficiency of TiO2/MHMSS and ZrAs-Fe3O4@SiO2, we used these two types of materials to separate and enrich phosphopeptides from human serum following the protocol described in the Experimental section. There are no phosphopeptide signals observed in the MALDI mass spectrum of the serum sample without enrichment (Fig. 2a). However, after enrichment by TiO2/MHMSS or ZrAs-Fe3O4@SiO2, four phosphopeptide ion peaks appear in both mass spectra as shown in Fig. 2b and c. The MS2 spectra (Fig. S1 in the ESI†) obtained by selecting the precursor ions at m/z 1389.3, 1460.4, 1545.5 and 1616.6 indicate that the four precursor ions correspond to the well-established phosphopeptides, DpSGEGDFLAEGGGV (F1), ADpSGEGDFLAEGGGV (F2), DpSGEGDFLAEGGGVR (F3) and ADpSGEGDFLAEGGGVR (F4), respectively. The phosphopeptides F1–F3, which are isoforms of the phosphorylated fibrinogen peptide A (FPA) designated as F4 herein, may be the degraded fragments from F4 by proteases.33 Compared the two mass spectra shown in Fig. 2b and c, we can see that the peak intensities of phosphopeptides enriched by ZrAs-Fe3O4@SiO2 are higher than those captured by TiO2/MHMSS enrichment, and that few nonphosphopeptide signals were observed in the former sample. These indicate that ZrAs-Fe3O4@SiO2 nanoparticles have higher selectivity and larger capacity than TiO2/MHMSS for separation and enrichment of phosphopeptides from human serum.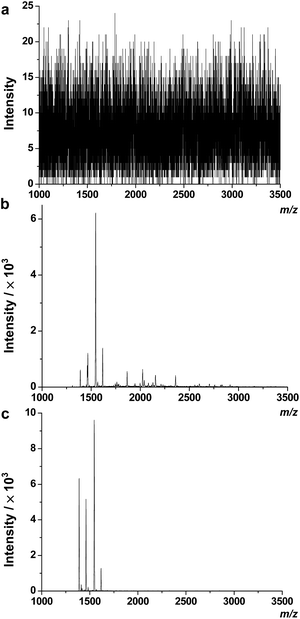 | ||
| Fig. 2 Mass spectra of phosphopeptides in human serum obtained by direct analysis (a) and after enrichment by TiO2/MHMSS (b) or ZrAs-Fe3O4@SiO2 nanoparticles (c). | ||
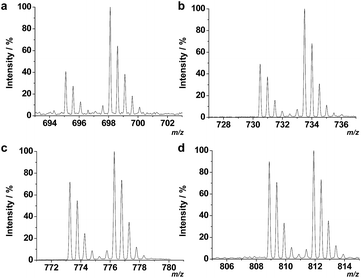
To further compare the performance of TiO2/MHMSS and ZrAs-Fe3O4@SiO2 for enrichment of the four phosphopeptides, we use both of the materials to trap the synthesized phosphopeptides from aqueous solutions. The same amount of the four H6- and D6-phosphopeptide standards were dissolved in deionized water, respectively, giving to light- and heavy-peptide mixtures containing 0.5 μM of each peptide. Then the light- and heavy-peptide mixtures were separated and enriched by TiO2/MHMSS and ZrAs-Fe3O4@SiO2, respectively, and the phosphopeptide eluents were isovolumetrically mixed and analyzed by LC-ESI-MS. Fig. 3 displays the mass spectra of the four pairs of light-/heavy-phosphopeptides in the final mixture. The signal intensities of D6-phosphopeptides enriched by ZrAs-Fe3O4@SiO2 were higher than respective H6-phosphopeptides captured by TiO2/MHMSS. In particular, the intensity of the heavy F1 is over twice as much as that of the light F1 (Fig. 3a). These again indicate that ZrAs-Fe3O4@SiO2 is more effective than TiO2/MHMSS for isolation and enrichment of phosphopeptides, thus was applied for the following experiments.
MS quantification of phosphopeptides in human serum
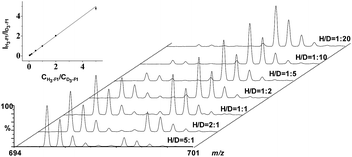
To generate calibration curves for the absolute quantification of the four endogenous phosphopeptides in serum, a series of solutions containing various concentrations of synthetic light phosphopeptides (H6-F1–H6-F4) were isovolumatically with a solution containing 0.5 μM of heavy phosphopeptides (D6-F1–D6-F4), and then individually incubated with ZrAs-Fe3O4@SiO2 for enrichment of the phosphopeptides. The eluents gave a series of standards with a molar ratio of H-pool/D-pool ranging from 0.05 to 5. Subsequently the calibration curve for each phosphopeptide was plotted by the intensity ratio of the most abundant isotopic peak of the H-/D-peptide versus their molar ratio, and the results are shown in Fig. 4 and S2–S4.† The linear regression analysis yielded the calibration equations with a slope close to 1 and an R2 of up to 0.998 (Table S1 in the ESI†). This suggests that the signal ratios of light/heavy pairs measured by ESI-MS allow accurate quantitative analysis of the phosphopeptides captured by ZrAs-Fe3O4@SiO2. The accuracy of the established method and its applicability was assessed by the recovery experiments, for which samples were prepared by spiking varying concentrations of synthetic light phosphopeptides and 0.5 μM of heavy phosphopeptides into a serum sample of healthy adults. The analytical recovery was calculated as the ratio of the determined light phosphopeptide concentration to that of the spiked concentration, and expressed as percentage. The results (Table 1) indicate that at the low (0.1 μM), mediate (0.5 μM) and high (1.5 μM) spiking levels, the recovery of the four phosphopeptides ranges from 94.7 to 107.5%. This implies the high accuracy of proposed method for determination of serum phosphopeptides and little interference from endogenous substances in serum samples was observed.35| Peptides | Original Conc./μM | Recovery (%, n = 3) for different spiking levels | ||
|---|---|---|---|---|
| 0.1 μM | 0.5 μM | 1.5 μM | ||
| F1 | 0.33 ± 0.02 | 99.5 ± 3.7 | 97.6 ± 5.2 | 107.0 ± 1.0 |
| F2 | 0.21 ± 0.02 | 97.6 ± 4.9 | 107.5 ± 6.9 | 97.9 ± 8.2 |
| F3 | 0.10 ± 0.01 | 97.6 ± 3.0 | 96.6 ± 0.6 | 95.2 ± 1.1 |
| F4 | 0.09 ± 0.01 | 94.7 ± 3.1 | 101.9 ± 6.0 | 96.4 ± 2.5 |
Evaluation of serum phosphopeptides as potential biomarkers for GC
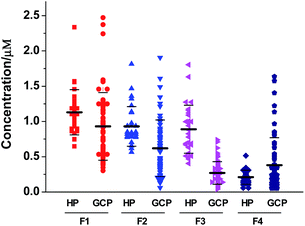
In a previous study, we have reported that the phosphopeptide F3 (DpSGEGDFLAEGGGVR) was significantly down-regulated in the sera of patients compared with healthy controls (20 GC cases vs. 20 controls).29 To further evaluate the potential of serum phosphopeptides as biomarkers for GC, we applied the proposed method described above to determine the concentration of phosphopeptides in serum samples collected from 30 healthy people and 60 GC patients. Table S2† summarizes the demographic data (ages and sex) for patients and healthy controls both overall and separately for the training set (TS) and validating set (VS). Although the participants were consecutively recruited, GC patients showed older than controls. However, there were no statistically significant differences between patients in the TS and VS. Tumor characteristics of the selected GC patients were also shown in Table S2.† Overall, the majority (81.7%) of GC cases were diagnosed in stages II, III and IV (49 of 60), and only 15% of GC cases were at stage I (9 of 60), and two patients remained in unknown tumor stage. There were no significantly statistical differences in disease characteristics between subjects in TS and VS.The synthesized hexa-deuterated phosphopeptides D6-F1–D6-F4 were spiked into the serum samples as an internal standard to achieve a final concentration of 0.5 μM. The mixtures were then incubated with ZrAs-Fe3O4@SiO2 for isolation and enrichment of phosphopeptides, followed by LC-ESI-MS analysis. The signal ratio of each phosphopeptide in the samples to respective D6-labeled internal was used to calculate its concentration following the corresponding equation listed in Table S1.† Every phosphopeptide level of each serum sample was the average of triple experiments. The results were diagrammatically shown in Fig. 5. On average, F1 shows the highest levels, comprising 42% of total phosphopeptides in sera of GC patients, and 36% in controls. The GC group showed significantly lower serum levels of F1, F2 and F3, compared with controls in both the TS and VS, but tended to have higher levels of F4 than the controls (Table 2).
| Training set (TS) | Validation set (VS) | P value (TS vs. VS for GC) | |||||||||
|---|---|---|---|---|---|---|---|---|---|---|---|
| Controls (n = 30) | GC (n = 40) | Mann Whitney P value | Controls (n = 30) | GC (n = 20) | Mann Whitney P value | ||||||
| Mean | SD | Mean | SD | Mean | SD | Mean | SD | ||||
| F1 | 1.13 | 0.32 | 0.93 | 0.42 | 0.01 | 1.13 | 0.32 | 0.94 | 0.61 | 0.04 | 0.57 |
| F2 | 0.93 | 0.28 | 0.60 | 0.32 | <0.001 | 0.93 | 0.28 | 0.66 | 0.53 | 0.02 | 0.83 |
| F3 | 0.89 | 0.34 | 0.28 | 0.16 | <0.001 | 0.89 | 0.34 | 0.26 | 0.18 | <0.001 | 0.55 |
| F4 | 0.21 | 0.10 | 0.38 | 0.38 | 0.21 | 0.21 | 0.10 | 0.38 | 0.42 | 0.77 | 0.64 |
The Mann–Whitney test was applied to evaluate the differences in the serum level of the four phosphopeptides between the healthy group and cancer patient groups. Compared with controls in both the TS and VS, F3 was significantly reduced (P < 0.001). In addition, F1 and F2 showed statistical differences (P < 0.05). However, F4 remained no significant difference (P > 0.05) (Table 2). Furthermore, statistical analysis was made for levels of phosphopeptides F1–F4 in the serum samples of GC cases between subjects in the TS and VS. The results indicate that there are no statistically significant differences between TS and VS subjects for the four phosphopeptides (P ≫ 0.05) (Table 2).
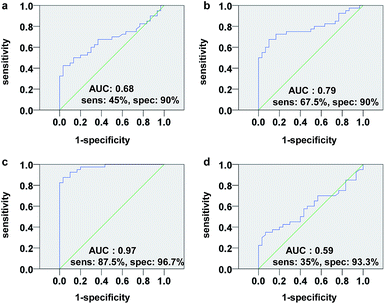
We next assessed the sensitivity and specificity of the phosphopeptides as potential biomarkers for GC diagnosis by receiver operating characteristic (ROC) analysis. The results showed that F3 has higher sensitivity (87.5%) and specificity (96.7%) than F1, F2 and F4 for GC cases in TS (Fig. 6). The discriminatory ability of F3 for GC case in VS is 90.0% and 96.7% (sensitivity and specificity, respectively). For all samples (TS + VS), F3 level was lower than the 0.46 μM cutoff value in 53 (88.3%) of 60 patients with GC, yielding a sensitivity and specificity of 88.3% and 96.7%, respectively (Fig. S5†). Encouragingly, the F3 level in sera was significantly reduced in eight (89%) of nine patients at stage I. In contrast, among the healthy controls, lowered F3 level was detected in only one (3.3%) of 30 individuals (Fig. 7).
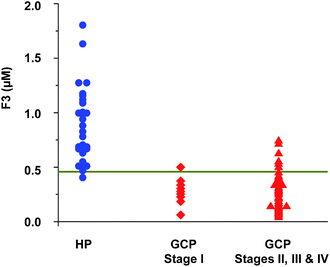 | ||
| Fig. 7 Phoshopeptide F3 level in serum samples of healthy persons (HPs) and gastric cancer patients (GCPs). The horizontal line denotes a cutoff of 0.46 μM for F3. | ||
Our study demonstrates herein that phosphopeptide F3 is significantly reduced in serum of GC patients compared with healthy controls, suggesting that F3 may represent potential biomarker for GC. When F3 was incorporated ROC analysis independently, GC could be distinguished from controls with 88.3% specificity and 96.7% sensitivity, in particular, correctly detected 8 of 9 early stage GC cases. This suggests its potential utility in diagnosing early-stage GC that may be amenable to surgical resection. However, the results are based on a limited participant set and further studies will be required to validate the diagnostic value of F3 for GC. In addition, the 0.46 μM cutoff value that used to classify GC cases and controls needs to be optimized in the forthcoming large-scale studies.
In our study, the down-expressed F3, which was inconsistent with Zou's reports about hepatocellular carcinoma,32 may be specific for GC. However, more patients with other type of cancers are required to proven this speculation. In addition, the decreased F3 levels may reflect inflammatory dynamic, which may contribute to the increased risk of developing cancer.36 Thus, a further study to evaluate the difference between the serum level of F3 in inflammatory and GC patients is needed in the future research.
The precise mechanism that F3 levels become reduced in cases of GC remains unclear. F3 is derived from naturally occurring serum peptides, fibrinopeptide A (FPA), which is generated from N terminally cleaved from fibrinogen by thrombin to form fibrin.33 Recent studies have established tumor-specific serum peptidome patterns due to differential exoprotease activities.11 Ebert and coworkers have reported that the levels of FPA, which reflected expression and activity of thrombin and proteases and implicated in tumor biology, elevated in gastric cancer sera. Moreover, FPA may exert direct tumor-promoting effects through its function as a mitogen for endothelial cells and fibroblasts.37 Therefore, F3 may represent the expression and activity of enzymes including kinases, phosphatases, endoproteases and exoproteases in serum of individuals. Again, further studies are requested to confirm the mechanisms causing decrease in serum level of F3 in cases developing GC.
Conclusions
In this work, we have developed a mass spectrometric strategy for the absolute quantification and evaluation of serum phosphopeptides as potential biomarkers for gastric cancer. In comparison with the previous reports, our strategy has several advantages. Firstly, we used magnetic ZrAs-Fe3O4@SiO2 nanoparticles to isolate and enrich phosphopeptides in sera, promoting the specificity and efficiency of phosphopeptide enrichment. Secondly, the four phosphopeptides commonly identified in serum and generated from fibrinogen A were chemically synthesized with incorporation of light- and heavy-glycine residues to serve as external and internal standards for gaining calibration curves and the subsequently quantification of phosphopeptides by LC-ESI-MS. This significantly improved the accuracy of the absolute quantification of phosphopeptides. Thirdly, more serum samples were clinically collected, grouped according to the disease stage, and randomly divided to training set and validation set, making the evaluation of serum phosphopeptides as biomarkers to GC more valuable. Our studies revealed that one phosphopeptide, DpSGEGDFLAEGGGVR (F3), yields high sensitivity and specificity (both > 90%) for discriminating GC patients from healthy controls. Overall, 53 of 60 GC cases and 29 of 30 controls were correctly classified, including 8 of 9 GC patients at stage I. These results indicate that reduced F3 level in sera may be a potential biomarker for GC, even for GC in early stage, though the relationship between F3 and GC development and the potency of F3 as a biomarker for GC diagnosis still need further validation in larger populations.Acknowledgements
We thank NSFC (Grant No. 21135006, 21127901, 21575145 and 21321003), the 973 Program of MOST (2013CB531805) and research funding of Tianjin Medical University (2110/2JC065, 2110/2JC15208) for support, and Prof. Yu-Qi Feng at Wuhan University for help in the preparation of the ZrAs-Fe3O4@SiO2 nanoparticles.Notes and references
- A. Jemal, F. Bray, M. M. Center, J. Ferlay, E. Ward and D. Forman, Ca-Cancer J. Clin., 2011, 61, 69–90 CrossRef PubMed.
- A. Jemal, T. Murray, E. Ward, A. Samuels, R. C. Tiwari, A. Ghafoor, E. J. Feuer and M. J. Thun, Ca-Cancer J. Clin., 2005, 55, 10–30 CrossRef PubMed.
- D. D. Sin, C. M. Tammemagi, S. Lam, M. J. Barnett, X. B. Duan, A. Tam, H. Auman, Z. D. Feng, G. E. Goodman, S. Hanash and A. Taguchi, J. Clin. Oncol., 2013, 31, 4536–4543 CrossRef PubMed.
- J. Xu, Y. H. Chen, R. P. Zhang, Y. M. Song, J. Z. Cao, N. Bi, J. B. Wang, J. M. He, J. F. Bai, L. J. Dong, L. H. Wang, Q. M. Zhan and Z. Abliz, Mol. Cell. Proteomics, 2013, 12, 1306–1318 CAS.
- J. Yee, M. D. Sadar, D. D. Sin, M. Kuzyk, L. Xing, J. Kondra, A. McWilliams, S. F. P. Man and S. Lam, J. Clin. Oncol., 2009, 27, 2787–2792 CrossRef CAS PubMed.
- L. Liu, B. Yan, J. L. Huang, Q. H. Gu, L. N. Wang, M. Fang, J. P. Jiao and X. Q. Yue, PLoS One, 2013, 8, e77821 CAS.
- A. Tocchi, G. Costa, L. Lepre, G. Liotta, G. Mazzoni, A. Cianetti and P. Vannini, J. Cancer Res. Clin. Oncol., 1998, 124, 450–455 CrossRef CAS PubMed.
- N. Oue, K. Sentani, T. Noguchi, S. Ohara, N. Sakamoto, T. Hayashi, K. Anami, J. Motoshita, M. Ito, S. Tanaka, K. Yoshida and W. Yasui, Int. J. Cancer, 2009, 125, 2383–2392 CrossRef CAS PubMed.
- E. P. Diamandis, J. Proteome Res., 2006, 5, 2079–2082 CrossRef CAS PubMed.
- E. F. Petricoin, C. Belluco, R. P. Araujo and L. A. Liotta, Nat. Rev. Cancer, 2006, 6, 961–967 CrossRef CAS PubMed.
- J. Villanueva, D. R. Shaffer, J. Philip, C. A. Chaparro, H. Erdjument-Bromage, A. B. Olshen, M. Fleisher, H. Lilja, E. Brogi, J. Boyd, M. Sanchez-Carbayo, E. C. Holland, C. Cordon-Cardo, H. I. Scher and P. Tempst, J. Clin. Invest., 2006, 116, 271–284 CAS.
- J. Villanueva, A. Nazarian, K. Lawlor and P. Tempst, Nat. Protoc., 2009, 4, 1167–1183 CrossRef CAS PubMed.
- K. He, X. Y. Wen, A. L. Li, T. Li, J. Wang, H. X. Wang and N. Wang, PLoS One, 2013, 8, e63724 CAS.
- L. A. Liotta and E. F. Petricoin, J. Clin. Invest., 2006, 116, 26–30 CrossRef CAS PubMed.
- J. Villanueva, A. J. Martorella, K. Lawlor, J. Philip, M. Fleisher, R. J. Robbins and P. Tempst, Mol. Cell. Proteomics, 2006, 5, 1840–1852 CAS.
- G. M. Fiedler, A. B. Leichtle, J. Kase, S. Baumann, U. Ceglarek, K. Felix, T. Conrad, H. Witzigmann, A. Weimann, C. Schutte, J. Hauss, M. Buchler and J. Thiery, Clin. Cancer Res., 2009, 15, 3812–3819 CrossRef CAS PubMed.
- K. Ueda, N. Saichi, S. Takami, D. Kang, A. Toyama, Y. Daigo, N. Ishikawa, N. Kohno, K. Tamura, T. Shuin, M. Nakayama, T. A. Sato, Y. Nakamura and H. Nakagawa, PLoS One, 2011, 6, e18567 CAS.
- T. Hunter, Cell, 2000, 100, 113–127 CrossRef CAS PubMed.
- S. Zanivan, A. Meves, K. Behrendt, E. M. Schoof, L. J. Neilson, J. Cox, H. R. Tang, G. Kalna, J. H. van Ree, J. M. van Deursen, C. S. Trempus, L. M. Machesky, R. Linding, S. A. Wickstrom, R. Fassler and M. Mann, Cell. Rep., 2013, 3, 552–566 CrossRef CAS PubMed.
- T. F. Yi, B. Zhai, Y. H. Yu, Y. Kiyotsugu, T. Raschle, M. Etzkorn, H. C. Seo, M. Nagiec, R. E. Luna, E. L. Reinherz, J. Blenis, S. P. Gygi and G. Wagner, Proc. Natl. Acad. Sci. U. S. A., 2014, 111, E2182–E2190 CrossRef CAS PubMed.
- J. V. Olsen, M. Vermeulen, A. Santamaria, C. Kumar, M. L. Miller, L. J. Jensen, F. Gnad, J. Cox, T. S. Jensen, E. A. Nigg, S. Brunak and M. Mann, Sci. Signaling, 2010, 3, ra3 CrossRef PubMed.
- H. Zhou, M. Ye, J. Dong, G. Han, X. Jiang, R. Wu and H. Zou, J. Proteome Res., 2008, 7, 3957–3967 CrossRef CAS PubMed.
- Y. Li, D. Qi, C. Deng, P. Yang and X. Zhang, J. Proteome Res., 2008, 7, 1767–1777 CrossRef CAS PubMed.
- H. J. Zhou, M. L. Ye, J. Dong, E. Corradini, A. Cristobal, A. J. R. Heck, H. F. Zou and S. Mohammed, Nat. Protoc., 2013, 8, 461–480 CrossRef CAS PubMed.
- X. S. Li, L. D. Xu, G. T. Zhu, B. F. Yuan and Y. Q. Feng, Analyst, 2012, 137, 959–967 RSC.
- H. Q. Qin, F. J. Wang, P. Y. Wang, L. Zhao, J. Zhu, Q. H. Yang, R. A. Wu, M. L. Ye and H. F. Zou, Chem. Commun., 2012, 48, 961–963 RSC.
- S. A. Gerber, J. Rush, O. Stemman, M. W. Kirschner and S. P. Gygi, Proc. Natl. Acad. Sci. U. S. A., 2003, 100, 6940–6945 CrossRef CAS PubMed.
- T. G. Curran, Y. Zhang, D. J. Ma, J. N. Sarkaria and F. M. White, Nat. Commun., 2015, 6, 5924 CrossRef PubMed.
- G. J. Zhai, X. Y. Wu, Q. Luo, K. Wu, Y. Zhao, J. A. Liu, S. X. Xiong, Y. Q. Feng, L. P. Yang and F. Y. Wang, Talanta, 2014, 125, 411–417 CrossRef CAS PubMed.
- D. S. Kirkpatrick, S. A. Gerber and S. P. Gygi, Methods, 2005, 35, 265–273 CrossRef CAS PubMed.
- O. P. Bondar, D. R. Barnidge, E. W. Klee, B. J. Davis and G. G. Klee, Clin. Chem., 2007, 53, 673–678 CAS.
- L. H. Hu, H. J. Zhou, Y. H. Li, S. T. Sun, L. H. Guo, M. L. Ye, X. F. Tian, J. R. Gu, S. L. Yang and H. F. Zou, Anal. Chem., 2009, 81, 94–104 CrossRef CAS PubMed.
- H. H. Seydewitz, F. R. Matthias, T. H. Schondorf and I. Witt, Thromb. Res., 1987, 46, 437–445 CrossRef CAS PubMed.
- J. H. Wu, X. S. Li, Y. Zhao, Q. A. Gao, L. Guo and Y. Q. Feng, Chem. Commun., 2010, 46, 9031–9033 RSC.
- I. A. Darwish, T. A. Wani, N. Y. Khalil and D. A. Blake, Talanta, 2012, 97, 499–504 CrossRef CAS PubMed.
- E. M. El-Omar, K. Oien, L. S. Murray, A. El-Nujumi, A. Wirz, D. Gillen, C. Williams, G. Fullarton and K. E. L. McColl, Gastroenterology, 2000, 118, 22–30 CrossRef CAS.
- M. P. A. Ebert, D. Niemeyer, S. O. Deininger, T. Wex, C. Knippig, J. Hoffmann, J. Sauer, W. Albrecht, P. Malfertheiner and C. Rocken, J. Proteome Res., 2006, 5, 2152–2158 CrossRef CAS PubMed.
Footnote |
| † Electronic supplementary information (ESI) available. See DOI: 10.1039/c7ra00827a |
| This journal is © The Royal Society of Chemistry 2017 |

