
 Open Access Article
 This Open Access Article is licensed under a
 Creative Commons Attribution 3.0 Unported Licence
A facile strategy for the synthesis of a NaREF4-gold nanocomposite as a dual-modal bioimaging agent†
Bin Shen ,
Yilin Gao,
Qingyun Liu,
Shengming Cheng,
Wei Feng* and
Fuyou Li*
,
Yilin Gao,
Qingyun Liu,
Shengming Cheng,
Wei Feng* and
Fuyou Li*
Department of Chemistry, The State Key Laboratory of Molecular Engineering of Polymers, Institute of Biomedicine Science, Collaborative Innovation Center of Chemistry for Energy Materials, Fudan University Shanghai, 200433, P. R. China. E-mail: fyli@fudan.edu.cn; fengweifd@fudan.edu.cn
First published on 18th April 2017
Abstract
In this article, a facile strategy is developed to synthesize a nanocomposite containing both a rare earth doped upconversion nanoparticle (RE-UCNP) and gold nanoparticles (GNPs). Such a nanocomposite can serve as a dual-modal imaging agent for upconversion luminescence (UCL) imaging and photoacoustic tomography (PAT). High spatial resolution, 3-dimensional imaging of blood vessels could be achieved with the RE-UCNP/GNPs@SiO2 nanocomposite by PAT, while UCL imaging offers a high-speed, low-interference and 2-dimensional imaging mode.
1 Introduction
Non-invasive imaging has become a useful tool for bioimaging, detection and medical diagnosis.1–8 To date, lots of non-invasive imaging techniques, including fluorescence imaging,9 magnetic resonance imaging (MRI),10 X-ray computed tomography (CT),11 positron emission tomography (PET),4,11,12 single-photon emission computed tomography (SPECT)12 and photoacoustic tomography (PAT),13,14 have been developed. As every single technique has its own limits (e.g., spatial resolution, imaging depth and scanning speed), developing multimodal non-invasive imaging is of great importance to combine the merits of individual imaging techniques.Among the optical imaging agents, rare-earth doped upconversion nanoparticles (RE-UCNPs) are unique imaging agents because of their upconversion emission. Upconversion luminescence (UCL) of the RE-UCNPs features large anti-stokes shift which can effectively avoid the auto-fluorescence interferences of bio-samples. Under the excitation of a near infrared continuous-wave laser source, RE-UCNPs can emit light ranging from ultraviolet to near-infrared. Benefiting from the versatile rare earth elements, RE-UCNPs can be easily functionalized with suitable rare earth ions for multimodal imaging. For instance, the Gd3+-doped RE-UCNPs were demonstrated to be potential MRI contrast agents and the radioisotope 153Sm-doped RE-UCNPs were used as gamma-emitting tracers in SPECT.15–17 Due to the high atomic number of the lanthanide ions embedded, RE-UCNPs can absorb X-rays efficiently and be directly used as CT contrast agents.
PAT is an emerging non-radiative and versatile technique for bioimaging ranging from organelles to organs.18 This emerging technology overcomes the high degree of scattering of optical photons in biological tissue by making use of the photoacoustic effect. The combination of PAT and UCL may be endowed with high scanning speed and high spatial resolution with no radiation risk. It is hard to realize PAT with RE-UCNP alone since RE-UCNPs do not have significant absorption band from visible to near infrared. Gold nanoparticles (GNPs) have a strong and tuneable extinction band ranging from visible to near infrared area and are widely used in photothermal treatment and photoacoustic imaging.19–21 Thus a nanocomposite containing RE-UCNP and GNPs may be an ideal dual-modal agent for PAT and UCL imaging. Herein we developed a strategy for the synthesis of RE-UCNP/GNPs@SiO2 nanocomposite. A layer of porous silica was initially coated on the RE-UCNPs (NaREF4). With the functional groups inside the silica pores, GNPs nucleated in the pores through in situ reduction of HAuCl4. The silica layer can bind the two kinds of nanoparticles tightly and also provide an inert and biocompatible surface.
2 Results and discussion
2.1 Preparation of RE-UCNP/GNPs@SiO2 nanocomposite
The synthesis route of RE-UCNP/GNPs@SiO2 nanocomposite is depicted in Fig. 1. Tm3+ and Yb3+ co-doped NaYF4 nanoparticles were synthesized via a modified method reported by Zhang et al.22 Then the as-prepared RE-UCNPs were coated with silica through a modified water-in-oil microemulsion method. Two different kinds of silica layers were coated on the nanoparticles successively. The inner layer of silica was alkylamino-functionalized organic silica, co-condensed from tetraethyl orthosilicate (TEOS) and N-[3-(trimethoxysilyl)propyl]ethylenediamine (TSD). The outer layer was hydrolysed from TEOS to form a compact, hydrophilic and bio-compatible layer. As shown in Fig. 2, transmission electron microscopy (TEM) images show that the as-prepared nanoparticles (NaYF4:Yb,Tm) are in uniform shape and have the average diameter of 24 nm.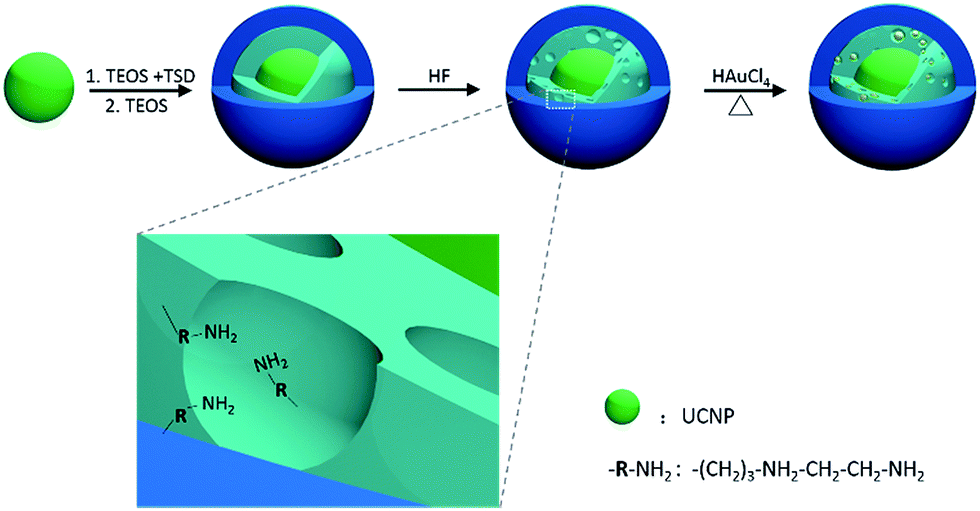 | ||
| Fig. 1 Schematic representation showing the synthesis strategy of the RE-UCNP/GNPs@SiO2 nanocomposite. | ||
 | ||
| Fig. 2 TEM images of (a) RE-UCNP; (b) RE-UCNP@NH2–SiO2@SiO2; (c) RE-UCNP@porous-NH2–SiO2@SiO2; (d and e) RE-UCNP/GNPs@SiO2. Scale bar: (a–d) 100 nm, (e) 10 nm. | ||
Upon successive silica-coating, UCNP@NH2–SiO2@SiO2 nanocomposite was synthesized and the silica layer can be easily distinguished from the core by TEM. The as-prepared nanocomposites are ca. 50 nm in diameter (Fig. 2b). The nanocomposites were then etched with HF solution (10% wt.) with precise control. The inner layer, co-condensed from TSD and TEOS, is a loose organic–silica framework and can be selectively etched by HF.23,24
Through precise control, the inner layer of the silica was partially etched and tiny pores appeared within the outer-shell of silica after the HF treatment (Fig. 2c). The inner layer of the silica can be completely removed to form a yolk–shell structure if additional HF is added (Fig. S1a†). Excess HF would lead to the etch of the entire silica shell (Fig. S1b†). The alkylamino groups in the pores can serve as in situ reducing agents to form gold nanoparticles. The porous nanocomposites (UCNP@porous-NH2–SiO2@SiO2) were mixed with a proper amount of HAuCl4 and heated at 80 °C. As shown in Fig. 2d and e, GNPs can be clearly recognized within the silica layer in our nanocomposite by TEM. UV-Vis absorption spectra of the final composite (RE-UCNP/GNPs@SiO2) shows a wide absorption band from 500 nm to 850 nm, which is attributed to the absorption of aggregated-state gold nanoparticles in the nanocomposites (Fig. 3).25–27 Under the excitation of a 980 nm cw-laser source, intense UCL band at 800 nm (3H4 → 3H6) emitted by the nanocomposite could also be observed (Fig. 3). Dynamic light scattering (DLS) was performed to track the hydrated diameter and dispersity of our nanomaterial in each step (Fig. S2†). No significant change was observed in size and dispersity after GNPs-loading. The large cavity of yolk–shell structure, etched by additional HF, can also be utilized to grow and carry gold nanoparticles (Fig. S3†). EDXA and XRD were used to confirm the components of the as-synthesized nanocomposites (Fig. S4 and S5†). Compared to the UCNP/GNPs assembled by coordination interaction,28 the RE-UCNP/GNPs@SiO2 composite in the present work is supposed to be more stable and robust in tough conditions, since the GNPs were embedded within the silica layer.29–32
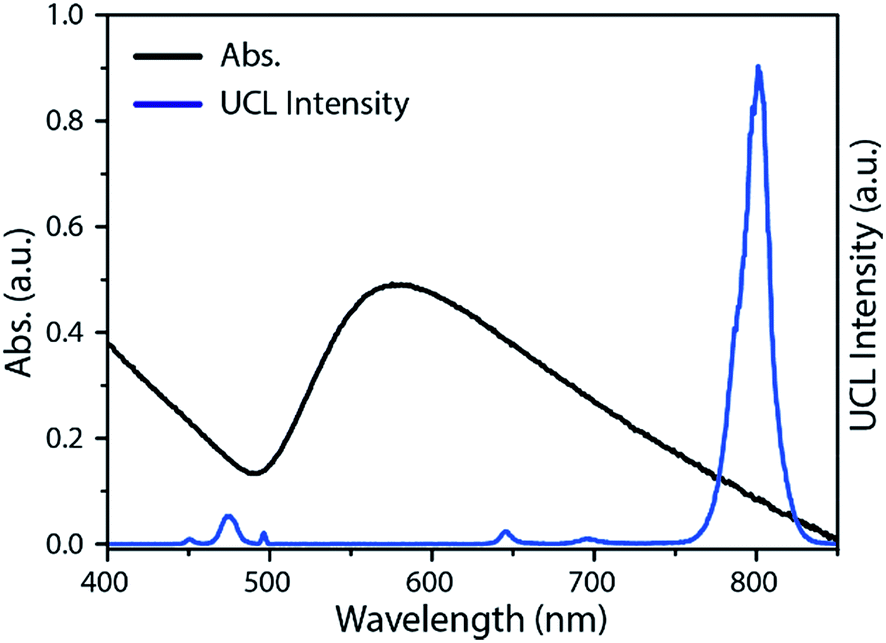 | ||
| Fig. 3 UV-Vis absorption spectra (black) and UCL spectra (blue) of RE-UCNP/GNPs@SiO2 nanocomposite. | ||
2.2 Photoacoustic tomography
To examine the viability of the as-prepared nanocomposites as PAT contrast agents, we initially performed in vitro PAT in an Eppendorf tube. The nanocomposites were dispersed in deionized water and tested. Another tube containing deionized water was tested as control.As shown in Fig. 4a, the photoacoustic signal can be clearly distinguished from the background while no signal was detected in the control test. Then we performed the in vivo PAT with an anesthetized Kunming mouse. Fig. 4b and c are selected slices of the three-dimensional reconstructed data of the thoracic cavity and abdomen with/without material. Before injection, only some main vessels could be vaguely recognized, as the hemoglobins are endogenous contrast agents of PAT. The same mouse was then injected with the nanocomposites intravenously. With the help of the nanocomposites, the photoacoustic signal was significantly enhanced. A clear view of the main vessels was obtained and branch vessels emerged. In the abdomen part, the injected one also had obvious improvements. The superficial epigastric arteries/veins lying on the liver were clearly imaged. Two lobes of the liver can be distinguished by the dark border in the middle. The 3D reconstruction data were collected and presented in ESI Movie 1.† In summary, RE-UCNP/GNPs@SiO2 nanocomposites significantly enhanced the signal of in vivo PAT.
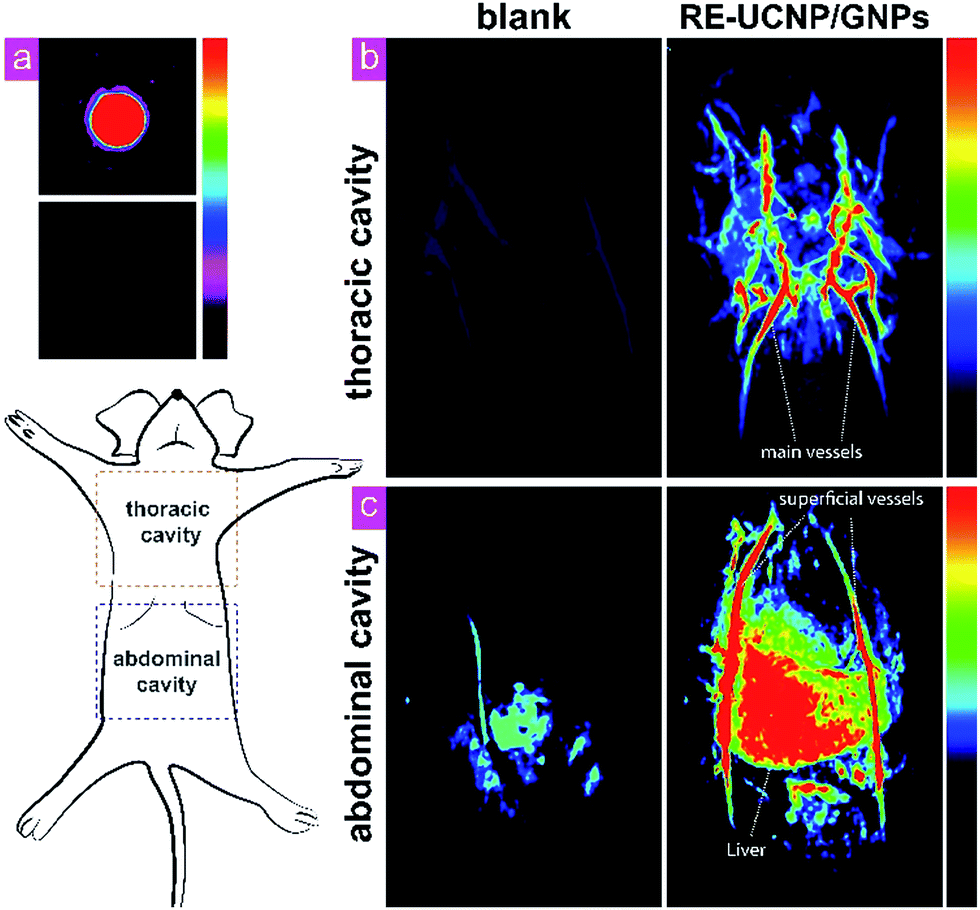 | ||
| Fig. 4 Selected scan slices of photoacoustic tomography of an anesthetized mouse. (a) In vitro test with RE-UCNP/GNPs@SiO2 (top) and water (bottom); in vivo imaging of (b) the thoracic cavity and (c) abdominal cavity. All the photoacoustic data were collected under the excitation of a 680 nm pulse light source. | ||
With the help of the such material, we obtained a stereoscopic view of the fine structure of liver, some major vessels as well as superficial vessels.
2.3 UCL imaging
To demonstrate the capability of the nanocomposite as a probe for UCL imaging, in vivo UCL imaging was carried out with the as-prepared nanocomposite. The nanocomposites were injected into a Kunming mouse by hypodermic injection. Under the excitation of an annular continuous-wave 980 nm laser source (30 mW cm−2), the UCL conversion signals at 800 ± 12 nm were collected. As shown in Fig. 5, UCL image with ultra-low auto-fluorescence interferences and high signal-to-noise ratio (SNR) was obtained. SNR here is defined as the ratio of the average value of the signal area (μsig) to the standard deviation of the background (σbg):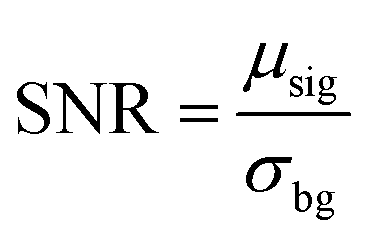
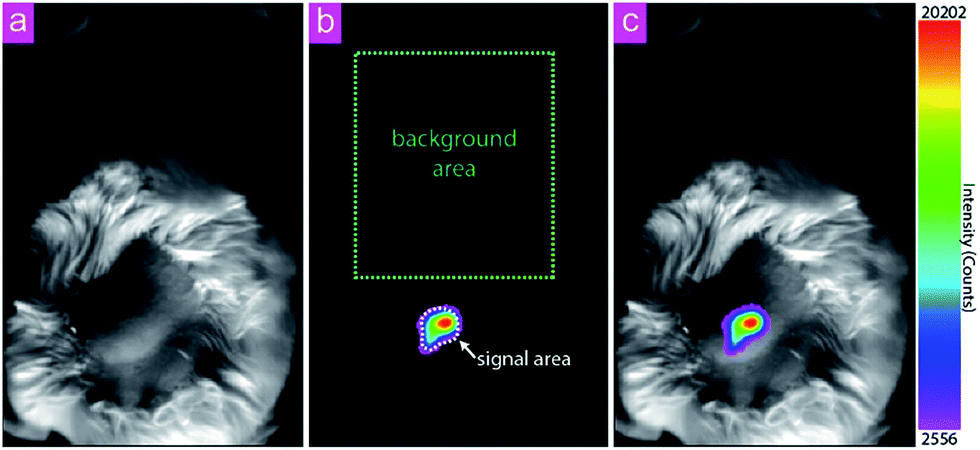 | ||
| Fig. 5 In vivo UCL imaging with RE-UCNP/GNPs@SiO2. (a) Bright field image; (b) UCL image with ROI areas. Signals were collected by band-pass filter at 800 ± 12 nm, excited with 980 nm laser source (30 mW cm−2); (c) merged image of bright field image and the UCL signals. | ||
The SNR in this work is determined to be 150. The favorable performance of the nanocomposite can be attribute to the anti-stokes luminescence feature of UCL as well as the wavelength of the emission light that falls within the NIR window for bioimaging (650–900 nm).33
2.4 Cytotoxicity
We also measured the in vitro cytotoxicity of our nanocomposite towards KB cells with methylthiazolyltetrazolium (MTT) assay. The KB cells were incubated with the RE-UCNP/GNPs@SiO2 of different concentrations ranging from 50 mg mL−1 to 1200 mg mL−1 for 24 h. 6 replicate groups were performed for each concentration. As shown in Fig. S6,† MTT assay indicated that the nanocomposites have no significant cytotoxicity within 1200 mg mL−1 (24 h). The results can be mainly attribute to the favourable bio-compatible of the silica surface of the as-prepared nanocomposite.3 Materials and instruments
3.1 Materials
All starting materials were obtained from commercial supplies. Rare earth oxides Y2O3 (99.999%), Yb2O3 (99.999%), Tm2O3 (99.999%), Gd2O3 (99.999%) were purchased from Shanghai Yue-long New Materials Co. Ltd. LnCl3 were prepared as reported in the literature.34 Octadecene (ODE) (>90%), oleic acid (OA) (>90%), Igepal CO-520, and N-[3-(trimethoxysilyl)propyl]ethylenediamine (TSD) were purchased from Sigma-Aldrich. All chemical reagents of analytical grade were used directly without further purification. Kunming mice (4 weeks) were purchased from the Second Military Medical University and were housed under standard environmental conditions. All animal experiments were performed in compliance with the guidelines of National Institute for Food and Drug Control, China, and were approved by the Institutional Animal Care and Use Committee, School of Pharmacy, Fudan University.3.2 Characterization
The size and morphology of RE-UCNPs were characterized at 200 kV on a FEI Tec-nai G2 20 TWIN TEM. The upconversion luminescence emission spectra were recorded in a modified Edinburgh LFS-920 instrument. The excitation source was an external 9 W adjustable 980 nm semiconductor laser (Beijing Hi-Tech Optoelectronic Co., China) with an optic fiber accessory. Powder X-ray diffraction measurements were performed on a XD-2 diffractometer at a scanning rate of 8° min−1 in the 2θ range from 5° to 90° (Cu Kα radiation, λ = 1.54056 Å). Photoacoustic tomography was performed by a Nexus 128 photoacoustic tomography system (acquiring wavelength 680 nm, water temperature: 37.9 °C, pulses: 30, laser energy: 1.93 mJ).3.3 Synthesis of RE-UCNP
RECl3 (1 mmol, Y![[thin space (1/6-em)]](https://www.rsc.org/images/entities/char_2009.gif) :Yb:Gd:Er = 63:20:15:2) was dispersed in ODE (11.8 g) and OA (7.4 g). The mixture was stirred and heated to 120 °C for 30 min in a 100 mL flask to form an optical transparent solution. Then the solution was cooled down to room temperature. NaOH (0.100 g, 2.5 mmol) and NH4F (0.148 g, 4 mmol) in methanol (10 mL) were added to the flask dropwisely. The solution was heated to 90 °C, repeatedly degassed and purged with nitrogen for three times. After that the solution was heated to 300 °C and kept for 1 h. Finally the solution was cooled to room temperature. The nanoparticles were collected by centrifugation (21036 RCF/10 min) and washed with cyclohexane/ethanol (1:3) for three times. The as-prepared nanoparticles were dispersed in cyclohexane (10 mL). The Gd3+ ions in this work were used to obtain nanoparticles with suitable diameters for silica coating. The particle size can be tuned to 11 nm in diameter when the Gd3+ content was 30 mol% (Fig. S7†).
:Yb:Gd:Er = 63:20:15:2) was dispersed in ODE (11.8 g) and OA (7.4 g). The mixture was stirred and heated to 120 °C for 30 min in a 100 mL flask to form an optical transparent solution. Then the solution was cooled down to room temperature. NaOH (0.100 g, 2.5 mmol) and NH4F (0.148 g, 4 mmol) in methanol (10 mL) were added to the flask dropwisely. The solution was heated to 90 °C, repeatedly degassed and purged with nitrogen for three times. After that the solution was heated to 300 °C and kept for 1 h. Finally the solution was cooled to room temperature. The nanoparticles were collected by centrifugation (21036 RCF/10 min) and washed with cyclohexane/ethanol (1:3) for three times. The as-prepared nanoparticles were dispersed in cyclohexane (10 mL). The Gd3+ ions in this work were used to obtain nanoparticles with suitable diameters for silica coating. The particle size can be tuned to 11 nm in diameter when the Gd3+ content was 30 mol% (Fig. S7†).
3.4 Synthesis of RE-UCNP@NH2–SiO2@SiO2
The as-prepared RE-UCNPs solution (0.04 mL), Igepal CO-520 (0.5 g) was dispersed in cyclohexane (10 mL). The solution was stirred and treated with ultrasonic for 30 min. Then ammonia (0.1 mL, aq.) was added into the solution and the solution immediately turned muddy. The slurry was vigorous stirred until a transparent solution was formed. After that TEOS/TSD (18.25/1.75 μL) was added to the solution. TEOS (10 μL) was added 24 h later and the solution was kept for another 24 h. The nanocomposites were then precipitated by adding 5 mL acetone to the solution and collected by centrifugation (21036 RCF/10 min). The nanocomposites were washed twice with ethanol/water (1:1) and dispersed in 10 mL water.
3.5 Synthesis of RE-UCNP/GNPs@SiO2
To etch the inner layer of the silica, 10 μL HF (10 wt%) was added to the nanocomposites solution (10 mL) carefully and stirred for 1 h. Then the nanocomposites were collected by centrifugation, washed with water/ethanol (1:1). After that the nanocomposites were dispersed in 10 mL water and heated with 30 mg HAuCl4 at 80 °C for 3 h. The final product was washed with water for 3 times and finally dispersed in 10 mL water. To get the yolk shell nanostructured nanocomposite, 20 μL HF was used instead.
3.6 In vitro cytotoxicity
in vitro cytotoxicity was measured by methyl thiazolyl tetrazolium (MTT) assays on the KB cells. Cells were seeded in a 96-well culture plate at ca. 5 × 10⁴ per well and cultured at 37 °C and 5% CO2 for 24 h. The cells were subsequently incubated with different concentrations of RE-UCNP/GNPs@SiO2 (50, 100, 200, 400, 600, 800, 1000, 1200 μg mL−1) for 24 h. After that, MTT (10 μL, 3 mg mL−1) was added to each well and the plate was incubated for an additional 4 h at 37 °C. After the addition of DMSO (100 μL per well) for 10 min, the optical density OD570 value (Abs. value) of each well, with the background subtraction at 690 nm, was measured by a Tecan Infinite M200 monochromator-based multifunction microplate reader. Cell viability (%) = (average Abs. value of treated group)/(average Abs. value of control) × 100%.3.7 In vitro PA imaging
UCNP/GNPs@SiO2 (1 mg mL−1, aq.) and deionized water (blank control) were added to Eppendorf tubes (200 μL) at the constant volume, respectively. PA imaging and tomography were captured at 680 nm using the Nexus 128.3.8 In vivo UCL imaging and PA imaging
Before imaging, the mice were anesthetized with intraperitoneal injection of 100 μL chloral hydrate (10 wt%). For UCL imaging, a small-animal imaging system designed by our group is used.35 The system includes a set of circular 980 nm laser sources and an Andor DU897 EMCCD as the detector. The UCL data was processed with the Kodak Molecular Imaging Software. For PA imaging, the mice were imaged immediately after injection (100 μL, 1 mg μL−1 UCNP@NH2–SiO2@SiO2). During the PA imaging, the corresponding region (abdominal or thoracic) were put in a special-shaped transparent container and immersed by water. The PAT data was simultaneously collected and reconstructed by the Nexus 128 software.4 Conclusions
We have developed a simple strategy to synthesize silica coated RE-UCNP/GNPs@SiO2 nanocomposites. This strategy provides us a feasible way to build a multifunctional nanocomposite based on individual functional nanomaterials. The as-synthesized nanocomposite in the work can be utilized as a dual-modal imaging agent for UCL imaging and PAT, possessing the merits of both UCL and PAT, including ultra-low background noises, real-time imaging, as well as high spatial resolution. In addition, the robust silica shell also improves the bio-compatibility of the nanocomposite.Acknowledgements
The authors sincerely thank Pro. Zhang Xianzhong, Mr Guo Zhide and Mr Peng Qiaoli from Xianmen University for the support in PAT characterization. This study was financially supported by NSFC (21231004), Shanghai Sci. Tech. Comm. (15QA1400700), and MOST of China (2013CB733703 and 2015CB931800).Notes and references
- Y. Liu, Q. Su, M. Chen, Y. Dong, Y. Shi, W. Feng, Z. Y. Wu and F. Li, Adv. Mater., 2016, 28, 6625–6630 CrossRef CAS PubMed.
- N. M. Idris, M. K. Gnanasammandhan, J. Zhang, P. C. Ho, R. Mahendran and Y. Zhang, Nat. Med., 2012, 18, 1580–1585 CrossRef CAS PubMed.
- X. Wang, Y. Pang, G. Ku, X. Xie, G. Stoica and L. V. Wang, Nat. Biotechnol., 2003, 21, 803–806 CrossRef CAS PubMed.
- S. S. Gambhir, Nat. Rev. Cancer, 2002, 2, 683–693 CrossRef CAS PubMed.
- E. B. Dickerson, E. C. Dreaden, X. Huang, I. H. El-Sayed, H. Chu, S. Pushpanketh, J. F. McDonald and M. A. El-Sayed, Cancer Lett., 2008, 269, 57–66 CrossRef CAS PubMed.
- G. Tian, L. Duan, X. Zhang, W. Yin, L. Yan, L. Zhou, X. Liu, X. Zheng, J. Li, Z. Gu and Y. Zhao, Chem.–Asian J., 2014, 9, 1655–1662 CrossRef CAS PubMed.
- W. Yin, L. Zhao, L. Zhou, Z. Gu, X. Liu, G. Tian, S. Jin, L. Yan, W. Ren, G. Xing and Y. Zhao, Chem.–Eur. J., 2012, 18, 9239–9245 CrossRef CAS PubMed.
- W. Yin, L. Zhou, Z. Gu, G. Tian, S. Jin, L. Yan, X. Liu, G. Xing, W. Ren, F. Liu, Z. Pan and Y. Zhao, J. Mater. Chem., 2012, 22, 6974–6981 RSC.
- L. Cao, X. Wang, M. J. Meziani, F. Lu, H. Wang, P. G. Luo, Y. Lin, B. A. Harruff, L. M. Veca, D. Murray, S.-Y. Xie and Y.-P. Sun, J. Am. Chem. Soc., 2007, 129, 11318–11319 CrossRef CAS PubMed.
- P. Caravan, J. J. Ellison, T. J. McMurry and R. B. Lauffer, Chem. Rev., 1999, 99, 2293–2352 CrossRef CAS PubMed.
- T. Beyer, D. W. Townsend, T. Brun, P. E. Kinahan, M. Charron, R. Roddy, J. Jerin, J. Young, L. Byars and R. Nutt, J. Nucl. Med., 2000, 41, 1369–1379 CAS.
- C. E. Clarke and M. Guttman, Lancet, 2002, 360, 1767–1769 CrossRef CAS.
- Y. Wang, J. F. Wong, X. W. Teng, X. Z. Lin and H. Yang, Nano Lett., 2003, 3, 1555–1559 CrossRef CAS.
- H. F. Zhang, K. Maslov, G. Stoica and L. V. Wang, Nat. Biotechnol., 2006, 24, 848–851 CrossRef CAS PubMed.
- C. H. Dong, A. Korinek, B. Blasiak, B. Tomanek and F. van Veggel, Chem. Mater., 2012, 24, 1297–1305 CrossRef CAS.
- J. Zhou, M. Yu, Y. Sun, X. Zhang, X. Zhu, Z. Wu, D. Wu and F. Li, Biomaterials, 2011, 32, 1148–1156 CrossRef CAS PubMed.
- Y. Yang, Y. Sun, T. Cao, J. Peng, Y. Liu, Y. Wu, W. Feng, Y. Zhang and F. Li, Biomaterials, 2013, 34, 774–783 CrossRef CAS PubMed.
- L. V. Wang and S. Hu, Science, 2012, 335, 1458–1462 CrossRef CAS PubMed.
- C. Kim, E. C. Cho, J. Chen, K. H. Song, L. Au, C. Favazza, Q. Zhang, C. M. Cobley, F. Gao, Y. Xia and L. V. Wang, ACS Nano, 2010, 4, 4559–4564 CrossRef CAS PubMed.
- J. Chen, C. Glaus, R. Laforest, Q. Zhang, M. Yang, M. Gidding, M. J. Welch and Y. Xia, Small, 2010, 6, 811–817 CrossRef CAS PubMed.
- S. Wang, K. J. Chen, T. H. Wu, H. Wang, W. Y. Lin, M. Ohashi, P. Y. Chiou and H. R. Tseng, Angew. Chem., Int. Ed., 2010, 49, 3777–3781 CrossRef CAS PubMed.
- Z. Li and Y. Zhang, Nanotechnology, 2008, 19, 345606 CrossRef PubMed.
- F. Gao, L. Li, T. Liu, N. Hao, H. Liu, L. Tan, H. Li, X. Huang, B. Peng, C. Yan, L. Yang, X. Wu, D. Chen and F. Tang, Nanoscale, 2012, 4, 3365–3372 RSC.
- L. Yao, B. Shen, C. Cao, W. Feng and F. Li, RSC Adv., 2014, 4, 20252–20255 RSC.
- G. Wang and W. Sun, J. Phys. Chem. B, 2006, 110, 20901–20905 CrossRef CAS PubMed.
- T. Atay, J.-H. Song and A. V. Nurmikko, Nano Lett., 2004, 4, 1627–1631 CrossRef CAS.
- I. Blakey, Z. Merican and K. J. Thurecht, Langmuir, 2013, 29, 8266–8274 CrossRef CAS PubMed.
- Z. Li, L. Wang, Z. Wang, X. Liu and Y. Xiong, J. Phys. Chem. C, 2011, 115, 3291–3296 CAS.
- Q. J. He and J. L. Shi, J. Mater. Chem., 2011, 21, 5845–5855 RSC.
- Y. S. Chen, W. Frey, S. Kim, K. Homan, P. Kruizinga, K. Sokolov and S. Emelianov, Opt. Express, 2010, 18, 8867–8878 CrossRef CAS PubMed.
- G. P. Luke, A. Bashyam, K. A. Homan, S. Makhija, Y. S. Chen and S. Y. Emelianov, Nanotechnology, 2013, 24, 455101 CrossRef PubMed.
- Y. S. Chen, W. Frey, S. Kim, P. Kruizinga, K. Homan and S. Emelianov, Nano Lett., 2011, 11, 348–354 CrossRef CAS PubMed.
- R. Weissleder, Nat. Biotechnol., 2001, 19, 316–317 CrossRef CAS PubMed.
- Q. Liu, W. Feng, T. Yang, T. Yi and F. Li, Nat. Protoc., 2013, 8, 2033–2044 CrossRef CAS PubMed.
- L. Xiong, Z. Chen, Q. Tian, T. Cao, C. Xu and F. Li, Anal. Chem., 2009, 81, 8687–8694 CrossRef CAS PubMed.
Footnote |
| † Electronic supplementary information (ESI) available: Additional characterizations. See DOI: 10.1039/c7ra02657a |
| This journal is © The Royal Society of Chemistry 2017 |