DOI:
10.1039/C7RA00772H
(Paper)
RSC Adv., 2017,
7, 16348-16359
Modified chemical synthesis of MnS nanoclusters on nickel foam for high performance all-solid-state asymmetric supercapacitors†
Received
18th January 2017
, Accepted 28th February 2017
First published on 16th March 2017
Abstract
Novel MnS nanoclusters were synthesized on nickel foam (NF) using a successive ionic layer adsorption and reaction (SILAR) method. MnS nanoclusters with different sizes were obtained by varying the number of deposition cycles. The crystal structure, chemical composition, and surface microstructure of the electrodes were characterized by X-ray diffraction, X-ray photoelectron spectroscopy, field emission scanning electron microscopy, and high resolution transmission electron microscopy. The electrochemical behavior of the MnS nanoclusters was examined by cyclic voltammetry, galvanostatic charge–discharge, cycling test, and electrochemical impedance spectroscopy. The MnS nanoclusters prepared with 90 SILAR cycles showed the best supercapacitance in a 6 M KOH aqueous electrolyte with a specific capacitance of 828 F g−1 at a scan rate of 5 mV s−1 and cycling stability of 85.2% after 5000 charge–discharge cycles. Moreover, an asymmetric supercapacitor (ASC) was assembled with the as-prepared MnS electrode on NF as the positive electrode, hydrothermally prepared reduced graphene oxide (rGO) on NF as the negative electrode, and PVA–KOH gel as the electrolyte. The MnS@NF//rGO@NF ASC showed excellent electrochemical performance with maximum energy and power densities of 34.1 W h kg−1 and 12.8 kW kg−1, respectively. The ASC also showed a capacitive retention of 86.5% after 2000 charge–discharge cycles, highlighting its practical application for energy storage.
1. Introduction
The demand for affordable and safe energy is growing rapidly to balance living standards and energy consumption. For example, portable electronic devices, such as mobile phones, digital cameras, and laptops, need to be charged within a short time and are expected to possess a long discharge time.1–3 The two most commonly used energy storage devices are electrolytic capacitors and lithium ion batteries. Capacitors have a low energy density and can explode due to the high gas pressures or spark ignition of free oxygen and hydrogen gases liberated at the electrodes.4 In contrast, batteries have a low power density and a short cycle life, suffer from ageing, and may explode if overcharged.5 Therefore, none of them are secure and suitable when high power and energy densities are required. Recently, a new class of energy storage device called supercapacitor (SC) have emerged to fulfill the demands of both high power density and energy density. SCs have a longer cycle life and higher power density than batteries, but a low energy density, which limits their widespread applications.6–8
SCs are classified as electric double layer capacitors (EDLCs) and pseudocapacitors. In the carbon-based electrodes of EDLCs, such as carbon nanotubes, graphene, nitrogen-doped carbon nanofibers, carbon hollow nanospheres, and activated carbon, the charges are adsorbed physically at the electrode–electrolyte interface, resulting in high power density and long cycle life.9–14 Pseudocapacitors consisting of metal oxide/hydroxide or conducting polymer electrodes undergo electrochemical redox reactions during the charge–discharge processes, enabling a higher specific capacitance (Cs) and a higher energy density than EDLCs.15–18 Even if pseudocapacitors show a higher energy density than carbon-based electrodes, the performance is not comparable to that of batteries.19 Therefore, organic electrolytes with a high decomposition potential are used to increase the energy density of supercapacitors, but they are generally toxic and unsafe. In contrast, aqueous electrolyte-based asymmetric supercapacitors (ASCs) are designed for safe use and enhanced energy density. In ASC, two electrodes with complementary potential windows, i.e., a positive potential from a pseudocapacitive electrode and a negative potential from a carbon-based electrode are integrated together to widen the potential window.20–22 On the other hand, aqueous electrolytes used in ASCs evaporate gradually, resulting in a decrease in performance with time. Consequently, there is a need to fabricate all-solid-state ASCs with high Cs, energy density, and power density.
Metal sulfides, such as nickel sulfide (NiS), cobalt sulfide (CoS), molybdenum sulfide (MoS2), copper sulfide (CuS), manganese sulfide (MnS), and nickel cobalt sulfide (Ni–Co–S), are being assessed as high performance pseudocapacitive electrodes.23–29 The high electrical conductivity of metal sulfide offers faster charge transfer than its corresponding oxide/hydroxides, which improve the electrochemical performance of an electrode in terms of Cs, energy density, and power density. Therefore, it is important to synthesize highly conductive and low-cost metal sulfides that exhibit excellent supercapacitive behavior as a positive electrode in ASCs. Among the many metal sulfides, MnS has been studied widely as a dilute magnetic semiconductor or as an anode in lithium-ion batteries.30–33 As Mn has multiple oxidation states, MnS can be used for charge storage via redox reactions along with non-faradaic processes. Moreover, the layered crystal structure of MnS can facilitate the easy intercalation and de-intercalation of electrolyte ions and enhance the electrochemical stability of a supercapacitor; however, there are few reports on the preparation of MnS electrodes and their use in ASCs.
Tang et al.34 hydrothermally prepared MnS nanocrystals of hollow spindle-like nanospheres and tetrapod nanorods with a Cs of 704 F g−1 and 400.6 F g−1, respectively. Li et al.35 synthesized a γ-MnS/reduced graphene oxide (rGO) composite via a facile one-pot solvothermal approach and obtained a Cs of 846.4 F g−1. Chen et al.36 prepared MnS nanocrystals using a hydrothermal method and fabricated a MnS//activated carbon ASC with saturated KOH agar-gel as the electrolyte and separator that showed a maximum Cs of 73.63 F g−1 at a 1 mV s−1 scan rate in an aqueous 2 M KOH electrolyte. Tang et.al.37 obtained GO-anchored porous manganese sulfide (MnS/GO-NH3) nanocrystals by a hydrothermal method based on the Kirkendall effect. The MnS/GO-NH3 nanocrystals showed a Cs of 390.8 F g−1. They also fabricated a MnS/GO-NH3//activated carbon ASC with the highest Cs of 73.63 F g−1 as well as the highest energy and power densities of 14.9 W h kg−1 and 4.6 kW kg−1, respectively. Quan et al.38 used a one-step solvothermal approach to synthesize a hybrid electrode consisting of MnS nanoparticles and nitrogen-doped rGO (N-rGO). With this electrode, they fabricated MnS/N-rGO//N-rGO ASC using a 3 M KOH aqueous electrolyte that exhibited a maximum Cs of 77.9 F g−1. Javed et al.39 synthesized MnS nanoparticles hydrothermally onto carbon textile and fabricated a solid state symmetric supercapacitor with maximum energy and power densities of 52.03 W h kg−1 and 1.2 kW kg−1, respectively.
Therefore, several studies have used hydrothermal/solvothermal methods to synthesize MnS electrodes. On the other hand, such a method requires an extra source of heat in a controlled atmosphere to increase the temperature and pressure to the desired levels to carry out the chemical reactions. This involves high energy consumption, which increases the cost of supercapacitor fabrication. Therefore, it is important to develop a simple and inexpensive method to prepare MnS electrodes for supercapacitor applications. The successive ionic layer adsorption and reaction (SILAR) is one of the most cost effective, eco-friendly, and simple methods to obtain inorganic materials at room temperature. The process involves heterogeneous reactions of precursor ions in separately placed beakers, which avoids the loss of materials caused by precipitation, as is experienced in chemical bath deposition. Therefore, SILAR can be called modified chemical bath deposition. To the best of the authors' knowledge, there are no reports on the fabrication of polymer gel-based all-solid-state ASCs with MnS on nickel foam (NF) (MnS@NF) and rGO on NF (rGO@NF) as the positive and negative electrodes, respectively.
In this study, MnS nanoclusters on NF were prepared by the SILAR method. Here, the number of SILAR cycles were varied to obtain the optimal MnS nanocluster size for high supercapacitive performance. The structure, surface morphology, and supercapacitive properties of the MnS@NF electrodes were studied. Finally, a polyvinyl alcohol (PVA)–KOH polymer gel-based MnS@NF//rGO@NF ASC was fabricated and its device performance was evaluated.
2. Experimental details
2.1 Preparation of MnS nanoclusters
All the chemicals were of analytical grade and used as received. First, 50 mL of 0.1 M Mn(NO3)2 and 50 mL of 0.1 M Na2S solutions were prepared separately. NF was used as a substrate to deposit the MnS nanoclusters. Prior to deposition, the NF was cleaned using the procedure shown in the literature.40 NF of 5 cm × 1 cm in size was placed in 6 M HCl and sonicated for 30 min using an ultrasonicator to remove the NiO layer on the NF surface. The NF was then rinsed sequentially with deionized (DI) water and absolute ethanol. Deposition was carried out at room temperature. In a typical process, a well-cleaned NF substrate was first dipped into 50 mL of a 0.1 M Mn(NO3)2 solution for 30 s to adsorb the Mn2+ ions. In the second step, it was rinsed with DI water for 20 s to remove the loosely adsorbed Mn2+ ions from the NF. In the third step, NF was dipped into 50 mL of a 0.1 M Na2S solution for 30 s. In this step, the S2− ions react with pre-adsorbed Mn2+ ions to form MnS on NF. Finally, NF was rinsed again with DI water for 20 s to remove the unreacted S2− ions from the NF. This completed a single SILAR cycle, which was repeated 60, 90, 120, and 150 times to obtain four different MnS@NF electrodes. The as-prepared electrodes were cleaned several times with DI water to remove the unwanted impurities from the MnS surface. They were then annealed in an argon atmosphere for 2 h at 673 K and used for characterization and the electrochemical measurements. The annealed electrodes deposited with 60, 90, 120, and 150 SILAR cycles are denoted as MnS-60, MnS-90, MnS-120, and MnS-150, respectively.
2.2 Preparation of rGO@NF
Graphene oxide (GO) was prepared using an improved Hummers method41 and was reduced further using a hydrothermal method.42 First, 50 mg of GO powder was added to 50 mL of DI water and the solution was kept under constant magnetic stirring to form a GO suspension. The mixture was transferred to a 50 mL capacity Teflon-sealed autoclave and a piece of cleaned NF was immersed into the reaction solution. The autoclave was maintained at 180 °C for 6 h in an electric oven. At this temperature, GO was reduced to rGO due to the high concentration of H+ ions formed from the superheated H2O.42 The autoclave was then allowed cool naturally to room temperature, and the product on the NF was washed sequentially with DI water and absolute ethanol. Finally, the black-colored product was dried overnight at 70 °C to yield rGO@NF.
2.3 Fabrication of MnS@NF//rGO@NF ASC
A PVA–KOH gel-based ASC was fabricated using MnS as a positive electrode and rGO as a negative electrode. The PVA–KOH gel and polyester cloth were used as an electrolyte and a separator, respectively. Initially, 5 g of PVA was added to 50 mL of DI water. Subsequently, 1.12 g of KOH was dissolved in 20 mL of DI water. The two solutions were mixed together and kept under constant stirring. The mixed solution was heated slowly to 85 °C until it became clear and transparent. The solution was then allowed to cool to room temperature to form a gel. Subsequently, the two electrodes and polyester cloth were dipped into the KOH–PVA gel for 3 h to wet the electrodes and separator. They were dried overnight at room temperature to remove water from the surface. Finally, both electrodes were pressed together with the separator sandwiched in-between and covered with Teflon tape to form a MnS@NF//rGO@NF ASC.
2.4 Characterization
The structural phase formation of the MnS@NF electrodes was confirmed by X-ray diffraction (XRD, PANalytical, X'Pert-PRO MPD) using CuKα radiation. Elemental analysis and the oxidation states were determined by X-ray photoelectron spectroscopy (XPS, Thermo Scientific) using AlKα monochromatic radiation. The surface morphology of the MnS@NF electrodes was examined by field emission scanning electron microscopy (FE-SEM, Hitachi, S-4800) and high resolution transmission electron microscopy (HR-TEM, Philips, CM-200) at an acceleration voltage of 200 kV. The mass loading of MnS@NF was estimated from the mass difference of bare NF and MnS coated NF, which was measured by a sensitive microbalance (Mettler Toledo, MS304S).
2.5 Electrochemical measurements
The electrochemical measurements of MnS@NF electrodes were carried out in an aqueous 6 M KOH electrolyte using a three electrode system consisting of MnS@NF, platinum, and a silver/silver chloride electrode (Ag/AgCl) as the working, counter, and reference electrodes, respectively. Cyclic voltammetry (CV), galvanostatic charge–discharge, and electrochemical impedance spectroscopy (EIS) were employed for the electrochemical measurements using a (Autolab PGSTAT 302N) potentiostat/galvanostat.
3. Results and discussion
3.1 Formation of MnS nanoclusters
The mechanism for the growth of MnS nanoclusters is based on heterogeneous reactions at the surface of the NF. During the first few SILAR cycles, ions nucleate at different sites on NF to form tiny MnS nanoparticles. Subsequent cycles led to the aggregation of nanoparticles to nanoclusters. The reaction mechanism for the formation of MnS nanoclusters using the SILAR method may be explained as follows:43,44| | |
Mn(NO3)2 ↔ Mn2+ + 2(NO3)−
| (1) |
3.2 Structure and surface morphology of MnS
Fig. 1(a) presents XRD patterns of the annealed MnS-60, MnS-90, MnS-120, and MnS-150 electrodes on NF. The strong peaks marked by ‘#’ indicate the XRD peaks for NF, whereas the peaks observed at 29.3°, 38.1°, and 60.8° 2θ were assigned to the (101), (102), and (202) planes of the hexagonal crystal structure of γ-MnS (JCPDS no. 089-4089), respectively. In addition, the small α-MnS phase marked by ‘♦’ was observed in the final products. The crystallite size was determined for the MnS-90 sample using the Scherrer equation,| |
 | (4) |
where λ = 1.54056 Å is the wavelength of X-ray, β is the full width at half maximum, and θ is the Bragg angle. The crystallite size of the nanostructured MnS-90@NF was 14.8 nm for the (102) plane. The phase purity of the as-prepared rGO@NF was confirmed by XRD, as shown in Fig. S1.† Chemical analysis, such as the elemental composition and oxidation states of the MnS-90@NF electrode was examined by XPS. Fig. 1(b) indicates the survey spectrum of the MnS-90@NF electrode. Fig. 1(c and d) shows the core levels of the Mn 2p and S 2p spectra, respectively. The Mn 2p3/2 and Mn 2p1/2 peaks were observed at 641.65 and 653.36 eV, respectively (Fig. 1(c)). The presence of S 2p3/2 peaks at 162.2 eV and S 2p1/2 164.2 eV can be attributed to the S2− state, confirming the formation of MnS, whereas another high energy peak at 168.1 eV was assigned to the oxidized sulfur (sulfoxide) on the surface as shown in Fig. 1(d).45,46
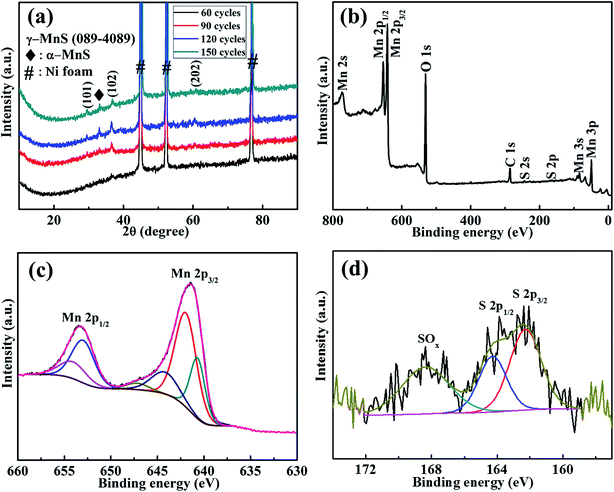 |
| | Fig. 1 (a) XRD patterns of the MnS-60, MnS-90, MnS-120, and MnS-150 electrodes on NF; XPS spectra: (b) survey spectrum, (c) Mn 2p region, and (d) S 2p region of MnS-90@NF electrode. | |
The surface microstructure of the MnS@NF electrodes was examined by FE-SEM. Fig. 2 shows FE-SEM images of the MnS-60, MnS-90, MnS-120, and MnS-150 electrodes, all on NF, at different magnifications. The surface of the MnS-60 electrode (Fig. 2(a–c)) showed a non-uniform and partially covered NF, which means the incomplete growth of MnS nanoclusters on NF after 60 SILAR cycles. As the cycles were increased to 90, a uniform structure of well-grown MnS nanoclusters in the range, 100 to 200 nm, was observed (Fig. 2(d–f)). Each nanocluster was composed of smaller nanoparticles. When the number of SILAR cycles was increased to 120, the growth of nanoclusters continued until they get agglomerated as shown in Fig. 2(g–i). Fig. 2(j and k) shows the overgrown MnS nanoclusters obtained when the number of SILAR cycles were increased further to 150. This led to the non-uniform distribution of nanoclusters on the surface of NF, as shown in Fig. 2(l). Such an agglomerated and overgrown structure may hinder the provision of a higher electroactive surface area, thereby diminishing the charge storage capability of the MnS-120 and MnS-150 electrodes. HR-TEM and selected area electron diffraction (SAED) were used to analyze the size and crystalline structure of the uniform and well-grown MnS-90 nanoclusters. Fig. 3(a and b) shows HR-TEM images of the MnS-90 electrode at low and high magnification, respectively. The nanoclusters consisted of interconnected nanoparticles that provided a large number of electroactive sites because most of the surface area of each nanoparticle was in contact with the electrolyte ions. A careful observation of the highly magnified image (Fig. 3(b)) revealed some tiny nanoparticles with a diameter of approximately 20–30 nm. The interplanar distances of 0.32, 0.23, and 0.15 nm measured from the lattice fringes in the TEM images (Fig. 3 (b)) correspond to the (101), (102), and (202) lattice planes of γ-MnS. They were also confirmed by the SAED pattern (Fig. 3(c)), which was consistent with the XRD result.
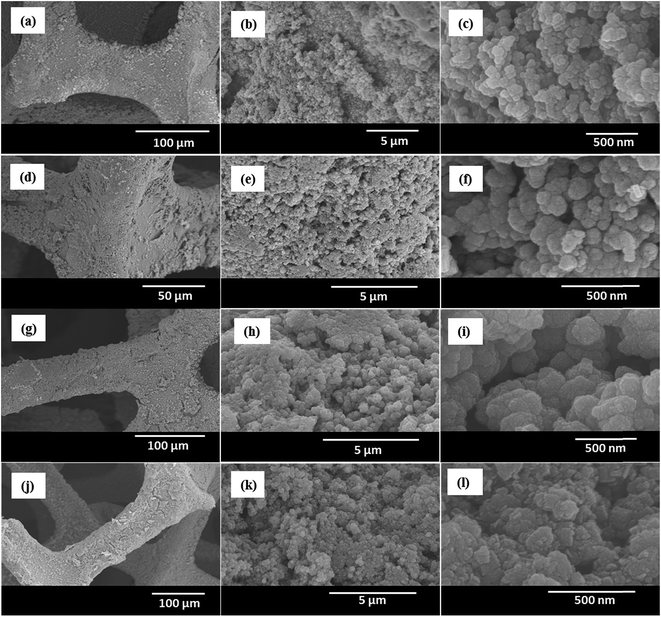 |
| | Fig. 2 FESEM images of the MnS@NF electrodes: (a–c) MnS-60, (d–f) MnS-90, (g–i) MnS-120, and MnS-150 (j–l) after 60, 90, 120, and 150 SILAR cycles, respectively. | |
 |
| | Fig. 3 (a) TEM, (b) HR-TEM and (c) SAED pattern of the MnS-90@NF electrode. | |
3.3 Supercapacitive performance of MnS@NF electrodes
The cyclic voltammograms of MnS-60, MnS-90, MnS-120, and MnS-150 electrodes on NF were measured in 6 M KOH within the potential range, −0.15 to 0.55 V (vs. Ag/AgCl), at a 50 mV s−1 scan rate. The MnS-60 electrode showed a Cs of 420 F g−1 while the highest value of 537 F g−1 was obtained for the MnS-90 electrode. This increase can be related to the formation of uniform nanoclusters after 90 SILAR cycles. On the other hand, Cs decreased for the MnS electrodes prepared with a larger number of cycles, which may be due to the agglomeration and overgrowth of MnS nanoclusters. The surface area of these nanoclusters must have been reduced and so do the effective electroactive sites. Fig. S2† shows the cyclic voltammograms and variation of Cs with the SILAR cycles. Therefore, further electrochemical measurements were carried out on the MnS-90 electrode. Hereafter, MnS-90 electrode is denoted as MnS. Fig. 4(a) shows typical cyclic voltammograms of the MnS@NF electrode at various scan rates, ranging from 5 to 100 mV s−1. Each curve consisted of oxidation and reduction peaks during the positive and negative scans, respectively, which confirm the capacitive behavior of the MnS@NF electrode. In addition, the area inside the loop increased with increasing scan rate, showing its pseudocapacitive capability. Fig. 4(b) presents the corresponding variation of Cs with the scan rate, which was determined using eqn (S1).† The MnS@NF electrode exhibited a maximum Cs of 828 F g−1 at 5 mV s−1. With increasing scan rate, Cs decreased and reached 437 F g−1 at a scan rate of 100 mV s−1. This large decrease in Cs may be due to the diffusion limitation of electrolyte ions in small gaps among the nanoclusters and the very small gaps among the particles in a nanocluster, together with the inability of the electrolyte ions (OH−) to maintain the redox transitions at higher scan rates. The galvanostatic charge–discharge measurements were carried out at various current densities ranging from 3 to 10 A g−1. Fig. 4(c) presents the corresponding variations of voltage as a function of time. The non-linear nature of the curves indicate the pseudocapacitive behavior of the MnS@NF electrode, which is in good agreement with the CV results. The pseudocapacitive charge–discharge mechanism of the MnS@NF electrode is proposed as follows:35| | |
MnS + OH− ↔ MnSOH + e−
| (5) |
| | |
MnSOH + OH− ↔ MnSO + H2O + e−
| (6) |
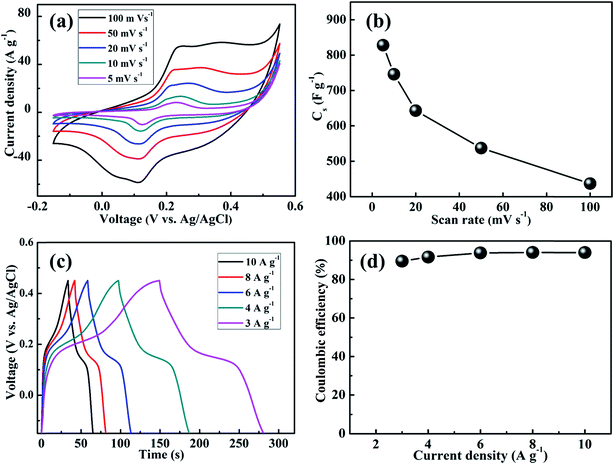 |
| | Fig. 4 (a) Cyclic voltamograms of the MnS-60, MnS-90, MnS-120, and MnS-150 electrodes on NF at different scan rates ranging from 5 to 100 mV s−1, (b) variation of the Cs MnS@NF electrode at different scan rates from 5 to 100 mV s−1, (c) galvanostatic charge–discharge curves of the MnS@NF electrode at different current densities ranging from 3 to 10 A g−1, and (d) coulombic efficiency of the MnS@NF electrode at different current densities, ranging from 3 to 10 A g−1. | |
The energy and power densities of the MnS@NF electrode were estimated at various current densities. The maximum energy density obtained was 73.1 W h kg−1 at a power density of 2 kW kg−1 for a current density of 3 A g−1. Increasing the current density to 10 A g−1 resulted in a maximum power density of 6.6 kW kg−1 at an energy density of 58.3 W h kg−1. The coulombic efficiency of the MnS@NF electrode was examined at various current densities to determine its reversibility. Fig. 4(d) shows a plot of the coulombic efficiency as a function of the current density. The coulombic efficiency was increased from 89.5% to 94% with increasing current density from 3 to 10 A g−1. This suggests that the redox processes at lower current densities were diffusion controlled.
Furthermore, the electrochemical stability of the MnS@NF electrode was tested for 5000 charge–discharge cycles at a current density of 10 A g−1, as shown in Fig. 5. Cs was determined from the charge–discharge curves using eqn (S2).† Initially, Cs increased from 433 F g−1 with increasing number of charge–discharge cycles, which may be due to the enhanced wetting of the electrode with the electrolyte during cycling. After 550 cycles, Cs reached 533 F g−1 and the corresponding change in the surface morphology was studied. Fig. 6(a and b) presents FE-SEM images of the MnS@NF electrode after 550 cycles. The MnS nanoclusters changed to nanoflakes. A similar change in surface morphology after cycling was observed in the case of the hydrothermally prepared MnO2 nanostructures.47 With further increase in the number of charge–discharge cycles, Cs decreased and reached 369 F g−1 after 5000 cycles, which was resulted from the morphology change of the electrodes. This decrease in Cs could have been attributed to the detachment of MnS nanoparticles from the nanoclusters due to the stress and strain resulted from the compression and expansion of the MnS nanostructure during the charge (intercalation) and discharge (de-intercalation) cycles.48 Therefore, the MnS@NF electrode retained a fairly good electrochemical stability of 85.2% after 5000 charge–discharge cycles. Fig. 6(c and d) shows FE-SEM images of the MnS@NF electrode after 5000 cycles.
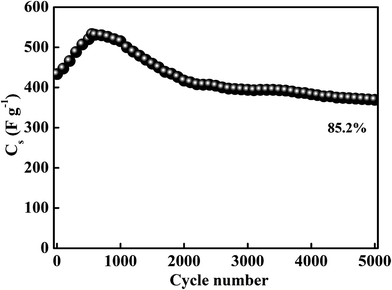 |
| | Fig. 5 Electrochemical cycling performance of the MnS@NF electrode for 5000 charge–discharge cycles at a current density of 10 A g−1. | |
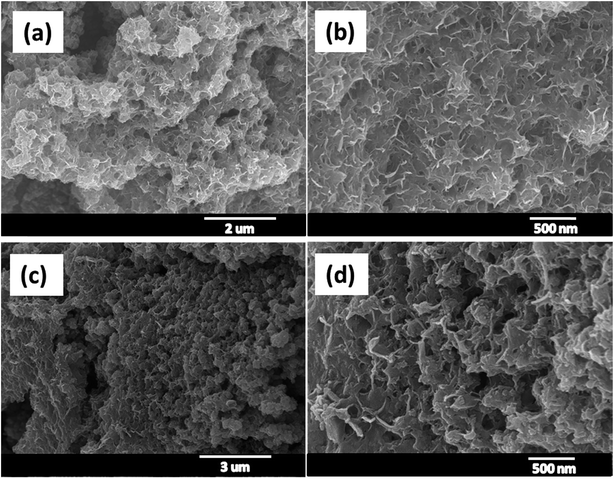 |
| | Fig. 6 FE-SEM images of the MnS@NF electrode (a and b) after 550 and (c and d) after 5000 charge–discharge cycles. | |
The electrochemical impedance of the MnS@NF electrode was measured before cycling and after 5000 charge–discharge cycles over the frequency range, 100 kHz to 0.1 Hz, at the open circuit potential by applying an AC voltage with an amplitude of 10 mV. Fig. 7 depicts Nyquist plots of the MnS@NF electrode before cycling and after 5000 charge–discharge cycles along with corresponding fitted curves. The inset shows the magnified part in the high frequency region. Fig. 8(a and b) shows the circuit equivalents to the MnS@NF electrode. Table S1† lists the fitting parameters of the MnS@NF electrode. The equivalent series resistance (ESR) changed from 0.48 Ω (Rs: before cycling) to 0.63 Ω (R′s: after cycling), which indicates that cycling has a negligible effect on the MnS@NF electrode. This was followed by the parallel combination of capacitance (C) and charge transfer resistance (Rct) due to redox reactions at the electrode–electrolyte interface. The Warburg element (W) in series with Rct is a result of the diffusion of electrolyte ions within the electrode at lower frequencies. The Warburg open circuit element (Wo) in series indicates the finite-length reflective impedance. The equivalent circuit after 5000 charge–discharge cycles consists of R′s followed by a parallel combination of capacitance (C′) and W′1 associated with the charge transfer resistance due to redox reactions. The series W′2, giving a double layer capacitance, arises due to the diffusion of electrolyte ions at the lower frequency region.
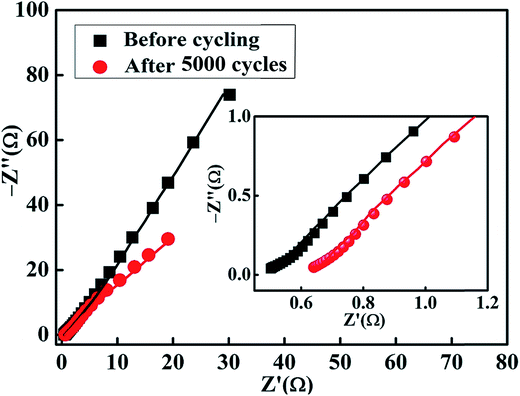 |
| | Fig. 7 Electrochemical impedance plots of the MnS@NF electrode, before cycling and after 5000 charge–discharge cycles. The inset shows the magnified view of the high frequency region. | |
 |
| | Fig. 8 Circuits equivalent to the MnS@NF electrode (a) before cycling and (b) after 5000 charge–discharge cycles. | |
3.4 Supercapacitive performance of MnS@NF//rGO@NF ASC
The supercapacitive performance of the MnS@NF//rGO@NF ASC with the MnS as a positive and rGO as a negative electrodes was evaluated. Fig. S3† shows the surface microstructure and electrochemical performance of rGO@NF. An ASC must store the same number of charges on the positive and negative electrodes. As the MnS@NF and rGO@NF electrodes have a Cs of 746 and 182.5 F g−1, respectively, at a 10 mV s−1 scan rate, the mass loading was balanced using the following equation to obtain an equal capacitance on both electrodes,49| |
 | (7) |
where m+ is the mass of MnS, and C+ and ΔV+ represent Cs and the potential window of the positive MnS@NF electrode, respectively. Similarly, m− is the mass of rGO, and C− and ΔV− represent Cs and the potential window of the rGO@NF electrode, respectively. Based on the Cs values and the potential windows measured for the MnS@NF and rGO@NF electrodes, the optimal mass ratio (m+/m−) of the fabricated ASC was 0.35. From this value and m+ of 0.91 mg, the calculated mass of rGO was 2.6 mg. Fig. 9 shows the cyclic voltamograms of the MnS@NF and rGO@NF electrodes with their corresponding potential windows at a 10 mV s−1 scan rate. The potential windows of the rGO@NF and MnS@NF electrodes ranged from −1 to 0 and from −0.15 to 0.55 V (vs. Ag/AgCl), respectively. The calculated ΔV+ and ΔV− were 0.70 V and 1 V, respectively. rGO gave an almost rectangular CV curve indicating EDLC type behavior, whereas MnS gave well defined redox peaks that show the pseudocapacitance. These electrodes were combined to form a MnS@NF//rGO@NF ASC with a wider potential window. Fig. 10 presents a schematic diagram for the ASC fabrication process. Fig. 11(a) shows cyclic voltamograms of the ASC at different potential windows and a fixed scan rate of 100 mV s−1. With increasing potential window, the area under the cyclic voltamograms increased, giving a stable maximum operating potential window of 1.6 V. Similarly, the ASC was also exposed to different potential windows at a fixed current density of 3.5 A g−1, as shown in Fig. 11(b). As the potential window was increased from 1.0 to 1.6 V, the charging curve followed the same path and became stable at 1.6 V, indicating the unique behavior of the ASC for all operating potential windows. The coulombic efficiency of the ASC was determined for various potential windows at a fixed current density of 3.5 A g−1. The coulombic efficiency decreased with increasing potential window, which indicated inability of the ASC to reach a high potential due to the high ESR and charge transfer resistance. Fig. S4† shows the variation of the coulombic efficiency with the potential window.
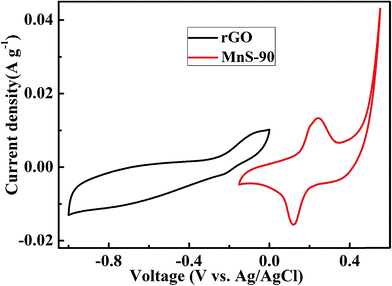 |
| | Fig. 9 Cyclic voltamograms of the rGO@NF and MnS@NF electrodes measured in a three-electrode system in an aqueous 6 M KOH solution at a scan rate of 10 mV s−1. | |
 |
| | Fig. 10 Schematic illustration of the fabrication process of MnS@NF//rGO@NF an ASC. | |
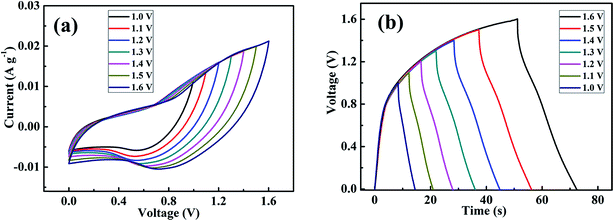 |
| | Fig. 11 (a) Cyclic voltamograms of the as-fabricated MnS@NF//rGO@NF ASC at different operating voltages and at a scan rate of 100 mV s−1 and (b) galvanostatic charge–discharge curves of the as-fabricated MnS@NF//rGO@NF ASC at different operation voltages and at a current density of 3.5 A g−1. | |
In addition, the electrochemical performance of the MnS@NF//rGO@NF ASC was carried out at different scan rates, ranging from 5 to 100 mV s−1, as shown in Fig. 12(a). The ASC exhibited the combined contribution from faradaic and non-faradaic reactions due to the pseudocapacitance of the MnS@NF electrode and the double layer capacitance of rGO@NF. Fig. 12(b) presents the variation of Cs with the scan rates for ASC, resulting in a maximum Cs of 104 F g−1 at a scan rate of 5 mV s−1 and reached 40 F g−1 with increasing scan rate to 100 mV s−1. This decrease in Cs may be due to the inability of the electroactive sites of the electrodes to maintain the redox transitions. Subsequently, the charge–discharge behavior of the ASC was studied at different current densities, ranging from 2 to 10 A g−1. Fig. 12(c) shows the corresponding variation in the charge–discharge curves. The ASC showed a maximum Cs of 94 F g−1 at the lowest current density of 2 A g−1. Increasing the current density to 6 A g−1 resulted in a Cs of 52 F g−1. Therefore, a capacitive retention of 55% with a fivefold enhancement in current density was achieved, employing the high rate capability of the ASC. The coulombic efficiency of the ASC was estimated at various current densities, as shown in Fig. 12(d). This showed that the coulombic efficiency increased from 38.5% to 74.9% with increasing current density from 2 A g−1 to 10 A g−1. The small coulombic efficiency at low current density might have been attributed to the factors such as high Rct of ASC (1082 Ω) and low ionic conductivity of solid electrolyte. The electrochemical charge–discharge stability of the ASC was tested at 6 A g−1, as shown in Fig. 13. A capacitive retention of 86.6% was observed after 2000 cycles, which is better than those of the other MnS-based ASCs.37,50
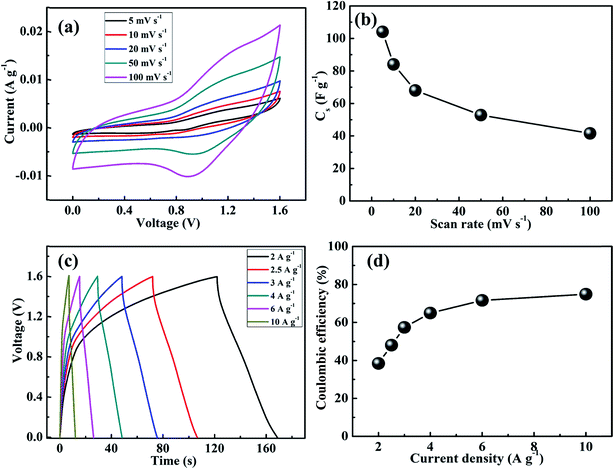 |
| | Fig. 12 (a) Cyclic voltamograms of the MnS@NF//rGO@NF ASC at different scan rates, (b) variation of Cs of the ASC at different scan rates from 5 to 100 mV s−1, (c) galvanostatic charge–discharge curves of the ASC at different current densities and (d) coulombic efficiency of the ASC at different current densities ranging from 2 to 10 A g−1. | |
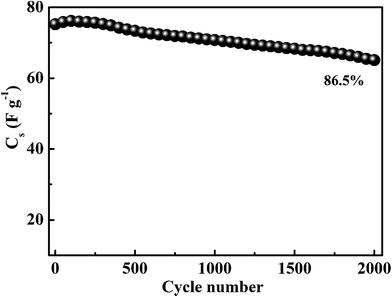 |
| | Fig. 13 Electrochemical stability of the MnS@NF//rGO@NF ASC at a fixed current density of 6 A g−1. | |
Fig. 14 presents the experimental Nyquist plots of the MnS@NF//rGO@NF ASC before cycling and after 2000 charge–discharge cycles measured over the frequency range, 100 kHz to 0.1 Hz, at the open circuit potential by applying an AC voltage with a 10 mV amplitude. The ESR increased from 0.72 Ω (before cycling) to 1.4 Ω (after 5000 cycles). This increase in ESR can be related to the increase in gel resistance due to a deterioration of the polymer network after continuous charge–discharge cycling. The circuit equivalent for the ASC before cycling consists of parallel combination of a constant phase element (CPE1) and Rct1, which can be related to charge storage due to the redox reactions at the electrode–electrolyte interface. In particular, the appearance of CPE1 was attributed to the non-uniform distribution of charges. The second parallel combination of CPE2 and Rct2 was attributed to the non-faradaic transfer reactions in the lower frequency region. After cycling, the electrode surface was largely modified because the CPEs (CPE1 and CPE2) changed to the capacitances (C′1 and C′2). This may be due to the loss of non-uniformity on the electrode surface due to the accumulation of electrolyte ions after cycling. The straight line with a slope to the real impedance axis in the low frequency region is due to the diffusion of electrolyte ions after cycling, giving the W value of the electrode.51 Fig. 15(a and b) presents the circuit equivalents and fitted parameters for ASC before cycling and after 2000 charge–discharge cycles, respectively. Table S2† shows the corresponding fitted parameters before cycling and after 2000 charge–discharge cycles.
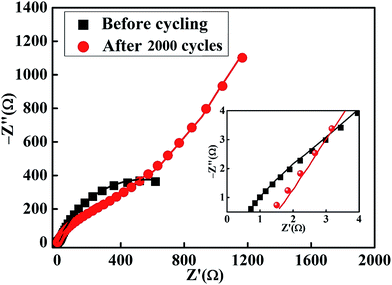 |
| | Fig. 14 Nyquist plots of the MnS@NF//rGO@NF ASC, before cycling and after 2000 charge–discharge cycles. The inset shows the magnified view of the high frequency region of the plots. | |
 |
| | Fig. 15 Circuits equivalent to the MnS@NF//rGO@NF ASC device, (a) before cycling and (b) after 2000 charge–discharge cycles. | |
In general, the energy storage ability of any device is expressed in terms of a Ragone plot, in which the energy density is measured as a function of the power density. Fig. 16 depicts the Ragone plot of the different MnS-based ASCs. The MnS@NF//rGO@NF ASC exhibits a maximum energy density of 34.1 W h kg−1 (at a power density of 2.5 kW kg−1) and a maximum power density of 12.8 kW kg−1 (at energy density of 18.4 W h kg−1). These values are significantly better than that of many other reported MnS-based ASCs.34,37,39 On the other hand, Chen et al.36 achieved the highest energy density of 37.6 W h kg−1 for the MnS//activated carbon ASC, using a KOH-based agar gel electrolyte. As agar gel contains submicron-sized pores filled with water, its calendar life could be shorter than the MnS@NF//rGO@NF solid state ASCs presented in this work. Similarly, Quan et al.38 fabricated α-MnS//nitrogen-doped ASC that showed the highest power density of 20 kW kg−1 using an aqueous KOH electrolyte; however, with time, it suffer from electrolyte leakage and performance loss. Table S3† lists the energy and power densities of different MnS-based ASCs. To demonstrate the energy storage capacity of MnS@NF//rGO@NF ASC, for real applications, two such ASCs were connected in series. After charging for 30 s, the ASC can power up a red LED for more than 60 s, as shown in the inset in Fig. 16.
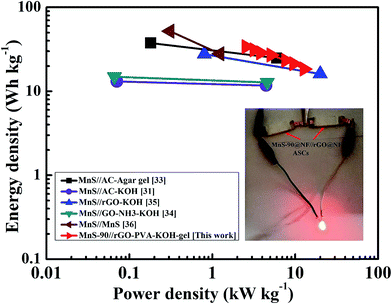 |
| | Fig. 16 (a) Ragone plots of the MnS@NF//rGO@NF ASC prepared in this study and other MnS-based ASCs reported in the literature (inset: demonstration of the MnS@NF//rGO@NF ASC). | |
4. Conclusions
MnS nanoclusters were synthesized on NF using an inexpensive and eco-friendly SILAR method. The number of SILAR cycles was controlled to achieve the optimal sized MnS nanoclusters with the best supercapacitive performance. In particular, the nanoclusters prepared with 90 SILAR cycles gave a maximum Cs of 828 F g−1 at a 5 mV s−1 scan rate. The MnS@NF electrode showed an electrochemical stability of 85.2% after 5000 charge–discharge cycles. Furthermore, the fabricated all-solid-state MnS@NF//rGO@NF ASC exhibited the highest Cs of 104 F g−1 with energy and power densities of 34.1 W h kg−1 and 12.8 kW kg−1, respectively. The ASC showed an electrochemical stability of 86.6% after 2000 charge–discharge cycles. Moreover, the ASC could light up a red LED, highlighting the usefulness of the MnS@NF//rGO@NF combination for various portable electronic applications.
Acknowledgements
This study was supported by the 2016 Post-doctoral Research Grant of Yeungnam University (216A345013).
References
- Phone Arena, http://www.phonearena.com/news/Phones-with-quick-charge-the-fastest-charging-from-0-to-100-2016-edition_id81675, accessed October 2016.
- Y. Tang, Y. Zhang, W. Li, B. Ma and X. Chen, Chem. Soc. Rev., 2015, 44, 5926–5940 RSC.
- EE Times, http://www.eetimes.com/document.asp?doc_id=1312441, accessed October 2016.
- C. J. Kaiser, The Capacitor Handbook, Van Nostrand Reinhold, New York, 1993 Search PubMed.
- Q. Yuan, F. Zhao, W. Wang, Y. Zhao, Z. Liang and D. Yan, Electrochim. Acta, 2015, 178, 682–688 CrossRef CAS.
- B. E. Conway, Electrochemical Supercapacitors: Scientific Fundamentals and Technological Applications, Kluwer-Plenum, New York, 1999 Search PubMed.
- P. Simon and Y. Gogotsi, Nat. Mater., 2008, 7, 845–854 CrossRef CAS PubMed.
- F. Beguin and E. Frackowiak, Supercapacitors: Materials, Systems and Applications, Wiley, Weinheim, 2013 Search PubMed.
- H. Chen, S. Zeng, M. Chen, Y. Zhang and Q. Li, Carbon, 2015, 92, 271–296 CrossRef CAS.
- Y. Shao, M. F. El-Kady, L. J. Wang, Q. Zhang, Y. Li, H. Wang, M. F. Mousavi and R. B. Kaner, Chem. Soc. Rev., 2015, 44, 3639–3665 RSC.
- X. Zhang, H. Zhang, C. Li, K. Wang, X. Sun and Y. Ma, RSC Adv., 2014, 4, 45862–45884 RSC.
- K. Chen, S. Song, F. Liu and D. Xue, Chem. Soc. Rev., 2015, 44, 6230–6257 RSC.
- D. Zhu, K. Cheng, Y. Wang, D. Sun, L. Gan, T. Chen, J. Jiang and M. Liu, Electrochim. Acta, 2017, 224, 17–24 CrossRef CAS.
- M. Liu, M. Shi, W. Lu, D. Zhu, L. Li and L. Gan, Chem. Eng. J., 2017, 313, 518–526 CrossRef CAS.
- C. Lamiel, V. H. Nguyen, D. Tuma and J.-J. Shim, Mater. Res. Bull., 2016, 83, 275–283 CrossRef CAS.
- S. Sahoo, S. Zhang and J.-J. Shim, Electrochim. Acta, 2016, 216, 386–396 CrossRef CAS.
- X. Wang and T. Song, New J. Chem., 2016, 40, 8006–8011 RSC.
- S. Surjit, N. Kusha Kumar and R. Chandra Sekhar, Nanotechnology, 2015, 26, 455401 CrossRef PubMed.
- M. Liu, X. Ma, L. Gan, Z. Xu, D. Zhu and L. Chen, J. Mater. Chem. A, 2014, 2, 17107–17114 CAS.
- D. P. Dubal, R. Holze and P. Gomez-Romero, ChemPlusChem, 2015, 80, 944–951 CrossRef CAS.
- X. Ren, C. Guo, L. Xu, T. Li, L. Hou and Y. Wei, ACS Appl. Mater. Interfaces, 2015, 7, 19930–19940 CAS.
- L. Zhang, W. Zheng, H. Jiu, C. Ni, J. Chang and G. Qi, Electrochim. Acta, 2016, 215, 212–222 CrossRef CAS.
- N. Choudhary, M. Patel, Y.-H. Ho, N. B. Dahotre, W. Lee, J. Y. Hwang and W. Choi, J. Mater. Chem. A, 2015, 3, 24049–24054 CAS.
- R. N. Bulakhe, S. Sahoo, T. T. Nguyen, C. D. Lokhande, C. Roh, Y. R. Lee and J. J. Shim, RSC Adv., 2016, 6, 14844–14851 RSC.
- Z. Lv, N. Mahmood, M. Tahir, L. Pan, X. Zhang and J.-J. Zou, Nanoscale, 2016, 8, 18250–18269 RSC.
- Y. Tang, S. Chen, S. Mu, T. Chen, Y. Qiao, S. Yu and F. Gao, ACS Appl. Mater. Interfaces, 2016, 8, 9721–9732 CAS.
- X.-Y. Yu, L. Yu, L. Shen, X. Song, H. Chen and X. W. Lou, Adv. Funct. Mater., 2014, 24, 7440–7446 CrossRef CAS.
- V. H. Nguyen, C. Lamiel and J.-J. Shim, Electrochim. Acta, 2015, 161, 351–357 CrossRef CAS.
- C. Lamiel, V. H. Nguyen, M. Baynosa, D. C. Huynh and J. J. Shim, J. Electroanal. Chem., 2016, 771, 106–113 CrossRef CAS.
- J. K. Furdyna and N. Samarth, J. Appl. Phys., 1987, 61, 3526–3531 CrossRef CAS.
- Y. Liu, Y. Qiao, W.-X. Zhang, Z. Li, X.-L. Hu, L.-X. Yuan and Y.-H. Huang, J. Mater. Chem., 2012, 22, 24026–24033 RSC.
- X. Xu, S. Ji, M. Gu and J. Liu, ACS Appl. Mater. Interfaces, 2015, 7, 20957–20964 CAS.
- Y. Ren, J. Wang, X. Huang and J. Ding, Solid State Ionics, 2015, 278, 138–143 CrossRef CAS.
- Y. Tang, T. Chen and S. Yu, Chem. Commun., 2015, 51, 9018–9021 RSC.
- X. Li, J. Shen, N. Li and M. Ye, J. Power Sources, 2015, 282, 194–201 CrossRef CAS.
- T. Chen, Y. Tang, Y. Qiao, Z. Liu, W. Guo, J. Song, S. Mu, S. Yu, Y. Zhao and F. Gao, Sci. Rep., 2016, 6, 23289–23297 CrossRef CAS PubMed.
- Y. Tang, T. Chen, S. Yu, Y. Qiao, S. Mu, J. Hu and F. Gao, J. Mater. Chem. A, 2015, 3, 12913–12919 CAS.
- H. Quan, B. Cheng, D. Chen, X. Su, Y. Xiao and S. Lei, Electrochim. Acta, 2016, 210, 557–566 CrossRef CAS.
- M. S. Javed, X. Han, C. Hu, M. Zhou, Z. Huang, X. Tang and X. Gu, ACS Appl. Mater. Interfaces, 2016, 8, 24621–24628 CAS.
- C. Yuan, L. Yang, L. Hou, L. Shen, X. Zhang and X. W. Lou, Energy Environ. Sci., 2012, 5, 7883–7887 CAS.
- D. C. Marcano, D. V. Kosynkin, J. M. Berlin, A. Sinitskii, Z. Sun, A. Slesarev, L. B. Alemany, W. Lu and J. M. Tour, ACS Nano, 2010, 4, 4806–4814 CrossRef CAS PubMed.
- Y. Zhou, Q. Bao, L. A. L. Tang, Y. Zhong and K. P. Loh, Chem. Mater., 2009, 21, 2950–2956 CrossRef CAS.
- H. M. Pathan and C. D. Lokhande, Bull. Mater. Sci., 2004, 27, 85–111 CrossRef CAS.
- M. A. Yıldırım, S. T. Yıldırım, İ. Cavanmirza and A. Ateş, Chem. Phys. Lett., 2016, 647, 73–78 CrossRef.
- G. Zhang, M. Kong, Y. Yao, L. Long, M. Yan, X. Liao, G. Yin, Z. Huang, A. M Asiri and X. Sun, Nanotechnology, 2017, 28, 065402–065413 CrossRef PubMed.
- F. Shahzad, P. Kumar, Y. H. Kim, S. M. Hong and C. M. Koo, ACS Appl. Mater. Interfaces, 2016, 8, 9361–9369 CAS.
- W. Chen, R. B. Rakhi, Q. Wang, M. N. Hedhili and H. N. Alshareef, Adv. Funct. Mater., 2014, 24, 3130–3143 CrossRef CAS.
- V. S. Kumbhar, A. D. Jagadale, N. M. Shinde and C. D. Lokhande, Appl. Surf. Sci., 2012, 259, 39–43 CrossRef CAS.
- R. Ramkumar and M. Minakshi, Dalton Trans., 2015, 44, 6158–6168 RSC.
- C. Lamiel, V. H. Nguyen, C. Roh, C. Kang and J.-J. Shim, Electrochim. Acta, 2016, 210, 240–250 CrossRef CAS.
- R. B. Pujari, A. C. Lokhande, A. A. Yadav, J. H. Kim and C. D. Lokhande, Mater. Des., 2016, 108, 510–517 CrossRef CAS.
Footnote |
| † Electronic supplementary information (ESI) available. See DOI: 10.1039/c7ra00772h |
|
| This journal is © The Royal Society of Chemistry 2017 |
Click here to see how this site uses Cookies. View our privacy policy here.  Open Access Article
 a,
Choon Sup Rab,
Dirk Tuma
 c,
Bong-Ki Mind and
Jae-Jin Shim
 *a
*a


