
 Open Access Article
 This Open Access Article is licensed under a
 Creative Commons Attribution 3.0 Unported Licence
Hydrothermal crystallization of a Ln2(OH)4SO4·nH2O layered compound for a wide range of Ln (Ln = La–Dy), thermolysis, and facile transformation into oxysulfate and oxysulfide phosphors†
Xuejiao Wang abcd,
Ji-Guang Li*abc,
Maxim S. Molokeevef,
Xiaojun Wangg,
Weigang Liuab,
Qi Zhuab,
Hidehiko Tanakah,
Keiko Suzutah,
Byung-Nam Kimc and
Yoshio Sakkac
abcd,
Ji-Guang Li*abc,
Maxim S. Molokeevef,
Xiaojun Wangg,
Weigang Liuab,
Qi Zhuab,
Hidehiko Tanakah,
Keiko Suzutah,
Byung-Nam Kimc and
Yoshio Sakkac
aKey Laboratory for Anisotropy and Texture of Materials (Ministry of Education), Northeastern University, Shenyang, Liaoning 110819, China
bInstitute of Ceramics and Powder Metallurgy, School of Materials Science and Engineering, Northeastern University, Shenyang, Liaoning 110819, China
cResearch Centre for Functional Materials, National Institute for Materials Science, Tsukuba, Ibaraki 305-0044, Japan. E-mail: LI.Jiguang@nims.go.jp; Tel: +81-29-860-4394
dCollege of New Energy, Bohai University, Jinzhou, Liaoning 121000, China
eLaboratory of Crystal Physics, Kirensky Institute of Physics, Federal Research Center KSC SB RAS, Krasnoyarsk 660036, Russia
fDepartment of Physics, Far Eastern State Transport University, Khabarovsk 680021, Russia
gSchool of Physics and Electronic Engineering, Jiangsu Normal University, Xuzhou, Jiangsu 221116, China
hWorld Premier International Centre for Materials Nanoarchitectonics (WPI-MANA), National Institute for Materials Science, Tsukuba, Ibaraki 305-0044, Japan
First published on 27th February 2017
Abstract
The synthesis of a layered Ln2(OH)4SO4·nH2O material (Ln-241) with a smaller lanthanide ion (Dy3+) was successfully achieved through the optimization of the hydrothermal conditions, and the effect of lanthanide contraction on the chemical composition, phase structure, and crystallite/particle morphology of the products was investigated and discussed. Structure refinement showed that the lattice parameters (a, b, and c), cell volume, and axis angle across the series (Ln = La–Dy) monotonously decrease as the size of Ln3+ decreases. Comparative TG/DTA analysis in air indicated that the dehydroxylation temperature of Ln-241 tends to increase, whereas the dehydration and desulfurization temperatures decrease as the size of Ln3+ decreases, thus narrowing the stable temperature range for Ln2O2SO4. Taking advantage of the fact that Ln-241 has exactly the same Ln/S molar ratio as Ln2O2SO4 and Ln2O2S, the latter two groups of important compounds (excluding Ce) were facilely transformed from the former via the removal of water by calcination. The photoluminescence properties of Eu3+ and Tb3+, in terms of excitation, emission, fluorescence decay, quantum yield, and emission color, were investigated and compared for the two hosts Gd2O2S and Gd2O2SO4, and the (Gd0.99Tb0.01)2O2S phosphor was shown to be stable under electron beam irradiation in the studied range and exhibited an increasingly higher emission brightness as the acceleration voltage (up to 7 kV) or beam current (up to 50 μA) increased.
Introduction
The general chemical formula of layered rare-earth hydroxides (LRHs) can be expressed as Ln2(OH)6−m(Ax−)m/x·nH2O (Ln: trivalent rare-earth ions; A: guest anion; 1.0 ≤ m ≤ 2.0),1,2 with Ln2(OH)5(Ax−)1/x·nH2O (m = 1), termed as the 251 phase, and Ln2(OH)4(Ax−)2/x·nH2O (m = 2), termed as the 241 phase, being two important groups of the family. The 251 phase has drawn significant attention since its first report in 2006 and is finding potential applications in various fields including pollutant trapping, rechargeable batteries, drug delivery, heterogeneous catalysis, and microelectronics.3–7 The superior performance of Ln-251 motivated researchers to explore LRHs with new compositions. In 2010, the Ln-241 compounds of Ln2(OH)4SO4·nH2O (Ln = Pr–Tb) were obtained as a new family of LRH via the homogeneous hydrolysis of Ln-sulfate in the presence of hexamethylenetetramine (HMT).1 Later, in 2011, the crystal structure of Ln-241 was explored for the currently obtainable Pr–Tb analogues.8 Very recently, the binary (Ce,Tb)2(OH)4SO4·nH2O compound was synthesized and an enhanced Tb3+ emission was achieved due to efficient energy transfer from Ce3+ to Tb3+.9 However, the Ln-241 phase is yet confined to limited members of Ln and its synthesis is mainly restricted to homogeneous precipitation under ambient pressure. The thus produced Ln-241 materials typically consist of aggregates of thin flakes. Therefore, it is highly important to explore other routes for the synthesis of Ln2(OH)4SO4·nH2O with a well-controlled morphology and for a wider range of Ln. The behavior of Ln varies in various aspects due to lanthanide contraction;10,11 hence, it is scientifically fascinating and practically required to establish specific conditions for the synthesis of Ln-241 compounds of different Ln.Recently, Ln2O2SO4 oxysulfates are attracting significant interest in various fields as oxygen storage materials,12 catalysts for water–gas shift (WGS)13 and reverse WGS,14 solid electrolytes,15 cathodes for solid oxide fuel cells,16 and in down-/up-conversion luminescence.17,18 Research, however, has only been limited to a few members of the Ln group (particularly, Gd and Y), and the stable temperature window for Ln2O2SO4 compounds is not well established although it was reported that Lu2O2SO4 is unstable at room temperature;19,20 La2O2SO4 is stable in air at temperatures as high as 1200 °C.21 On the other hand, Ln2O2S oxysulfides are known as an important group of compounds that are finding practical applications in solid-state lasers, medical X-ray CT, safety indications, and luminescence and display.22–24 However, their synthesis inevitably involves environmentally harmful sulfur-containing reagents and complicated procedures, either via solid-phase reactions25–27 or wet-chemical synthesis such as the solvothermal pressure-relief process,28 complex homogeneous precipitation,29 and one-pot solvothermal reactions.23 The chemical composition of Ln2(OH)4SO4·nH2O compounds provides new opportunities to address the abovementioned challenging issues since these compounds have exactly the same Ln/S molar ratio as Ln2O2S and Ln2O2SO4 and can thus act as an ideal precursor for the latter two groups of compounds.
In this study, the hydrothermal synthesis of Ln2(OH)4SO4·nH2O was conducted for the entire range of Ln (La–Lu), and the effect of lanthanide contraction on the chemical composition, phase structure, and particle morphology were investigated. By adjusting the solution pH, Ln-241 was obtained for the first time for a smaller Ln3+ ion, Dy3+, whose structural parameters were also characterized. Thermal decomposition of the compounds in air was studied in detail for each Ln via TG/DTA, and the stable temperature window of Ln2O2SO4 was well established for Ln = La–Dy. Furthermore, on simply removing water from the Ln-241 precursor via calcination in the presence of hydrogen, the Ln2O2S compounds were successfully produced. The luminescence properties including excitation, emission, fluorescence decay, quantum yield, and CIE chromaticity of the two important activators Eu3+ and Tb3+ were also studied with Gd2O2SO4 and Gd2O2S as the host lattices.
Experimental
Materials and synthesis
The starting materials were Ln(NO)3·6H2O (Ln = La–Ho, 99.99% pure), Ln2O3 (Ln = Er–Lu, 99.99% pure), (NH4)2SO4 (>99.5% pure), and NH3·H2O (ultrahigh purity). All chemicals were purchased from Kanto Chemical Co., Inc. (Tokyo, Japan) and were used without further purification. Ln oxide was dissolved using a slight excess of hot nitric acid to prepare the corresponding nitrate solution and superfluous acid was removed by evaporation of the solution at ∼90 °C. In a typical synthesis, 0.8 g of (NH4)2SO4 (6 mmol) was dissolved in 60 mL of Ln(NO)3 solution (0.1 M), followed by the dropwise addition of NH3·H2O to adjust the solution pH. The resultant turbid solution was transferred to an autoclave (100 mL capacity) after 15 min of continuous stirring. The product obtained was then subjected to hydrothermal reaction by placing it in a preheated air oven for 24 h. The resultant product was washed three times with Milli-Q filtered water (resistivity ∼ 18 MΩ cm) and rinsed once with ethanol, followed by drying in air at 70 °C for 24 h. The obtained Ln-241 was calcined under flowing H2 (200 mL min−1) at 1200 °C for 1 h to yield Ln2O2S and in ambient air (in Ar for the Tb and Pr analogues to prevent possible oxidation) at 1000 °C for 1 h to afford Ln2O2SO4. The heating rate is 5 °C min−1 in the ramp stage of calcinations. (Gd,RE)2O2S and (Gd,RE)2O2SO4 phosphors (RE = 5 at% Eu or 1 at% Tb) were prepared as abovementioned.Characterization
Phase characterization was performed via X-ray diffractometry (XRD; Model RIN T2200, Rigaku, Tokyo, Japan) operated at 40 kV/40 mA, using nickel-filtered Cu-Kα radiation (λ = 0.15406 nm). The XRD data for the Rietveld analysis were obtained in the step-scan mode with a step size of 0.02° and an accumulation time of 10 s. Rietveld refinement was carried out using the TOPAS 4.2 software.30 The morphology of the products was observed via a field emission scanning electron microscope operated at 10 kV (FE-SEM; Model S-5000, Hitachi, Tokyo). Fourier transform infrared spectroscopy (FTIR; Model 4200, JASCO, Tokyo) was performed via the standard KBr pellet method. Thermogravimetric/differential thermal analyses (TG/DTA; Model STA449F3, Jupiter, NETZSCH, Germany) of the Ln-241 compounds were performed under flowing simulated air (50 mL min−1) up to 1560 °C at the heating rate of 10 °C min−1. The elemental composition of the products was also determined: for Ln, via inductively coupled plasma spectroscopy (ICP; Model IRIS Advantage, Jarrell-Ash Japan, Kyoto, Japan); for N, via spectrophotometry (Ubest-35, Japan Spectroscopic Co., Ltd, Tokyo); and for C and S, via combustion-infrared absorptiometry (Model CS-444LS, LECO, St. Joseph, MI). Photoluminescence spectra of the (Gd,RE)2O2SO4 and (Gd,RE)2O2S phosphors were obtained using an FP-6500 (JASCO) fluorescence spectrophotometer equipped with a 150 W xenon lamp for excitation at the scan speed of 100 nm min−1 and a slit width of 3 nm for both excitation and emission. The luminescence efficiency was determined using the absolute PL quantum yield (QY) measurement system (C9920-02, Hamamatsu Photonics K. K., Kanagawa, Japan). Cathodoluminescence of the (Gd0.99Tb0.01)2O2S green phosphor was measured by a spectroradiometer (HS-1000, Photal Otsuka Electronics, Osaka, Japan) in a vacuum chamber with a base pressure of 10−6 Pa at room temperature after the powder was deposited on a 1 × 1 cm2 Al plate. The electron beam covered a circular area of 0.76 cm in diameter (∼0.45 cm2), from which the luminescence signal was obtained in the 300–800 nm region using a CCD camera. The luminescence brightness (cd m−2) was derived from the emission integrated over the wavelength region of measurement using a built-in software of the system.Results and discussion
The effects of lanthanide contraction on the crystallization and extended synthesis of Ln-241 layered compound
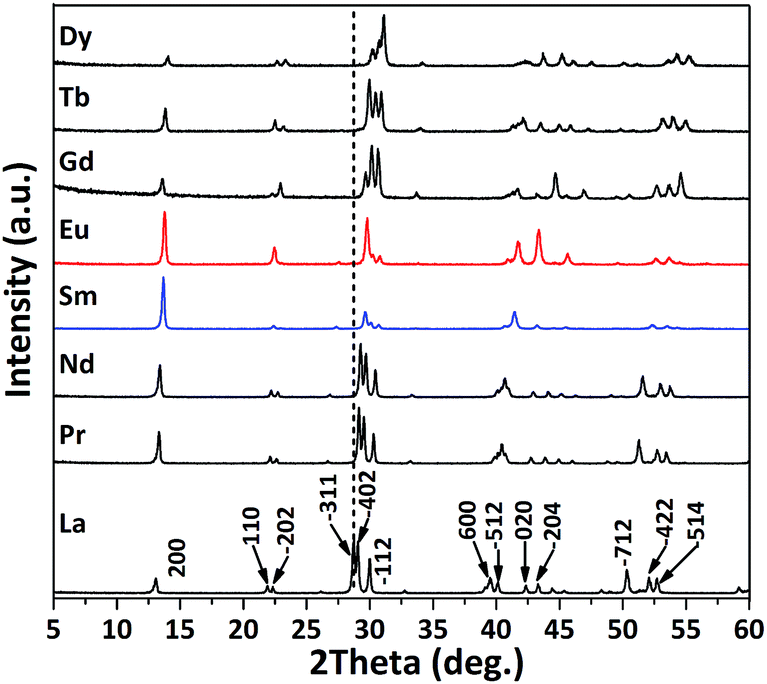
Fig. 1 shows the XRD patterns of the products obtained via the hydrothermal reaction at 100 °C and pH = 9 for the entire lanthanide family (La–Lu). It can be seen that the La–Gd products conform well to the reported Ln-241 compounds,1,31 whose phase purity and composition were further verified by the results of Rietveld refinements (Fig. S1†) and ICP analysis (Table S1†). The Ce product contains a CeO2 impurity (indicated with an asterisk, ∼28 wt%, detected by refinement) since Ce3+ is easily oxidized to Ce4+ in air at elevated temperatures, especially in an alkaline medium. The XRD peaks were indexed based on the results of Rietveld refinement, and the results are shown in Fig. 1 with La-241 as the reference. It was noticed that the (h00) diffraction peaks (such as (200)) only slightly shift towards the high-angle side with the decreasing ionic radius of Ln3+, which is in sharp contrast to that observed for the non-(h00) peaks (such as (111)). This is due to the layered crystal structure and the peculiar crystalline nature of Ln-241 compounds, as has been discussed later. The diffraction patterns of the Tb–Ho compounds were indexed to the Ln-251 phase of Ln2(OH)5(SO4)0.5·nH2O,32 and the presence of SO42− instead of NO3− as the dominant interlayer anion was confirmed by the results of FTIR (Fig. S2†) and ICP (Table S1†) analysis. The (002) and (220) reflections of Ln-251 shift towards lower and higher angles with the decreasing size of Ln3+ due to the expanded interlayer distance and contracted ab plane of the crystal structure, respectively, as previously reported.33 The XRD peaks of the Tm–Lu products cannot be indexed to any single phase according to the currently available standard diffraction files or reported references. However, both FTIR (Fig. S2†) and ICP (Table S1†) analyses suggest that they share high similarities with the Tb–Ho products in terms of chemical composition. The different XRD patterns may be mostly due to co-crystallization of high-hydration (HH) and low-hydration (LH) phases, as preliminarily analyzed in Fig. 1. The Er product exhibits an amorphous diffraction pattern, and appears to be a transition state between those of Ho and Tm.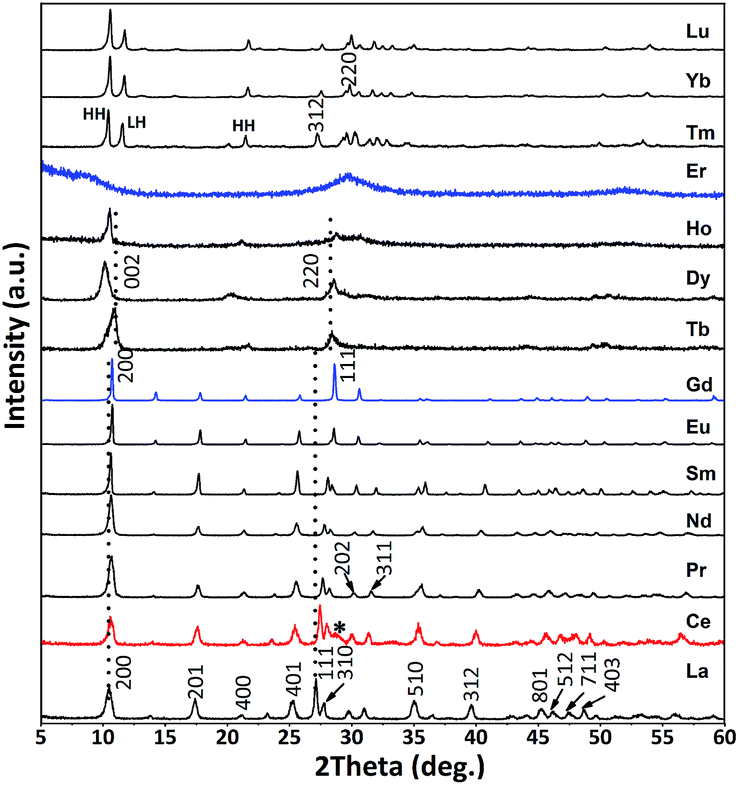 | ||
| Fig. 1 XRD patterns of the products obtained via the hydrothermal reaction at 100 °C and pH = 9 for 24 h. | ||
The abovementioned results unambiguously demonstrate the remarkable effect of Ln3+ size on the chemical composition and phase structure of the products. In the current reaction system, Ln3+ would undergo hydration and partial hydrolysis to form [Ln(OH)x(H2O)y(SO4)z]3−x−2z complex ions.34,35 The enhanced hydrolysis towards a smaller Ln3+, driven by lanthanide contraction, would lead to a higher OH−/Ln3+, whereas a lower SO42−/Ln3+ molar ratios, resulting in a phase transition from Ln2(OH)4SO4·nH2O (Ln = La–Gd) to Ln2(OH)5(SO4)0.5·nH2O (Ln = Tb–Lu). Taking the abovementioned discussion into consideration, we lowered the solution pH to 7 and successfully obtained the Ln-241 compound for not only Tb3+ but also for the smaller Dy3+ ion (Fig. S3†). Rietveld refinements (Fig. 3a) revealed that the newly synthesized Dy2(OH)4SO4·nH2O has a monoclinic structure and is isostructural to its La–Tb counterparts (Fig. S1†). Note that efforts to obtain Ln2(OH)4SO4·nH2O for even smaller Ho–Lu ions failed even at pH = 7 although systematic experiments were performed in the wide temperature range of 100–200 °C. When the compounds with larger Ln ions such as La–Gd were synthesized at pH = 7 and 100 °C, it was found that they tend to crystallize as the less OH−-containing Ln(OH)SO4 compound, and the pure Ln-241 phase was only obtained for Gd. These results further illustrate the effect of Ln3+ size on the hydrolysis and the importance of process conditions.
The products crystallized at 100 °C and pH = 9 show morphologies dependent on the type (ionic size) of Ln3+ (Fig. S4†). For the Ln-241 phase, it was observed that the La–Nd products consist of nanoplates (length up to ∼1 μm), whereas Sm–Gd products consist of microplates (length up to ∼50 μm). These results suggest a substantially lower nucleation density for the latter group. The Ln-251 compounds of Tb–Ho (Ln2(OH)5(SO4)0.5·nH2O) as well as the amorphous product of Er tend to be round particles although the extent of aggregation varies. The products of Ln = Tm–Lu also adopt plate-like morphologies although they are not the intended Ln-241 phase.
Fig. 2 shows the morphologies of the Ln-241 compounds obtained at 100 °C and pH = 7, where it can be seen that the particles are well dispersed and adopt spherical (for Gd, ∼50 μm), peanut (for Tb, ∼40 μm in length), and dumbbell (for Dy, up to ∼130 μm in length) shapes. Closer observation (insets) revealed that the fundamental building blocks of these differently shaped particles are similar plate-like crystallites, conforming well to the layered structure of Ln-241. Upon comparing the SEM images of Gd-241 synthesized at pH = 7 (Fig. 2, spheres aggregated from plates) and pH = 9 (Fig. S4,† dispersed plates), it was obvious that solution pH significantly affects the particle morphology. The surfaces of the platelike primary crystallites of Ln-241 tend to be protonated in a neutral or acidic solution, which attracts negatively charged SO42− via electrostatic interaction and/or hydrogen bonding. As a result, the primary crystallites are glued together by the SO42− groups to form the aggregates observed in Fig. 2. In an alkaline solution (pH = 9), the crystallite surface hardly contains any H+, and the absence of the gluing effects of SO42− may lead to dispersed plate-like crystallites, as observed in Fig. S4.†
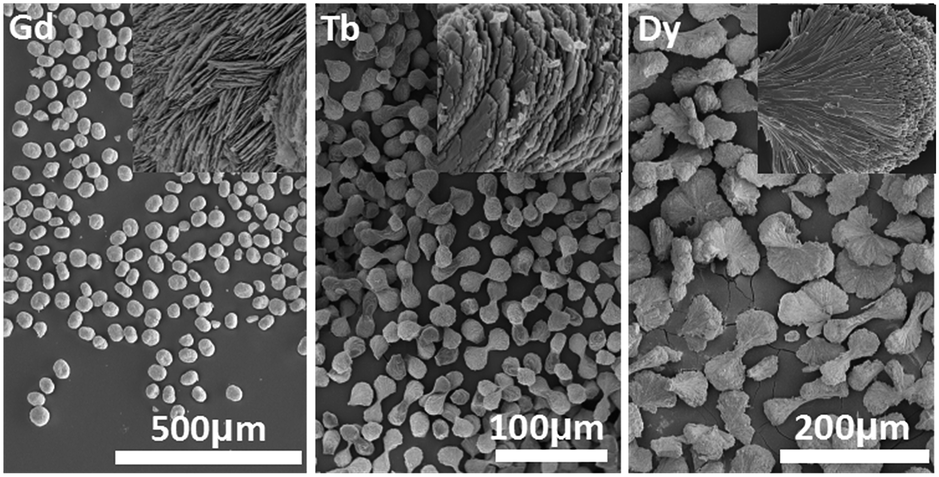 | ||
| Fig. 2 SEM images of the Ln2(OH)4SO4·nH2O products (Ln = Gd, Tb, and Dy) obtained via the hydrothermal reaction at 100 °C and pH = 7. The insets are the corresponding high resolution FESEM images. | ||
Since Dy-241 is a new member of the Ln-241 family and its structural parameters have not been reported before, a detailed Rietveld refinement was carried out for this compound against its analogues (Fig. 3a), using the crystallographic data previously reported for La-241.36 The main processing parameters and the refinement results are summarized in Table S2.† Clearly, all the X-ray diffractions of Dy-241 are well indexed to the monoclinic cell (C2/m) and the compound is isostructural to the already reported Ln = La–Tb counterparts, but with smaller cell parameters and cell volume. The deduced lattice constants (a, b, and c) and axis angle (β) for the Ln = La–Dy series are shown in Fig. 3c–f and Table S3,† where it can be seen that the abovementioned structural parameters all monotonously decrease with the decreasing size of Ln3+. The gallery height of Ln-241 is (a![[thin space (1/6-em)]](https://www.rsc.org/images/entities/char_2009.gif) sinβ)/2, and thus, the decreasing a constant also indicates a gradually contracting interlayer distance in the structure. It was also noticed that with a decrease in the ionic radius, from La3+ to Dy3+, the b and c constants experienced a decrease of 6.6% and 3.4%, respectively, whereas a decrease of only 1.8% was observed for the a constant. The much smaller decrease in the a constant is primarily due to the constraining effects of the SO42− interlayer (Fig. 3b) since the sulfate tetrahedron only shows a rather limited distortion in most crystal structures. This also agrees well with the sluggish shift of the (200) diffraction peaks, as observed in Fig. 1.
sinβ)/2, and thus, the decreasing a constant also indicates a gradually contracting interlayer distance in the structure. It was also noticed that with a decrease in the ionic radius, from La3+ to Dy3+, the b and c constants experienced a decrease of 6.6% and 3.4%, respectively, whereas a decrease of only 1.8% was observed for the a constant. The much smaller decrease in the a constant is primarily due to the constraining effects of the SO42− interlayer (Fig. 3b) since the sulfate tetrahedron only shows a rather limited distortion in most crystal structures. This also agrees well with the sluggish shift of the (200) diffraction peaks, as observed in Fig. 1.
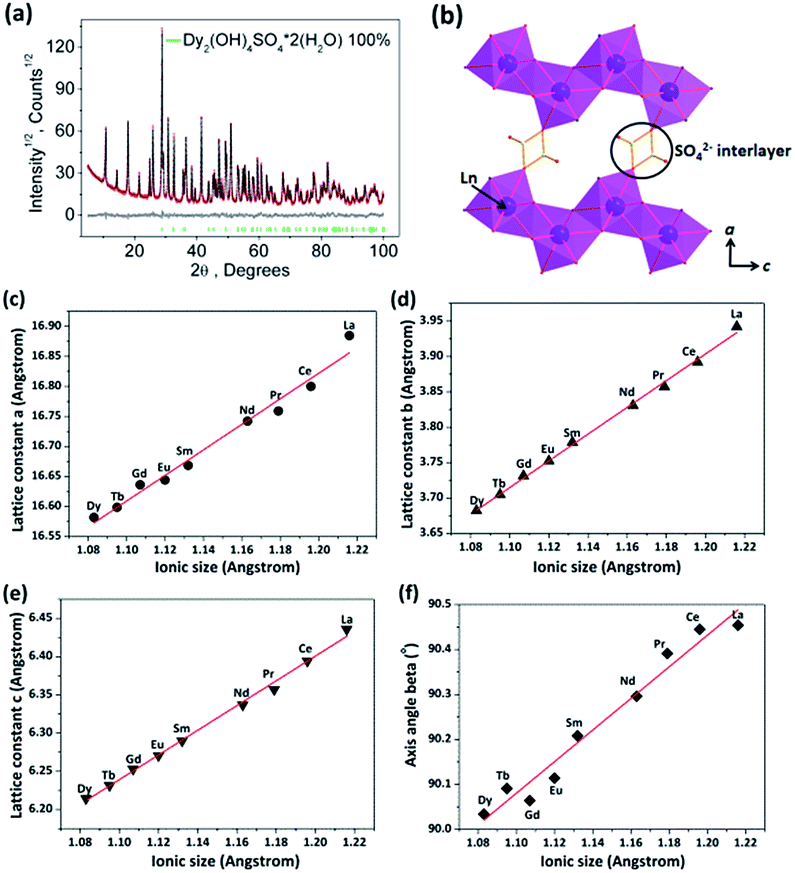 | ||
| Fig. 3 (a) Observed (black) and calculated (red) XRD patterns and the difference (gray) for Dy-241, where the Bragg reflections are indicated with green tick marks; (b) illustration of the layered stacking pattern in the crystal structure of Dy-241; (c–e) correlation of lattice constants and (f) axis angle with the Ln3+ radius for the Ln-241 compound series (Ln = La–Dy). The ionic radius for the 9-fold coordinated Ln3+ is cited from ref. 37. | ||
Thermal analysis, stability of Ln2O2SO4, and green synthesis of Ln2O2S (Ln = La–Dy, except for Ce)
The thermal decomposition process of Ln-241 (Ln = La–Dy) was comparatively investigated via TG/DTA in the wide temperature range from RT to 1560 °C, and the results are shown in Fig. 4 for the two boundary compositions of La-241 and Dy-241 and in Fig. S5† for the rest. It was observed that the compounds similarly undergo dehydration (product: Ln2(OH)2SO4), dehydroxylation (product: Ln2O2SO4), and desulfuration (product: Ln2O3) at the increasingly higher temperatures, with each stage accompanied by an endotherm. The decomposition data are tabulated in Table 1 for the entire series, together with the number of water molecules (the n value, ∼2) calculated from the first stage of decomposition. Clearly, the predicted (Table S4†) and observed (Table 1) weight losses agree well with each other, which supports the abovementioned decomposition procedures.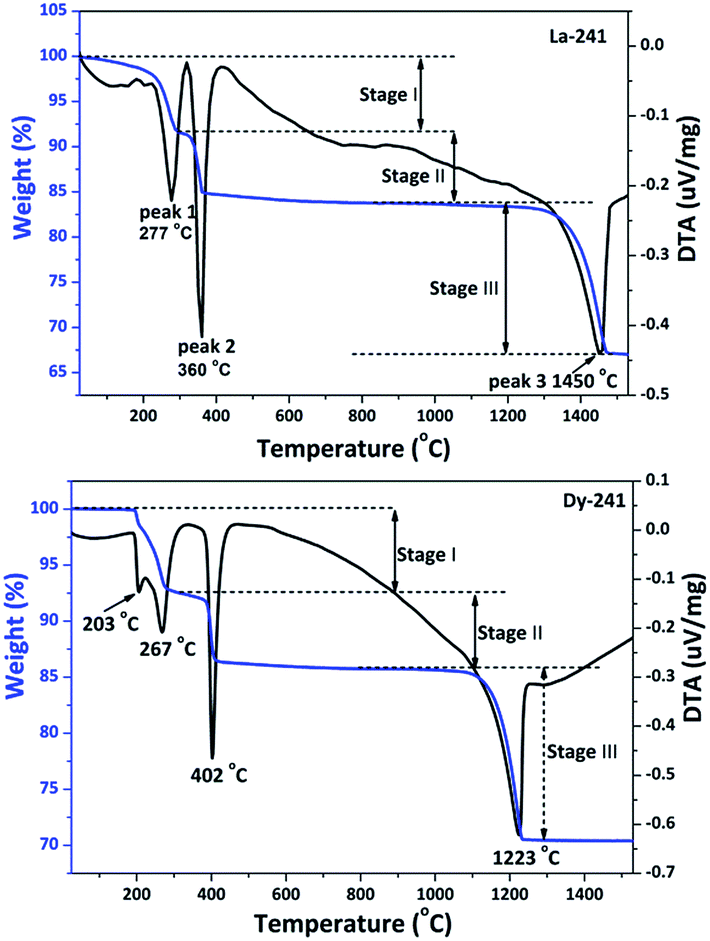 | ||
| Fig. 4 TG/DTA curves for the La-241 and Dy-241 compounds. | ||
| Ln | Peak 1 (°C) | Peak 2 (°C) | Peak 3 (°C) | Platform range | n value | Weight loss I (%) | Weight loss II (%) | Weight loss III (%) | Total weight loss (%) |
|---|---|---|---|---|---|---|---|---|---|
| La | 277 | 360 | 1450 | 405–1300 | 2.20 | 8.24 | 7.92 | 16.78 | 32.94 |
| Pr | 276 | 352 | 1359 | 407–1220 | 2.37 | 8.76 | 8.30 | 16.47 | 33.53 |
| Nd | 274 | 353 | 1325 | 410–1180 | 2.31 | 8.56 | 7.79 | 16.14 | 32.49 |
| Sm | 272 | 363 | 1288 | 420–1150 | 2.17 | 7.76 | 7.38 | 15.78 | 30.92 |
| Eu | 269 | 371 | 1268 | 425–1130 | 2.16 | 7.69 | 7.19 | 15.64 | 30.52 |
| Gd | 265 | 387 | 1284 | 441–1120 | 2.16 | 7.57 | 7.05 | 15.96 | 30.58 |
| Tb | 267 | 396 | 1250 | 450–1110 | 2.15 | 7.43 | 7.27 | 15.59 | 30.29 |
| Dy | 267 | 402 | 1223 | 460–1080 | 2.02 | 6.92 | 7.16 | 15.42 | 29.50 |
It was noticed from Table 1 that the temperature of dehydroxylation (peak 2, removal of OH−) tends to increase, whereas that of desulfuration (peak 3, removal of SO42−) decreases as the Ln3+ size decreases. This leads to a gradually narrowed platform between the two peaks. It can thus be inferred that the stable temperature for Ln2O2SO4 decreases for smaller Ln3+, and La2O2SO4 is the most stable amongst the Ln2O2SO4 series of compounds. According to Pearson hard–soft–acid–base (HSAB) theory,38,39 both OH− and SO42− are bases, whereas Ln3+ is an acid. The chemical hardness of OH− and SO42− is constant for the series, whereas the acid hardness of Ln3+ increases with the decreasing size of Ln3+ due to lanthanide contraction. As the hardness of OH− is greater than that of SO42−, the coordination of OH− and SO42− to Ln3+ becomes tighter and looser, respectively, as Ln goes from La to Lu, which leads to the observed gradually more difficult dehydroxylation and easier desulfuration. The dehydration (peak 1) temperature also tends to decrease as the Ln3+ size decreases, which may imply that the water molecules move towards an outer layer of the coordination sphere of Ln3+ or a looser coordination of H2O to the Ln3+ center.
Calcining the Ln-241 compounds at 1000 °C for 1 h produced phase-pure Ln2O2SO4 with a monoclinic structure (Ln = La–Dy, except for Ce), whose XRD patterns are shown in Fig. 5. The diffraction peaks clearly drift towards higher angles as the Ln3+ size decreases, indicating a contracted unit cell in the structure. The derived lattice constants, cell volume, and axis angle are summarized in Table S5.† Upon observation of the morphology (Fig. S6†), it was found that La2O2SO4 is comprised of round particles disintegrated from La-241 nanoplates (Fig. S4†); Pr2O2SO4 and Nd2O2SO4 tend to preserve the plate-like morphologies of their precursors (Fig. S4†) although partial disintegration is evident, whereas the Sm–Dy oxysulfates fully inherit the morphology of their precursors (Fig. S4† and Fig. 2).
 | ||
| Fig. 5 XRD patterns of the Ln2O2SO4 products obtained by the calcination of Ln2(OH)4SO4·nH2O (Ln-241) at 1000 °C for 1 h in air (Ar for Tb-241 and Pr-241). | ||
Fig. 6 exhibits the XRD patterns of the products obtained by calcination of Ln-241 under flowing H2 at 1200 °C for 1 h. The diffraction peaks can be indexed to a pure or nearly pure phase of Ln2O2S with hexagonal structure. The trace amount of oxide impurity (indicated with an asterisk), observed in the Tb (∼6 wt%) and Dy (∼8 wt%) products, might be due to an insufficient reducing power of H2 and/or lower thermal stability of Tb2O2SO4 and Dy2O2SO4 (Table 1). The synthetic approach for Ln2O2S does not involve any toxic sulfurizing reagent and has water vapor as the only exhaust, thus showing clear advantages over previous procedures.26,27,40,41 The diffraction peaks steadily shift to higher angles as the Ln3+ size decreases, which is in agreement with the decreasing lattice constants and cell volume, as shown in Table S6.† The resultant Ln2O2S particles (Fig. S7†) tend to adopt the morphologies observed for Ln2O2SO4, and the primary particles of the Sm–Dy products become significantly porous upon desulfuration (inset of Fig. S7†).
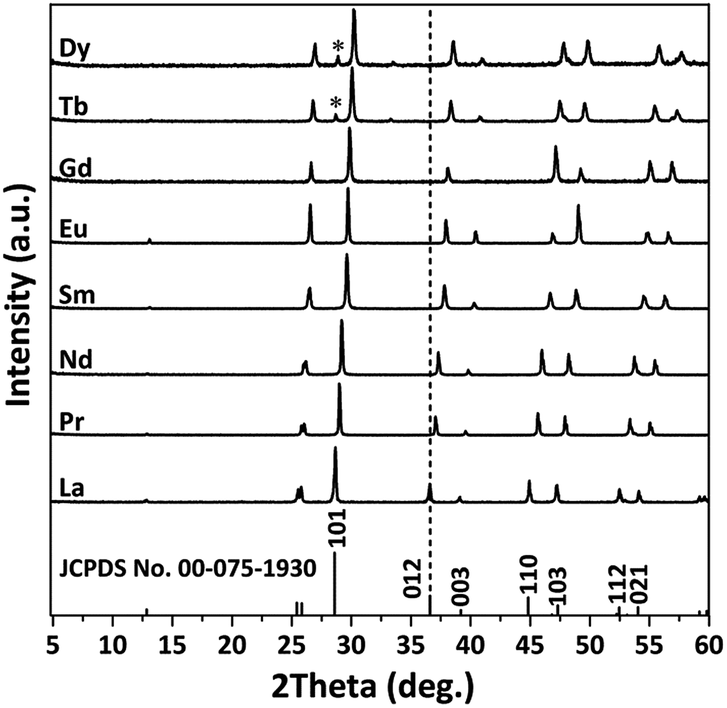 | ||
| Fig. 6 XRD patterns of the products obtained by the calcination of Ln2(OH)4SO4·nH2O under flowing H2 at 1200 °C for 1 h. | ||
Photoluminescence measurements for the (Gd,RE)2O2S and (Gd,RE)2O2SO4 phosphors (RE = Eu or Tb)
By the abovementioned hydrothermal strategy, Gd2(OH)4SO4·nH2O (Gd-241) separately doped with 5 at% of Eu3+ ((Gd0.95Eu0.05)-241) and 1 at% of Tb3+ ((Gd0.99Tb0.01)-241) was successfully crystallized at 100 °C and at pH = 7 (Fig. S8†), which yielded phase-pure (Gd,RE)2O2SO4 and (Gd,RE)2O2S phosphors by calcination at 1000 °C in air (Ar for (Gd0.99Tb0.01)-241) and at 1200 °C in H2, respectively (Fig. S8†). The structural parameters of these materials are summarized in Table S7.† Neither Eu- nor Tb-doping appreciably affected the particle morphology of the product, as observed in Fig. S6† (Gd2O2SO4) and Fig. S7† (Gd2O2S) and those shown in Fig. 7 for the Eu3+-doped products.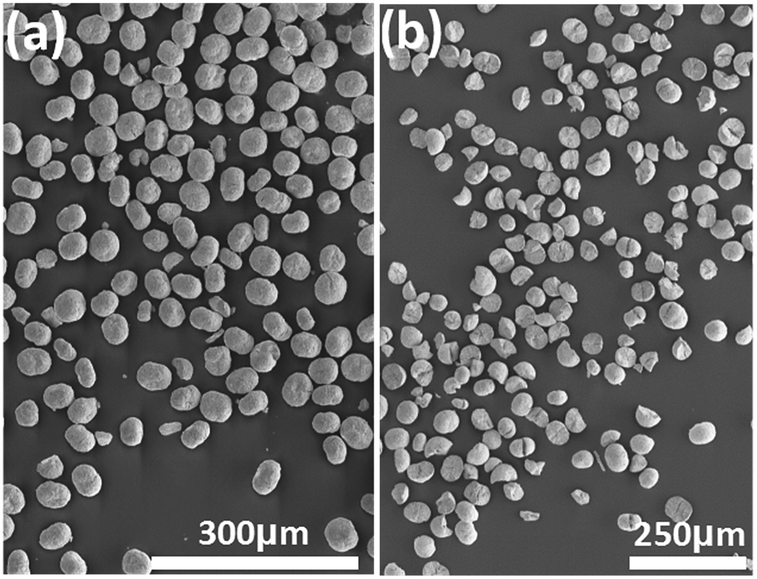 | ||
| Fig. 7 FESEM images showing the particle morphologies of the resultant (Gd0.95Eu0.05)2O2SO4 (a) and (Gd0.95Eu0.05)2O2S (b) phosphors. | ||
Fig. 8 shows the PLE and PL spectra of Eu3+- and Tb3+-doped Gd2O2SO4 and Gd2O2S, with the electronic transitions assigned in the figures. The excitation spectrum of Eu3+ in Gd2O2SO4 (λem = 618 nm, Fig. 8a) presents a strong band centered at 277 nm in the 200–350 nm region and weaker intra-4f6 transitions at longer wavelengths in the range of 350–500 nm. The 8S7/2 → 6IJ transition of Gd3+ is mostly observed at 275 nm in many hosts,42–44 and thus, the 277 nm band may be resulted from overlapping of the 8S7/2 → 6IJ transition band of Gd3+ with the O2− → Eu3+ charge transfer band. Under 277 nm excitation, the typical 5D0 → 7FJ (J = 1–4) transitions of Eu3+ were observed in the 500–800 nm region, with the 5D0 → 7F2 emission at 618 nm being predominant. On the other hand, the excitation spectrum of Eu3+ in Gd2O2S (λem = 625 nm, Fig. 8b) is characterized by a strong and broad band in the ∼200–400 nm region that is composed of O2− → Eu3+ charge transfer (peaked at ∼265 nm), the 8S7/2 → 6IJ transition of Gd3+ (at ∼277 nm), and the S2− → Eu3+ charge transfer (at ∼342 nm). Exciting the phosphor at 342 nm similarly leads to 5D0 → 7FJ Eu3+ transitions, with the 5D0 → 7F2 emission at ∼625 nm being the strongest. The Eu3+ ions in Gd2O2SO4 and Gd2O2S present the low-site C1 and C3v symmetries, respectively, and thus a stronger electric dipole 5D0 → 7F2 transition than magnetic dipole 5D0 → 7F1 transition was observed for both the cases.21,45
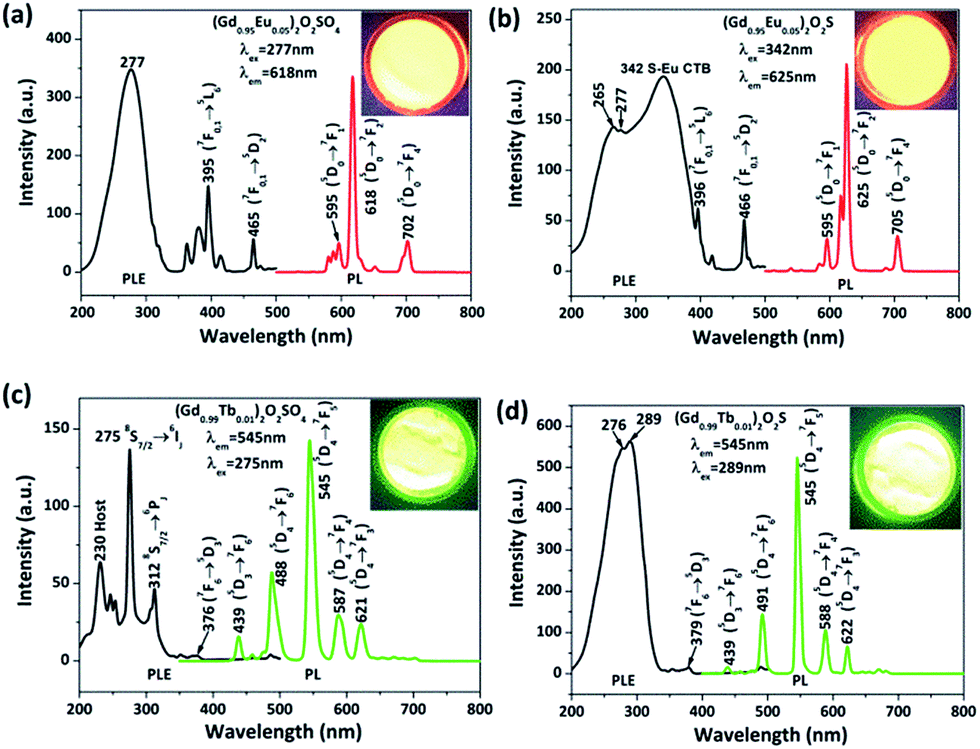 | ||
| Fig. 8 PLE and PL spectra of the (Gd,RE)2O2SO4 and (Gd,RE)2O2S phosphors (RE = Eu or Tb). The inset shows the appearance of luminescence under UV irradiation of the corresponding phosphor from a hand-held UV lamp (365 nm for (Gd0.95Eu0.05)2O2S and 254 nm for the rest). | ||
The PLE spectrum of (Gd0.99Tb0.01)2O2SO4 (λem = 545 nm, Fig. 8c) presents several sharp peaks in the ∼200–325 nm region, with the 8S7/2 → 6IJ transition of Gd3+ at 275 nm being the strongest. The peak at 230 nm is due to host absorption.36 Under 275 nm excitation, the 5D3,4 → 7FJ (J = 3–6) emissions of Tb3+, with the green one at 545 nm being the strongest, were observed, indicating an efficient energy transfer from Gd3+ to Tb3+. A distinctly different PLE spectrum was produced for Tb3+ in Gd2O2S for the same monitoring wavelength of 545 nm, which displayed a strong and broad band in the 200–340 nm region (peaked at 289 nm) that is resulted from overlapping of 8S7/2 → 6IJ Gd3+ transition with 4f8 → 4f75d1 inter-configurational Tb3+.46,47 Exciting the phosphor at 289 nm produced a PL profile similar to that of (Gd0.99Tb0.01)2O2SO4 (Fig. 8d). The Eu3+- and Tb3+-doped phosphors have quantum yields of ∼21–42% for different compositions, as shown in Table 2.
| Samples | Lifetime (ms) | CIE (x, y) | Crystallite size (nm) | Quantum yield (%) |
|---|---|---|---|---|
| (Gd0.95Eu0.05)2O2SO4 | 1.41 (0.01) | (0.657, 0.343) | 43 | 28.6 |
| (Gd0.95Eu0.05)2O2S | 0.80 (0.01) | (0.669, 0.330) | 55 | 20.6 |
| (Gd0.99Tb0.01)2O2SO4 | 2.25 (0.01) | (0.327, 0.519) | 38 | 21.5 |
| (Gd0.99Tb0.01)2O2S | 1.27 (0.01) | (0.329, 0.569) | 57 | 42.0 |
The fluorescence decay for both Eu3+ and Tb3+ in Gd2O2SO4 and Gd2O2S was found to follow a single exponential mode in each case (Fig. S9†), and the derived lifetime values are displayed in Table 2. Generally, shorter lifetimes were observed for Gd2O2S with both Eu3+ and Tb3+. No lifetime data are available for (Gd,Tb)2O2SO4 for a direct comparison, but the lifetimes determined in this study for (Gd,Eu)2O2SO4 (1.41 ms), (Gd,Eu)2O2S (0.80 ms), and (Gd,Tb)2O2S (1.27 ms) are in reasonable agreement with the reported values of 1.31–1.86 ms for (Gd,Eu)2O2SO4 and (Y,Eu)2O2SO4,48,49 0.66–0.92 ms for (Gd,Eu)2O2S and (Y,Eu)2O2S,50,51 and 0.78–1.10 ms for (Gd,Tb)2O2S and (La,Tb)2O2S.51,52 The CIE color coordinates derived from the PL spectra are shown in Table 2 and Fig. S10,† where it can be seen that Tb3+ and Eu3+ ions in Gd2O2S have more green and red components, respectively. Table 2 also shows that (Gd,RE)2O2SO4 has a generally smaller crystallite size than (Gd,RE)2O2S owing to its lower temperature of calcination.
Cathodoluminescence (CL) properties of the (Gd,Tb)2O2S green phosphor
Fig. 9 shows the cathodoluminescence (CL) spectrum of the (Gd0.99Tb0.01)2O2S green phosphor. The emission spectrum (Fig. 9a) obtained under a constant electron-beam current of 25 μA is similar to the PL emission spectrum displayed in Fig. 8d. The emission intensity improved as the acceleration voltage increased and the color coordinates were almost constant, which indicates a good luminescence stability for the phosphor. For cathodoluminescence measurements, the activators are excited by the plasma produced by the incident electrons. A higher beam current will generate more plasma, and hence, an enhanced emission brightness was observed upon increasing beam current under a fixed acceleration voltage of 3 kV (Fig. 9b). On the other hand, electron energy increases with the increasing acceleration voltage, allowing the electrons to penetrate deeper into the phosphor particles, which leads to an increased electron–solid interaction and thus improved CL brightness of the phosphor under a fixed current of 25 μA (Fig. 9c). The electron penetration depth can be correlated to the acceleration voltage and material properties by the following equations:53,54| L [Å] = 250(A/ρ)(E/Z1/2)n | (1) |
|
N = 1.2/(1 − 0.29log10Z)
| (2) |
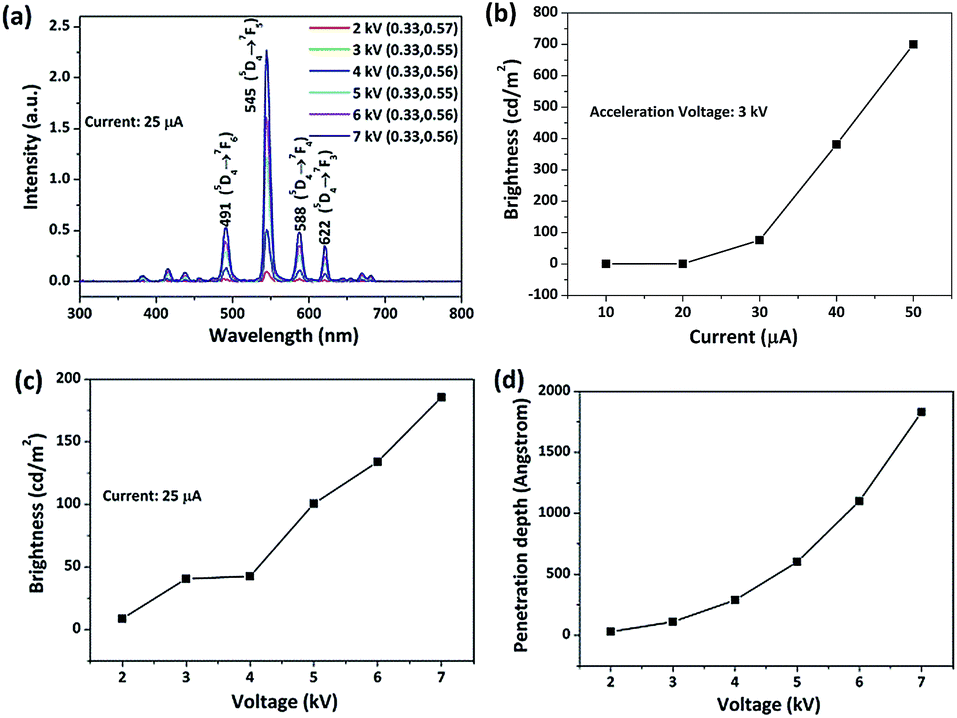 | ||
| Fig. 9 (a) Cathodoluminescence spectrum of the (Gd0.99Tb0.01)2O2S green phosphor, obtained under a fixed electron beam current of 25 μA; brightness of emission versus (b) irradiation current and (c) acceleration voltage; and (d) calculated penetration depth as a function of the acceleration voltage. | ||
Conclusions
The layered sulfate-based Ln2(OH)4SO4·nH2O hydroxide (Ln-241) was systematically studied in terms of hydrothermal synthesis conditions, crystal structure, and thermal behaviour, and the effect of lanthanide contraction was revealed. It was also shown that Ln-241 can be facilely transformed into the two important groups of Ln2O2SO4 and Ln2O2S compounds via water removal for potential applications including luminescence. The main conclusions are summarized as follows:(1) the hydrothermal product transforms from Ln2(OH)4SO4·nH2O (Ln = La–Gd) to Ln2(OH)5(SO4)0.5·nH2O (Ln = Tb–Lu) with the decreasing ionic size of Ln at 100 °C and pH = 9. Lowering the solution pH to 7 allows the crystallization of pure Ln-241 for the smaller Dy3+ ion, thus extending the Ln-241 family of compounds. The decrease in the Ln3+ size leads to increasingly smaller lattice parameters (a, b, and c), cell volume, and axis angle across the Ln series (La–Dy).
(2) Ln2(OH)4SO4·nH2O shows three steps of weight loss upon heating in air that correspond to dehydration, dehydroxylation, and desulfurization. The temperature of the 2nd stage tends to increase, whereas those of the 1st and 3rd stages tend to decrease as the Ln3+ size decreases. As a result, the stable temperature range for Ln2O2SO4 narrows as the Ln3+ size decreases. Calcining the Ln-241 compounds in air at 1000 °C and in H2 at 1200 °C produces Ln2O2SO4 and Ln2O2S, respectively, with water vapour as the only exhaust.
(3) The Eu3+ and Tb3+ activators in Gd2O2SO4 and Gd2O2S produce red and green emissions, respectively, due to their characteristic f–f transitions under UV excitation, and the effect of the host lattice was revealed in terms of excitation, emission, fluorescence decay, quantum yield, and emission color. Through cathodoluminescence measurements, it was found that (Gd0.99Tb0.01)2O2S is stable in the studied range and exhibits an increasingly higher emission brightness on increasing either the acceleration voltage (up to 7 kV) or the electron beam current (up to 50 μA).
Acknowledgements
This work was partly supported by the National Natural Science Foundation of China (Grants No. 51672039, 51172038, and 51302032), the Fundamental Research Fund for the Central Universities (Grant No. N140204002), the Grants-in-Aid for Scientific Research (KAKENHI No. 26420686), and the Russian Foundation for Basic Research (15-52-53080). Xuejiao Wang acknowledges the financial support received from the China Scholarship Council for her overseas Ph. D. study at the National Institute of Materials Science (Contract No. 201406080035).Notes and references
- J. B. Liang, R. Z. Ma, F. X. Geng, Y. Ebina and T. Sasaki, Chem. Mater., 2010, 22, 6001 CrossRef CAS.
- J. B. Liang, R. Z. Ma and T. Sasaki, Photofunctional Layered Materials, Struct. Bonding, 2015, 166, 69 CrossRef CAS.
- X. L. Wu, J.-G. Li, Q. Zhu, W. G. Liu, J. Li, X. D. Li, X. D. Sun and Y. Sakka, J. Mater. Chem. C, 2015, 3, 3428 RSC.
- F. X. Geng, Y. Matsushita, R. Z. Ma, H. Xin, M. Tanaka, F. Izumi, N. Iyi and T. Sasaki, J. Am. Chem. Soc., 2008, 130, 16344 CrossRef CAS PubMed.
- K.-H. Lee, B. I. Lee, J. H. You and S. H. Byeon, Chem. Commun., 2010, 46, 1461 RSC.
- L. J. McIntyre, L. K. Jackson and A. M. Fogg, J. Phys. Chem. Solids, 2008, 69, 1070 CrossRef CAS.
- H. J. Jeong, B.-I. Lee and S.-H. Byeon, ACS Appl. Mater. Interfaces, 2016, 8, 10946 CAS.
- F. X. Geng, R. Z. Ma, Y. Matsushita, J. B. Liang, Y. Michiue and T. Sasaki, Inorg. Chem., 2011, 50, 6667 CrossRef CAS PubMed.
- J. H. Wu, J. B. Liang, R. Z. Ma and T. Sasaki, J. Phys. Chem. C, 2015, 119, 26229 CAS.
- G. Ferru, B. Reinhart, M. K. Bera, M. O. de la Cruz, B. F. Qiao and R. J. Ellis, Chem.–Eur. J., 2016, 22, 6899 CrossRef CAS PubMed.
- M. Seitz, A. G. Oliver and K. N. Raymond, J. Am. Chem. Soc., 2007, 129, 11153 CrossRef CAS PubMed.
- D. J. Zhang, F. Yoshioka, K. Ikeue and M. Machida, Chem. Mater., 2008, 20, 6697 CrossRef CAS.
- J. D. Lessard, I. Valsamakis and S. M. Flytzani, Chem. Commun., 2012, 48, 4857 RSC.
- I. Valsamakis and M. Flytzani-Stephanopoulos, Appl. Catal., B, 2011, 106, 255 CAS.
- S. Yamamoto, S. Tamura and N. Imanaka, J. Alloys Compd., 2006, 418, 226 CrossRef CAS.
- T. Yang, A. L. Shaula, S. M. Mikhalev, D. Ramasamy and D. P. Fagg, J. Power Sources, 2016, 306, 611 CrossRef CAS.
- J. B. Lian, X. D. Sun, Z. G. Liu, J. Y. Yu and X. D. Li, Mater. Res. Bull., 2009, 44, 1822 CrossRef CAS.
- F. S. Chen, G. Chen, T. Liu, N. Zhang, X. H. Liu, H. M. Luo, J. H. Li, L. M. Chen, R. Z. Ma and G. Z. Qiu, Sci. Rep., 2015, 5, 17934 CrossRef CAS PubMed.
- J. W. Haynes and J. J. Brown Jr, J. Electrochem. Soc., 1968, 115, 1060 CrossRef CAS.
- M. Shoji and K. Sakurai, J. Alloys Compd., 2006, 426, 244 CrossRef CAS.
- X. J. Wang, J.-G. Li, Q. Zhu and X. D. Sun, J. Mater. Res., 2016, 31, 2268 CrossRef CAS.
- S. David, C. Michail, I. Seferis, I. Valais, G. Fountos, P. Liaparinos, I. Kandarakis and N. Kalyvas, J. Lumin., 2016, 169, 706 CrossRef CAS.
- J. Liu, H. D. Luo, P. J. Liu, L. X. Han, X. Zheng, B. Xu and X. B. Yu, Dalton Trans., 2012, 41, 13984 RSC.
- S. A. Osseni, S. Lechevallier and M. Verelst, et al., Nanoscale, 2014, 6, 555 RSC.
- H. Mass, Penetration phosphors for display devices, US Pat., 4,105,909, Sperry Rand Corporation, 1978.
- C. R. Ronda, G. Zeitler, H. Schreinemacher, N. Conrads and D. U. Wiechert, Gd2O2S material for use in CT applications, US Pat., US 2011/0114887 A1, Koninklijke Phillips Electronics, N. V., Eindhoven, NL, 2011.
- D. K. Nath and M. Ohio, Preparation of rare earth oxysulfide luminescent materials, US Pat., 3856698, General Electric Company, 1974.
- S.-H. Yu, Z.-H. Han, J. Yang, H.-Q. Zhao, R.-Y. Yang, Y. Xie, Y.-T. Qian and Y.-H. Zhang, Chem. Mater., 1999, 11, 192 CrossRef CAS.
- Y. Kawahara, V. Petrykin, T. Ichihara, N. Kijima and M. Kakihana, Chem. Mater., 2006, 18, 6303 CrossRef CAS.
- TOPAS V4.2: General profile and structure analysis software for powder diffraction data—User's Manual, Bruker AXS, Karlsruhe, Germany, 2008 Search PubMed.
- X. J. Wang, J.-G. Li, Q. Zhu, X. D. Li, X. D. Sun and Y. Sakka, Sci. Technol. Adv. Mater., 2014, 15, 014204 CrossRef PubMed.
- X. J. Wang, J.-G. Li, Q. Zhu and X. D. Sun, J. Am. Ceram. Soc., 2015, 98, 3236 CrossRef CAS.
- X. L. Wu, J.-G. Li, Q. Zhu, J. K. Li, R. Z. Ma, T. Sasaki, X. D. Li, X. D. Sun and Y. Sakka, Dalton Trans., 2012, 41, 1854 RSC.
- L. C. Thompson, Complexes, in Handbook on the Physics and Chemistry of Rare Earths, ed. K. A. Gschneidner Jr and L. Eyring, North-Holland Physics, Amsterdam, 1979 Search PubMed.
- E. N. Rizkalla and G. R. Choppin, J. Alloys Compd., 1992, 180, 325 CrossRef CAS.
- X. J. Wang, J.-G. Li, M. S. Molokeev, Q. Zhu, X. D. Li and X. D. Sun, Chem. Eng. J., 2016, 302, 577 CrossRef CAS.
- R. D. Shannon, Acta Crystallogr., Sect. A: Cryst. Phys., Diffr., Theor. Gen. Crystallogr., 1976, 32, 751 CrossRef.
- R. G. Pearson, J. Am. Chem. Soc., 1963, 85, 3533 CrossRef CAS.
- P. R. Chinnam, R. N. Clymer, A. A. Jalil, S. L. Wunder and M. J. Zdilla, Chem. Mater., 2015, 27, 5479 CrossRef CAS.
- S.-H. Yu, Z.-H. Han, J. Yang, H.-Q. Zhao, R.-Y. Yang, Y. Xie, Y.-T. Qian and Y.-H. Zhang, Chem. Mater., 1999, 11, 192 CrossRef CAS.
- Y. Kawahara, V. Petrykin, T. Ichihara, N. Kijima and M. Kakihana, Chem. Mater., 2006, 18, 6303 CrossRef CAS.
- J. K. Li, J.-G. Li, S. H. Liu, X. D. Li, X. D. Sun and Y. Sakka, J. Mater. Chem. C, 2013, 1, 7614 RSC.
- H. X. Guan, G. X. Liu, J. X. Wang, X. T. Dong and W. S. Yu, New J. Chem., 2014, 38, 4901 RSC.
- X. M. Zhang, F. G. Meng, W. L. Li, S. I. Kim, Y. M. Yu and H. J. Seo, J. Alloys Compd., 2013, 578, 72 CrossRef CAS.
- A. S. Souza and M. A. Couto Dos Santos, Chem. Phys. Lett., 2012, 521, 138 CrossRef CAS.
- P. Dorenbos, J. Lumin., 2000, 91, 91 CrossRef CAS.
- S. Mukherjee, V. Sudarsan, R. K. Vatsa, S. V. Godbole, R. M. Kadam, U. M. Bhatta and A. K. Tyagi, Nanotechnology, 2008, 19, 325704 CrossRef CAS PubMed.
- T. Kijima, T. Shinbori, M. Sekita, M. Uota and G. Sakai, J. Lumin., 2008, 128, 311 CrossRef CAS.
- J. B. Lian, X. D. Sun, Z. G. Liu, J. Y. Yu and X. D. Li, Mater. Res. Bull., 2009, 44, 1822 CrossRef CAS.
- L. Han, M. M. Pan, Y. Lv, Y. T. Gu, X. F. Wang, D. Li, Q. L. Kong and X. T. Dong, J. Mater. Sci.: Mater. Electron., 2015, 26, 677 CrossRef CAS.
- Y. H. Song, H. P. You, Y. J. Huang, M. Yang, Y. H. Zheng, L. H. Zhang and N. Guo, Inorg. Chem., 2010, 49, 11499 CrossRef CAS PubMed.
- Z. G. Liu, X. D. Sun, S. K. Xu, J. B. Lian, X. D. Li, Z. M. Xiu, Q. Li, D. Huo and J.-G. Li, J. Phys. Chem. C, 2008, 112, 2353 CAS.
- C. He, Z. G. Xia and Q. L. Liu, Opt. Mater., 2015, 42, 11 CrossRef CAS.
- J.-G. Li, J. K. Li, Q. Zhu, X. J. Wang, X. D. Li, X. D. Sun and Y. Sakka, RSC Adv., 2015, 5, 59686 RSC.
Footnote |
| † Electronic supplementary information (ESI) available. See DOI: 10.1039/c7ra00645d |
| This journal is © The Royal Society of Chemistry 2017 |