
 Open Access Article
 This Open Access Article is licensed under a
 Creative Commons Attribution 3.0 Unported Licence
Determination of hydrogen sulfide and hydrogen peroxide in complex samples of milk and urine by spectroscopic standard addition data and chemometrics methods
Masoud Shariati-Rad *,
Narges Salarmand and
Farzaneh Jalilvand
*,
Narges Salarmand and
Farzaneh Jalilvand
Department of Analytical Chemistry, Faculty of Chemistry, Razi University, Kermanshah, Iran. E-mail: mshariati_rad@yahoo.com; Fax: +98 833 4274559
First published on 30th May 2017
Abstract
Spectroscopic data of standard additions were collected and used to calculate the spectrum of the unknown interferent(s) based on the net analyte signal. The proposed method was named net analyte signal interferent modelling (NAS-IM). In the next step, an H-point standard addition method was used to obtain the concentration of the analyte in the sample. The method was applied to determine hydrogen sulfide and hydrogen peroxide in urine and milk samples, respectively. The results of the method were validated by analysis of the second-order data of the same samples by multivariate curve resolution-alternating least squares (MCR-ALS) and parallel factor analysis (PARAFAC). The concentration of the analytes calculated by NAS-IM and second-order methods has a maximum difference of 7.7%.
1. Introduction
Spectrophotometric and spectrofluorometric methodologies are good choices for analysis due to their low cost and low time of analysis and due to the generation of few waste products. However, one of the most serious problems that can occur in the above quantitative spectroscopic analyses is the presence of spectral interferents (chemical species which affect the instrumental response related to the analyte).1For solving spectral interferents of a known type, first-order calibration methods, like PLS2–6 are recommended if interferents are included in the modelling samples. Using spectroscopic signals, to overcome the complexity of the samples originating from matrix effects and unknown spectral interferent(s), multi-way chemometrics methods are applicable.7–12
Multiway data can be obtained by expensive and time-consuming instruments like HPLC-DAD, HPLC-MS and GC-MS. In some chemical systems and conditions, second-order data suitable for multiway methods can be acquired using spectrophotometric (spectra recorded with time in kinetic systems) and spectrofluorometric (excitation-emission data) instruments. However, simpler and cheaper approaches in both chemometrics and instrumentation are required.
Originally, net analyte signal (NAS) was introduced as the part of a spectrum that the model relates it to the predicted quantity13 and then it has been extensively used especially in multivariate calibration.14–22
In the previous work,1 based on the concept of NAS, we introduced and validated a method for estimation of the spectrum of the unknown interferent(s) named NAS-IM. Here, the method is applied to determine hydrogen sulfide and hydrogen peroxide in complex real samples suffering from matrix effect and interference from unknown interferent(s) using spectrofluorimetric and spectrophotometric data. Moreover, the method validated using second-order data of the analyzed systems and multivariate curve resolution-alternating least squares (MCR-ALS).
Although hydrogen sulfide is known as a toxic gas and it usually observed in sewers and wastewaters, it can be detected in the human body and other biological systems.23–26 Typical reported concentrations of this gas in blood are in the range of 10–100 μM.27 Detection of hydrogen sulfide can be performed by colorimetric,28 electrochemical,29 and gas chromatographic methods.30 Furthermore, tedious and complicated preparation of the samples is required.
Hydrogen peroxide is important in clinical, environmental and biological studies and it is used in many industrial and related processes as an oxidizing, bleaching and sterilizing agent. Addition of hydrogen peroxide to milk slows down the growth of bacteria and holds up its fermentation. Analysis methods of hydrogen peroxide are usually based on fluorometric31–35 and colorimetric methods36–38 using enzymes. Fluorescence determination of hydrogen peroxide is highly sensitive and relatively free from interferents, however, similar to other enzymatic determinations it suffers from the reagent instability and high cost.39 Chemiluminescence techniques based on the metal-catalyzed oxidation of luminal40–43 have also been used for hydrogen peroxide determination. Chemiluminescence techniques have high sensitivity and low detection limit but suffer from the interference of some cations.40
2. Theory
2.1. NAS-IM
As in the published work,1 we used the modification of Lorber's et al. equations13 presented by Ferre et al.44 for calculation of the NAS. The algorithm and the complete description of the procedure for calculation of the spectrum of the unknown interferent(s) can be found in ref. 1.2.2. Two and three way data analysis by multivariate curve resolution-alternating least squares (MCR-ALS) and parallel factor analysis (PARAFAC)
The algorithm was previously described in detail elsewhere.45,46 The main goal of MCR-ALS is decomposing the original matrix X (n × p) (n rows showing time or other evolutionary variable in UV-Vis data and emission wavelength in EEM data and p columns showing wavelengths in which UV-Vis spectra recorded or wavelengths in which samples excited in EEM data) of a multicomponent system into the underlying bilinear model (X = CST + E). In this equation, C is the matrix of concentration profiles (for e.g. UV-Vis data) or emission spectra (for excitation-emission data), ST the matrix of pure spectra containing absorptivity of the components (for e.g. UV-Vis data) or excitation spectra (for excitation-emission (EEM) data) and E contains the experimental error.In the current work, augmentation was employed to simultaneously analysis different matrices from different standard addition samples by MCR-ALS. Fluorescence data were augmented excitation-wise (keeping the common excitation wavelengths for augmented matrices) and kinetic spectrophotometric data were augmented wavelength-wise (keeping the common wavelengths for augmented matrices).
Here, simple-to-use interactive self-modeling mixture analysis (SIMPLISMA) which identifies the purest variables47,48 was used for calculation of the initial estimate of spectral profiles included in S. In this work, the constraints applied during MCR-ALS optimization were (a) the non-negativity for both emission and excitation spectra and kinetic concentration profiles because they must be always positive and (b) trilinearity because three-way data arrays (EEM data and kinetic spectrophotometric data in this case) are trilinear.
PARAFAC algorithm is a multi-dimensional analysis method. To construct a PARAFAC model for three-way data, a score matrix A (n × F) and loading matrices B (r × F) and C (p × F) are defined, such that the unfolded matrix Xn×rp can be decomposed as49–51
3. Experimental
3.1. Apparatus
Recording of the absorption spectra in the spectral range of 200–400 nm was performed by an Agilent 8453 UV-Vis spectrophotometer equipped with diode array detector in 1 cm path length quartz cells.Recording of the fluorescence spectra in the spectral range of 300–450 nm was performed by using a JASCO spectrofluorimeter (FP 6200) equipped with a xenon discharge lamp and a 1 cm path length quartz cell.
3.2. Reagents and solutions
All of the chemicals and reagents used in this work were of analytical reagent grade. Iron chloride (FeCl2), hydrogen peroxide (35%, w/w), phenol, sodium 1,2-naphthoquinone-4-sulfonate (NQS), hydrochloric acid and sulfuric acid were purchased from Merck (Darmstadt, Germany). Sodium sulfide was from (BDH chemicals Ltd Poole England). Aqueous solutions were prepared in deionized water.3.3. Preparation of samples and standard addition
Determination of hydrogen sulfide is based on the method previously introduced by our research group.52 However, because of the severe interference from unknown species in media such as urine, the exact procedure reported in that work is not applicable.A volume equivalent to 2.50 mL of the stock solution of NQS, 0.50 mL of hydrochloric acid solution with concentration of 0.1 mol L−1 and different volumes (in the order of μL) of the concentrated solution of sodium sulfide were transferred into 5 mL volumetric flasks and completed to the mark with the urine sample. The mixture was mixed well and spectra were recorded against a reagent blank with time in 1 min intervals for 30 min at 25.00 ± 1 °C (for MCR-ALS). This procedure was performed for 0.0, 2.0, 4.0, 6.0 and 8.0 mg L−1 of added standard of hydrogen sulfide. It should be mentioned that the last spectra (after 30 min) in each case were used to analysis by NAS-IM.
Three different milk samples (1, 2 and 3) were commercially obtained from a local supermarket. Prior to the determination, 20 mL of 20% (w/w) trichloroacetic acid was added to 20 mL of each milk sample, followed by stirring for 40 min. Then, the mixture was centrifuged and filtered through a Whatman no. 41 filter paper twice, and the obtained solution was used for the analysis of hydrogen peroxide.
In a series of 10.0 mL volumetric flasks, a volume equivalent to 3.9 mL of the prepared milk sample was added and spiked with different concentrations of hydrogen peroxide. After addition of sulfuric acid (0.18 mol L−1), Fe2+ (6.0 × 10⁻⁴ mol L−1) and phenol (150.0 mg L−1) to the above flasks and mixing well, EEM spectra were recorded in the range of 245–450 nm after excitation at 240–310 nm in 5 nm intervals (for MCR-ALS). For NAS-IM, the same samples were excited at 300 nm and emission spectra were recorded at 305–450 nm.
4. Results and discussion
4.1. Evaluation of matrix effect and unknown spectral interferent(s) in the analyzed milk (for hydrogen peroxide) and urine (for hydrogen sulfide) samples
In order to evaluate matrix effect in the milk samples, separately, the fluorescence intensity was plotted for the pure standards and standard addition samples at maximum of the emission spectrum of the reagents (mixture of sulfuric acid, Fe2+ and phenol) (331 nm) with excitation at 300 nm. The slope of the plot for standard samples is 3.94 × 10⁶ and the slopes for three different milk samples are 2.34 × 10⁶, 3.48 × 10⁶, and 2.29 × 10⁶. The slopes of the standard addition lines to milk samples are 40.6, 11.7 and 41.9% different from the pure standards. Therefore, the matrix effect exists in the determination of hydrogen peroxide in milk samples is confirmed. Matrix effect can be solved by standard addition.In order to show the presence of spectral interferent(s) in the milk samples, comparison of the shape of the emission spectrum of the reagent mixture in the presence of pure analyte and its emission spectrum in the milk samples in the presence of hydrogen peroxide can also be useful (Fig. 1).
 | ||
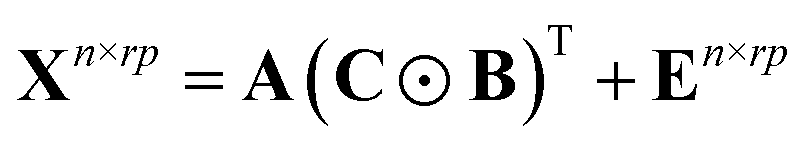
| Fig. 1 Spectra of the reagent blank (0.18 mL concentrated sulfuric acid, Fe2+ 6.0 × 10⁻⁴ mol L−1 and phenol 150.0 mg L−1), reagent blank in the presence of 5.0 × 10⁻⁶ mol L−1 of standard hydrogen peroxide, and different milk samples after addition of 5.0 × 10⁻⁶ (Milk 1), 5.0 × 10⁻⁶ (Milk 2), and 1.0 × 10⁻⁵ (Milk 3). | ||
As can be seen from Fig. 1, blank solution has an emission spectrum with maximum at 331 nm by excitation at 300 nm. By addition of hydrogen peroxide, the intensity of the spectrum decreases. This decrease is related to the amount of hydrogen peroxide. The spectrum of the reagents in three different milk samples shows clear differences. Among differences, the shifts in the maximum emission to 340 nm for Milk 1 and shift to 342 nm for Milk 2 and Milk 3 can be mentioned. Moreover, transfiguration of the spectra can be observed. In milk samples, the emission spectra have been broadened and contain a low intensity peak at about 415 nm. Therefore, there are certain evidences for presence of unknown spectral interferent(s) in the analyzed milk samples. This result clearly shows the existence of bias resulted from spectral interferents.
Similar to the milk samples analyzed for hydrogen peroxide, for evaluating matrix effect, 5 equal aliquots of urines were spiked with different amount of hydrogen sulfide. After 60 min, the spectra of the samples were recorded against the reagent blank containing NQS (5.00 × 10⁻⁴ mol L−1) and hydrochloric acid (1.00 × 10⁻² mol L−1). The two slopes at 320 nm are 0.046 and 0.052 for calibration with pure standards and standard addition curve. Difference between two slopes is 13.0%. Therefore, in the analysis of urine samples for hydrogen sulfide, the presence of matrix effect is deduced.
For showing the presence of unknown interferent(s) in the analyzed urine samples, spectra of a standard solution containing 2.00 mg L−1 hydrogen sulfide and a solution obtained by spiking 2.00 mg L−1 hydrogen sulfide was compared (Fig. 2).
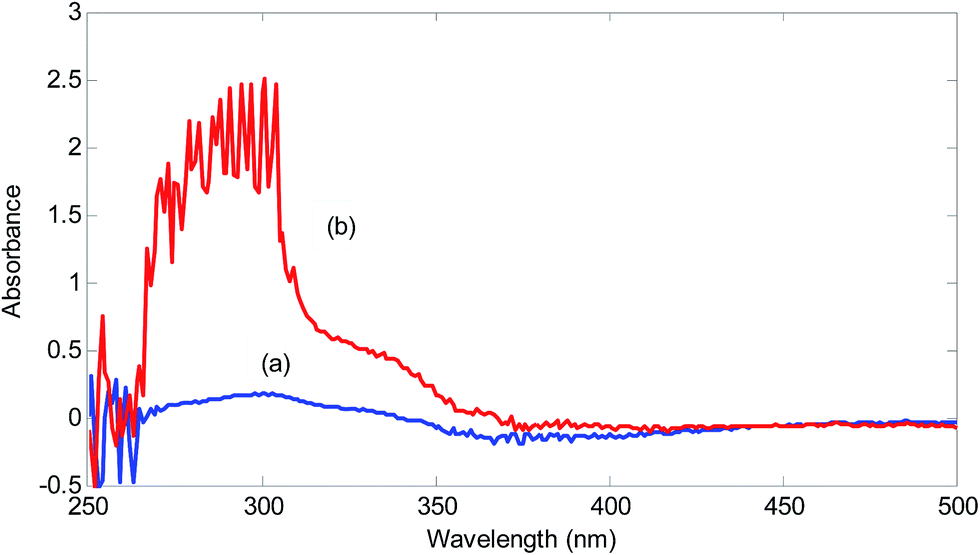 | ||
| Fig. 2 Spectra of the reagent blank (5.00 × 10⁻⁴ mol L−1 NQS and 1.00 × 10⁻² mol L−1 hydrochloric acid) in the presence of 2.00 mg L−1 hydrogen sulfide in (a) deionized water and (b) urine sample. | ||
A significant increase in the absorbance in the range of 260–370 nm can be seen in the urine sample. This increase is huge for the wavelengths around 300 nm. This wavelength range covers wavelengths suitable for univariate calibration. Therefore, the presence of spectral interferences in the analysis of urine sample for hydrogen sulfide is verified. Using the standard addition line at 320 nm, an amount of 9.16 mg L−1 (without considering the dilution coefficient) for concentration of hydrogen sulfide in the analyzed urine sample is obtained. Clearly, this value is very large and biased and can be attributed to the presence of unknown interferent(s).
4.2. Analysis of the standard addition data by NAS-IM
Typical standard addition spectra recorded during addition of hydrogen peroxide to a milk sample and standard addition of hydrogen sulfide to urine sample in the presence of the reagents in optimal conditions has been shown in Fig. 3. | ||
| Fig. 3 (a) Emission spectra recorded by excitation at 300 nm during standard addition of hydrogen peroxide to Milk 3 sample (0.18 mL concentrated sulfuric acid, Fe2+ 6.0 × 10⁻⁴ mol L−1 and phenol 150.0 mg L−1) and (b) UV-Vis spectra recorded during standard addition of hydrogen sulfide to urine sample (containing 5.00 × 10⁻⁴ mol L−1 NQS and 1.00 × 10⁻² mol L−1 hydrochloric acid). Arrows show direction of changes in spectra during standard addition. | ||
Firstly, the standard addition spectra in milk and urine samples were analyzed for the number of components by PCA.53–57 The calculated logarithms of the eigen values have been collected in Table 1. It is clear from the magnitude of the log(EV) that in all standard addition data, two components are responsible for the variations. After standard addition of the analyte to the real sample containing analyte plus the interferent(s), the resulted matrix contains a component with varying intensity and a component with constant intensity (interferent(s)). Therefore, the rank of the standard addition matrix is always 2.1
| Number | log(EV) | |||
|---|---|---|---|---|
| Milk 1 | Milk 2 | Milk 3 | Urine | |
| 1 | 6.38 | 7.94 | 7.91 | 2.13 |
| 2 | 3.44 | 4.62 | 3.98 | 0.21 |
| 3 | 1.08 | 2.56 | 2.48 | −0.08 |
| 4 | 0.85 | 1.75 | 1.60 | −1.00 |
| 5 | 0.69 | 1.36 | 1.49 | −1.67 |
The second step is the analysis of standard addition data by NAS-IM with two components. Fig. 4 shows the typical results obtained by NAS-IM for urine sample and a milk sample. As can be seen in Fig. 4a, the obtained spectrum for the analyte (product of the reaction of hydrogen peroxide with the reagents) has negative signals. This is due to the decrease in emission intensity of the reagents in the presence of hydrogen peroxide. Inspection of the calculated spectra for milk sample (see Fig. 4a) shows that the wavelengths correspond to the maximum signal is 336 and 325 nm for the unknown interferent(s) and analyte, respectively. Interestingly, in the calculated spectra for the unknown interferent(s), a shoulder at about 412 nm can be seen. It is more evident for Milk 1. For a more inspection, the emission spectrum of the reagents (excitation at 300 nm) and the calculated one for the unknown interferent(s) can be compared (see Fig. 1). For other two milk samples (Milk 2 and Milk 3), calculated spectra by NAS-IM show that analyte have maximum at 331 nm and 336 and interferent(s) have maximum at 323 and 326 nm, for Milk 2 and Milk 3, respectively.
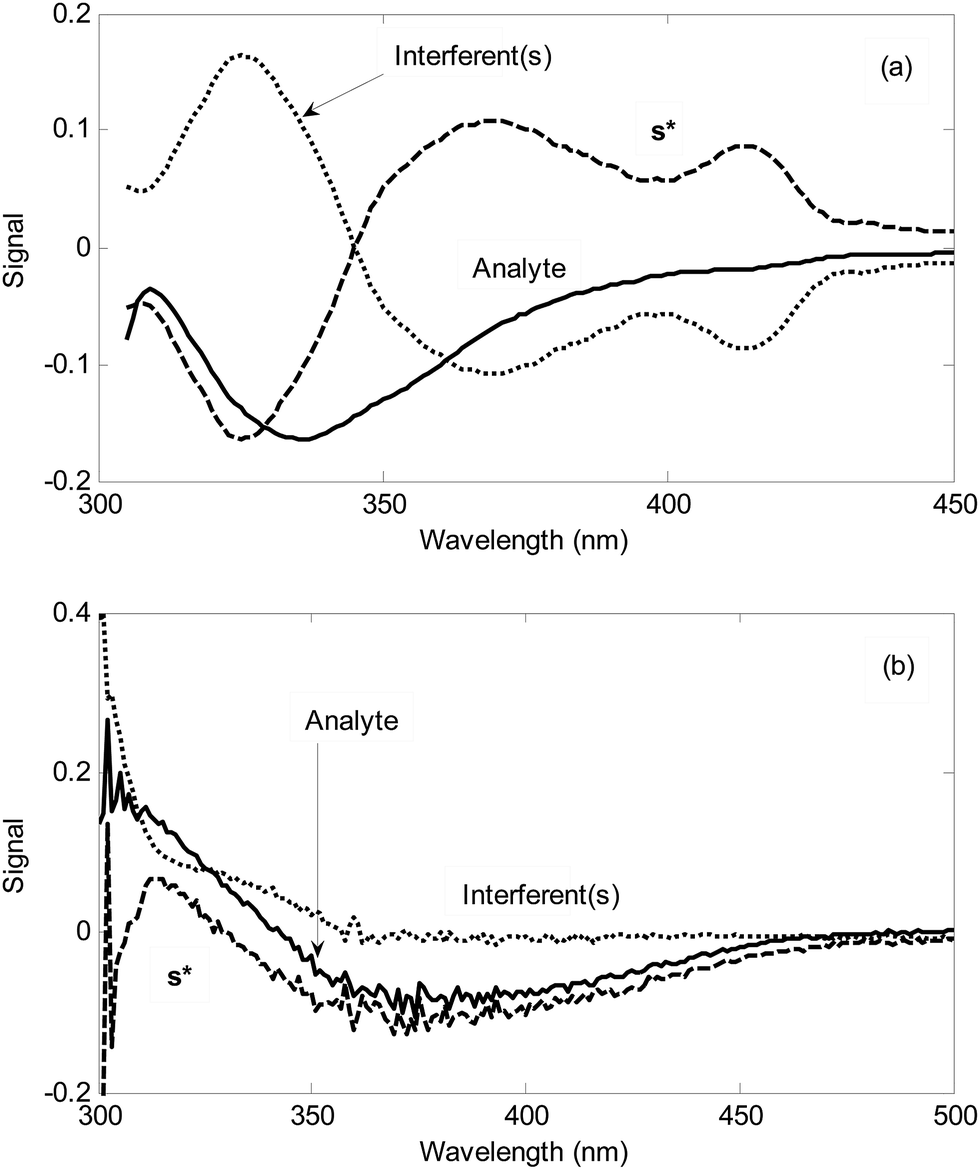 | ||
| Fig. 4 The calculated spectrum of the product of the reaction of the analyte (hydrogen peroxide or hydrogen sulfide) with the reagents, the NAS for the unit variation in the concentration of the analyte (s*) and calculated spectrum of the unknown interferent(s) in the (a) Milk 1 and (b) urine samples. | ||
In the case where the analyte is hydrogen sulfide, signal at 240–470 nm is negative (see Fig. 4b). This can be attributed to the lower absorbances of the product of the reaction between hydrogen sulfide and the reagent (NQS) in optimal conditions relative to the reagent mixture (NQS in hydrochloric acid) in this wavelength region. Based on the Fig. 4b, in urine sample, a high overlap between the spectrum of the analyte (product of the reaction between hydrogen sulfide and NQS) and that of the unknown interferent(s) can be seen especially in 300–350 nm. In wavelength region higher than 360 nm, the signal of the unknown interferent(s) collapses. However, in this region, the signal for the analyte is very low.
It is clear that without separation, it is not possible to obtain the concentration of hydrogen sulfide and hydrogen peroxide in urine and milk samples, respectively. Alternatively, the second-order data should be acquired and analyzed by the second-order algorithms. As can be seen in the remainder, using NAS-IM, the concentration of the analyte can be obtained accurately.
4.3. H-point standard addition method (HPSAM)
Theoretical background of the HPSAM can be found in the literature.58,59 The method requires that the spectrum of the interferent be known. Two wavelengths (λ1 and λ2) are selected to obtain standard addition lines such that the interferent shows the same signals but the analyte has different signals at them. H-point is the intersection point of the two lines with coordinates (–CH, AH), where CH is the concentration of the analyte and AH is the analytical signal of the interferent.The spectrum of the unknown interferent(s) in the analyzed samples is the main output of the analysis of the standard addition data by NAS-IM. Using estimated spectrum of the product of the reaction of analyte with the reagent and the estimated spectrum of unknown interferent(s), H-point standard addition method can be applied to determine hydrogen peroxide and hydrogen sulfide in milk and urine samples, respectively. Typical HPSAM plots have been shown in Fig. 5.
 | ||
| Fig. 5 H-point standard addition plots obtained for (a) determination of hydrogen peroxide in Milk 1 sample and (b) determination of hydrogen sulfide in urine sample. | ||
Based on the H-point standard addition plots, concentration of hydrogen peroxide and hydrogen sulfide were calculated and reported in Table 2. For showing the presence of unknown interferent(s), univariate standard addition line was also used to predict the analyte concentrations (see last entries of Table 2). As can be seen, the predicted values with this method are all higher than the values obtained by NAS-IM-HPSAM and MCR-ALS (Table 3). The effect of unknown interferent(s) is more pronounced for urine and Milk 2 samples.
| Urine | Milk 1 | Milk 2 | Milk 3 | ||||||||
|---|---|---|---|---|---|---|---|---|---|---|---|
| Wavelength pair | Calculated concentration (mg L−1) | Wavelength pair | Calculated concentration (mol L−1) | Wavelength pair | Calculated concentration (mol L−1) | Wavelength pair | Calculated concentration (mol L−1) | ||||
| NAS-IM-HPSAM | |||||||||||
| 369 | 423 | 2.14 | 321 | 330 | 5.415 × 10⁻⁵ | 307 | 337 | 1.03 × 10⁻⁴ | 314 | 338 | 2.160 × 10⁻⁴ |
| 369 | 420 | 2.20 | 322 | 329 | 5.415 × 10⁻⁵ | 318 | 332 | 1.05 × 10⁻⁴ | 334 | 318 | 2.161 × 10⁻⁴ |
| 371 | 430 | 2.19 | 358 | 412 | 5.413 × 10⁻⁵ | 319 | 331 | 1.05 × 10⁻⁴ | 333 | 319 | 2.153 × 10⁻⁴ |
| 378 | 443 | 2.40 | 358 | 413 | 5.410 × 10⁻⁵ | 356 | 389 | 1.05 × 10⁻⁴ | 330 | 323 | 2.160 × 10⁻⁴ |
| 379 | 428 | 2.19 | 358 | 414 | 5.409 × 10⁻⁵ | 361 | 379 | 1.04 × 10⁻⁴ | 353 | 398 | 2.165 × 10⁻⁴ |
| 379 | 422 | 2.40 | 361 | 378 | 5.405 × 10⁻⁵ | 363 | 375 | 1.04 × 10⁻⁴ | 360 | 380 | 2.161 × 10⁻⁴ |
| 380 | 421 | 2.51 | 364 | 373 | 5.408 × 10⁻⁵ | 365 | 372 | 1.03 × 10⁻⁴ | 363 | 371 | 2.161 × 10⁻⁴ |
| 380 | 427 | 2.25 | |||||||||
| 384 | 446 | 2.14 | |||||||||
| 384 | 445 | 2.47 | |||||||||
| 388 | 444 | 2.27 | |||||||||
| Mean | 2.29 | 5.410 × 10⁻⁵ | 1.04 × 10⁻⁴ | 2.160 × 10⁻⁴ | |||||||
| S.D. | 0.13 | 3 × 10⁻⁸ | 8 × 10⁻⁷ | 4 × 10⁻⁷ | |||||||
![[thin space (1/6-em)]](https://www.rsc.org/images/entities/char_2009.gif) |
|||||||||||
| Univariate standard addition | |||||||||||
| Predicted concentration | 8.26 | 6.12 × 10⁻⁵ | 1.87 × 10⁻⁴ | 2.73 × 10⁻⁴ | |||||||
| Percent difference | 261 | 13.1 | 79.6 | 26.4 | |||||||
| Added standards (hydrogen peroxide) mol L−1 | Matrix | Dimensions | Analyzed augmented matrix | |
|---|---|---|---|---|
| Milk 1 | 0.0 | M10 | 15 × 206 | |
| 5.0 × 10⁻⁶ | M11 | |||
| 1.0 × 10⁻⁵ | M12 | |||
| 1.5 × 10⁻⁵ | M13 | |||
| 2.0 × 10⁻⁵ | M14 | [M10; M11; M12; M13; M14] | ||
| Milk 2 | 0.0 | M20 | 15 × 206 | |
| 5.0 × 10⁻⁶ | M21 | |||
| 1.0 × 10⁻⁵ | M22 | |||
| 1.5 × 10⁻⁵ | M23 | |||
| 2.0 × 10⁻⁵ | M24 | [M20; M21; M22; M23; M24] | ||
| Milk 3 | 0.0 | M30 | 15 × 206 | |
| 1.0 × 10⁻⁵ | M31 | |||
| 2.0 × 10⁻⁵ | M32 | |||
| 3.0 × 10⁻⁵ | M33 | |||
| 4.0 × 10⁻⁵ | M34 | [M30; M31; M32; M33; M34] | ||
| Urine | 0.0 | U0 | 21 × 201 | |
| 2.0 | U1 | |||
| 4.0 | U2 | |||
| 6.0 | U3 | |||
| 8.0 | U4 | [U0; U1; U2; U3; U4] |
4.4. Analyze of the second-order data by MCR-ALS and PARAFAC
Simultaneous analyze of data matrices of standard additions to real sample provides not only the second-order advantage but also can handle matrix effect.For determination of hydrogen peroxide and hydrogen sulfide in milk and urine samples by MCR-ALS, the acquired EEM and kinetic data based on the standard additions in Section 3.3 were arranged in some matrices. The matrices and their dimensions have been collected in Table 3. For analysis of data with PARAFAC, the matrices in Table 3 were arranged in three-way arrays with dimensions n × rp.
In each sample, the matrix obtained by augmentation of matrices in Table 3 was resolved separately by MCR-ALS to find the relative responses for the standard additions to milk and urine samples. It must be mentioned that since the blank for recording UV-Vis kinetic data is a reagent blank, and after starting reaction between analyte and the reagent absorbance changes, negative values in this case were observed. Therefore, non-negativity constraint was not applied to the spectral profiles in kinetic UV-Vis data.
In milk and urine samples based on the results of MCR-ALS, the relative response for the analyte in the sample and its standard additions were plotted versus the added concentration of the analyte. The intercept of the calibration line with the abscissa gave the concentration of analyte in the sample. The response of the analyte obtained for each matrix was the area under each resolved emission spectrum in milk samples and the area under resolved kinetic concentration profiles in urine sample. With PARAFAC, the relative intensity (weight) of the scores is contained in B matrix which can be plotted against the added concentrations of the analyte as MCR-ALS and used for calculation of the analyte concentration.
In Fig. 6, typical EEM fluorescence data for milk and kinetic data for urine samples have been shown. For validating the results of NAS-IM-HPSAM, second-order data of the same samples analyzed by NAS-IM-HPSAM were acquired (Section 2.2) and analyzed by MCR-ALS under nonnegativity and trilinearity for the milk samples and unimodality and trilinearity for the urine sample. It must be mentioned that no constraint was applied in analysis of data by PARAFAC.
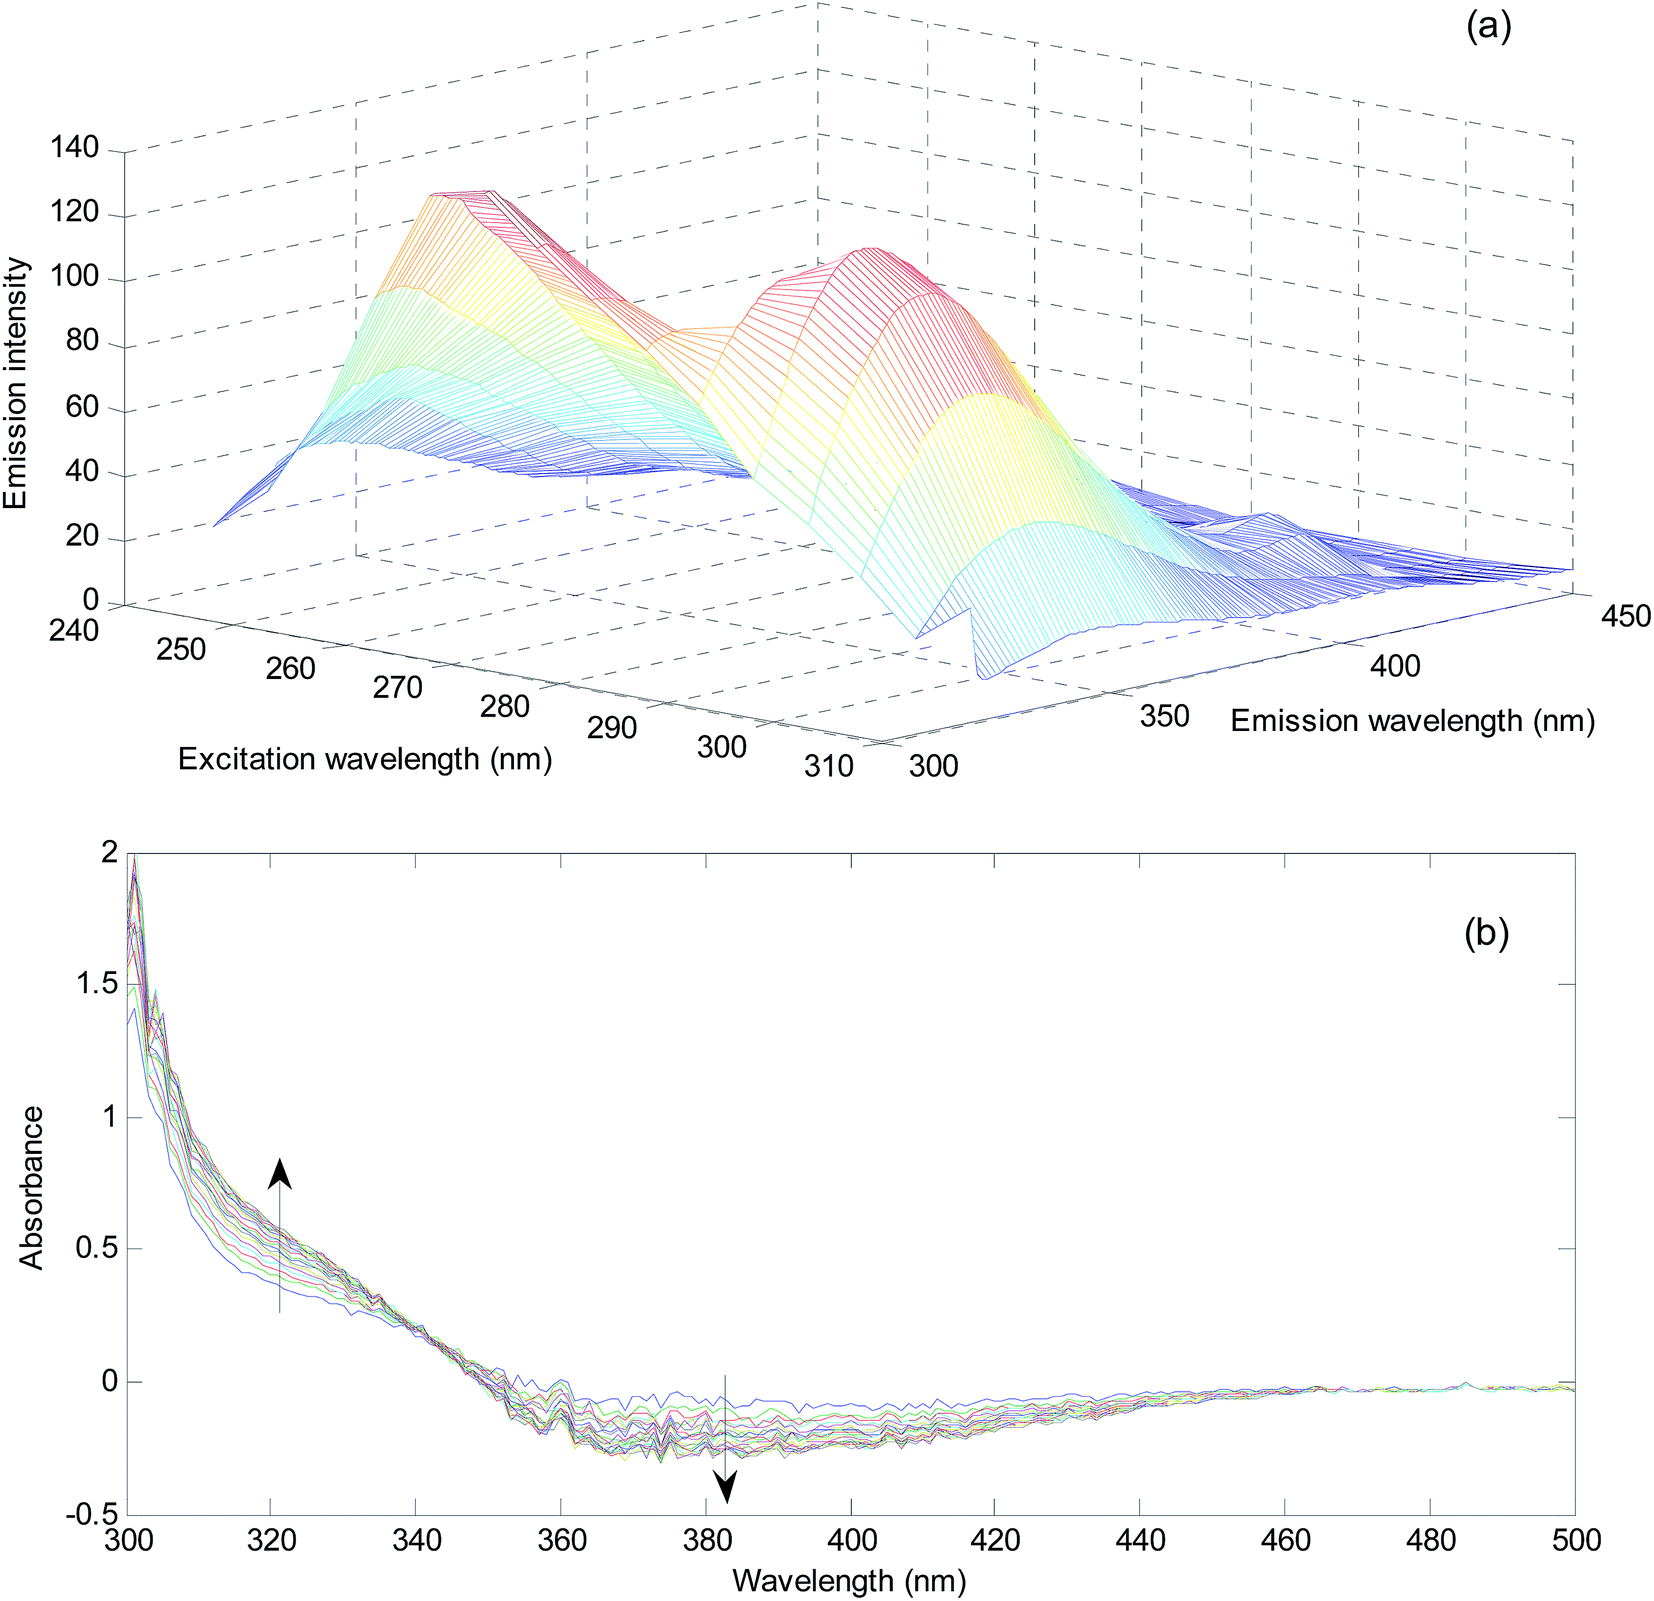 | ||
| Fig. 6 (a) EEM spectra recorded for Milk 1 sample after addition of standard in the presence of the reagents (0.18 mL concentrated sulfuric acid, Fe2+ 6.0 × 10⁻⁴ mol L−1 and phenol 150.0 mg L−1) and (b) kinetic UV-Vis spectra recorded for urine sample during reaction of hydrogen sulfide in the presence of reagents (5.00 × 10⁻⁴ mol L−1 NQS and 1.00 × 10⁻² mol L−1 hydrochloric acid). | ||
Fig. 7 depicts typical standard addition plots for quantification of hydrogen sulfide and hydrogen peroxide in milk and urine samples, respectively. The area under the resolved emission spectra for the product of the reaction of hydrogen peroxide with reagents and kinetic concentration profiles for the product of the reaction of hydrogen sulfide in standard addition samples relative to the area in the sample were calculated and plotted versus the added concentrations. Concentration of the analytes in the samples was calculated by dividing the intercept of the lines to its slope. Results of determination of the analytes in urine and milk samples using second-order data of standard additions to corresponding samples by MCR-ALS have also been given in Table 4. The correlation coefficient for the resulting standard addition plots were 0.9537, 0.9794, 0.9781, and 0.9527 for three milk samples and urine sample, respectively. Parameters showing the fitness of the MCR-ALS results are good (lof% lower than 3 and R2% in most cases higher than 99%). With two factors, PARAFAC resulted in the highest core consistency in analysis of the data. As can be seen from the results in Table 4, for milk samples with EEM data, PARAFAC results in the concentrations which are closer to the results obtained by NAS-IM. However, for urine samples with UV-Vis kinetic data, the results of MCR-ALS are closer to those obtained by NAS-IM. This can be due to the inherent trilinear character of the EEM data which is well suited for analysis by PARAFAC.
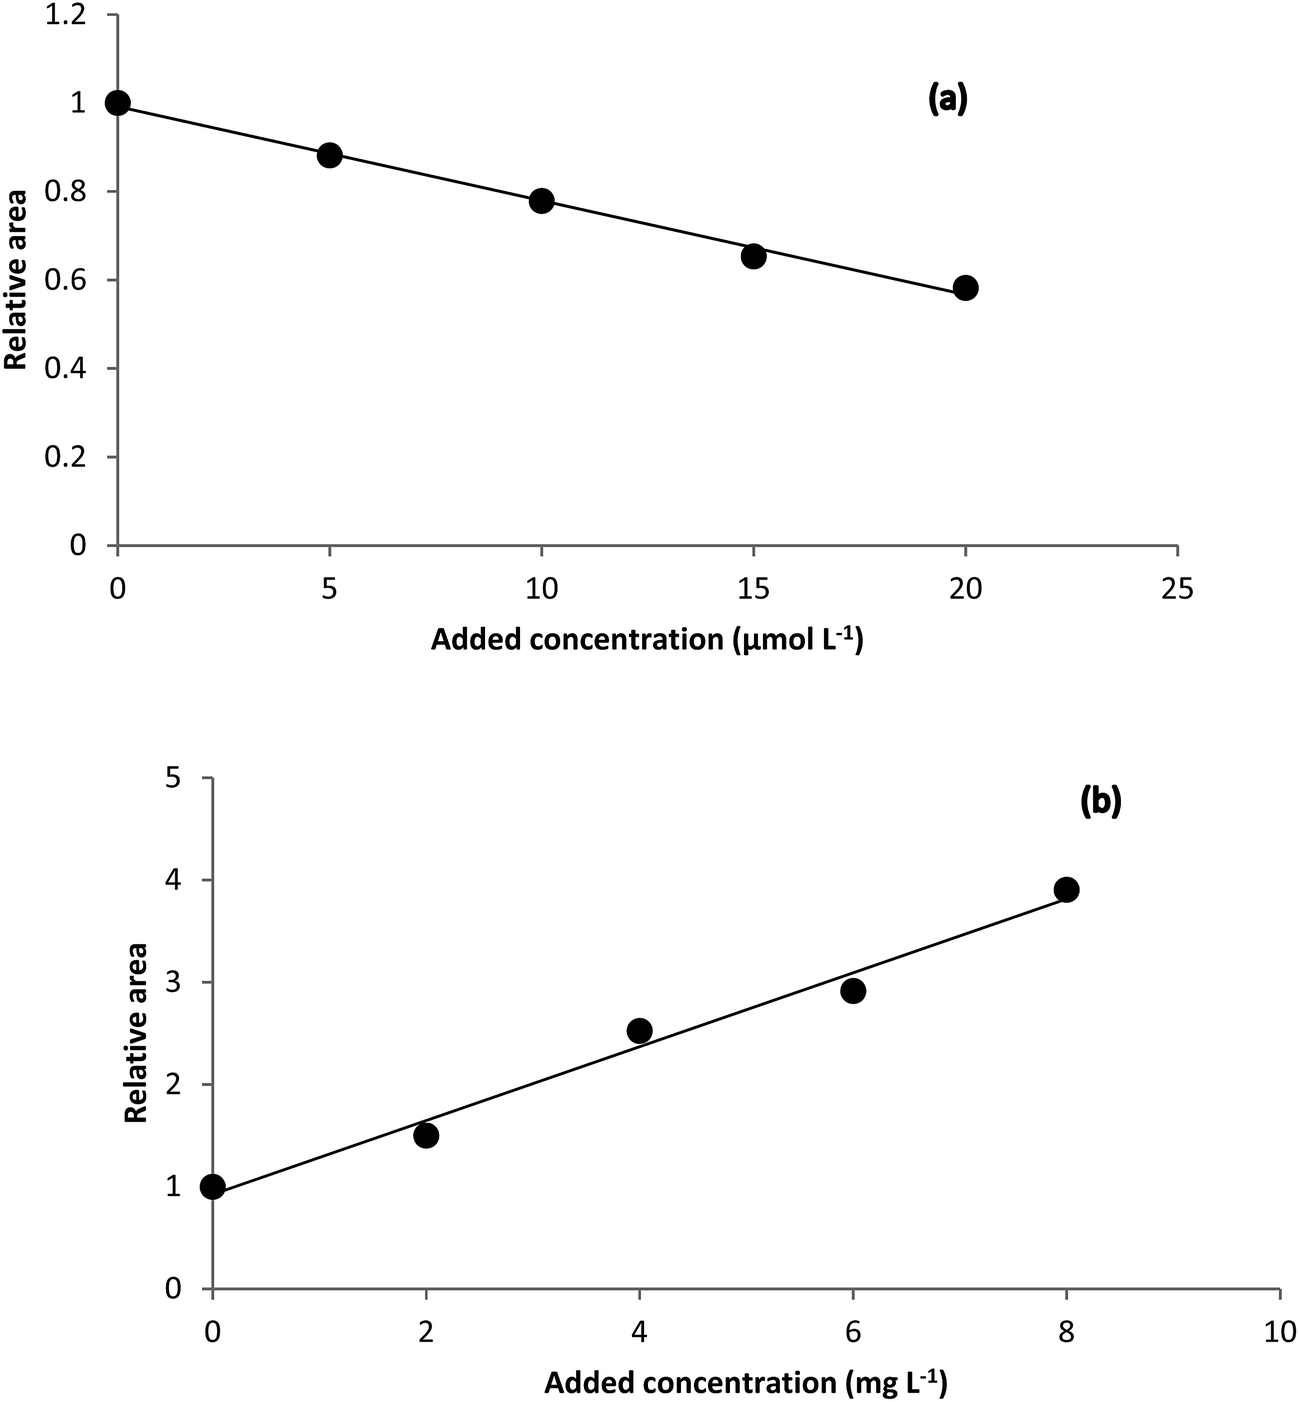 | ||
| Fig. 7 Standard addition plot obtained by plotting relative area of the emission profiles in the standard addition samples in Milk 1 sample (a) and relative area of the kinetic concentration profiles in the standard addition samples in urine sample (b). | ||
| Urine | Milk 1 | Milk 2 | Milk 3 | |
|---|---|---|---|---|
| MCR-ALS | ||||
| lof% (ref. 60 and 61) | 2.36 mg L−1 | 5.22 × 10⁻⁵ mol L−1 | 9.77 × 10⁻⁵ mol L−1 | 2.34 × 10⁻⁴ mol L−1 |
| 2.49 | 2.42 | 2.06 | 2.25 | |
|
||||
| PARAFAC | ||||
| Core consistency | 2.65 mg L−1 | 5.34 × 10⁻⁵ mol L−1 | 1.12 × 10⁻⁴ mol L−1 | 2.12 × 10⁻⁴ mol L−1 |
| 99.99 | 100.00 | 86.97 | 99.03 | |
The resolved profiles by MCR-ALS for the EEM data collected for a milk sample kinetic data of urine sample have been shown in Fig. 8. Clearly, two excitation and two emission spectra were resolved in the analysis of milk sample by MCR-ALS (see Fig. 8a and b). As can be seen from the resolved spectra in Fig. 8, the contribution of the unknown interferent(s) in the excitation and emission spectra is very high. Therefore, in the analyzed milk samples, the effect of unknown interferent(s) is very large. Without using the second-order EEM data and analyzing them by MCR-ALS it is impossible to determine the analytes in the complex samples.
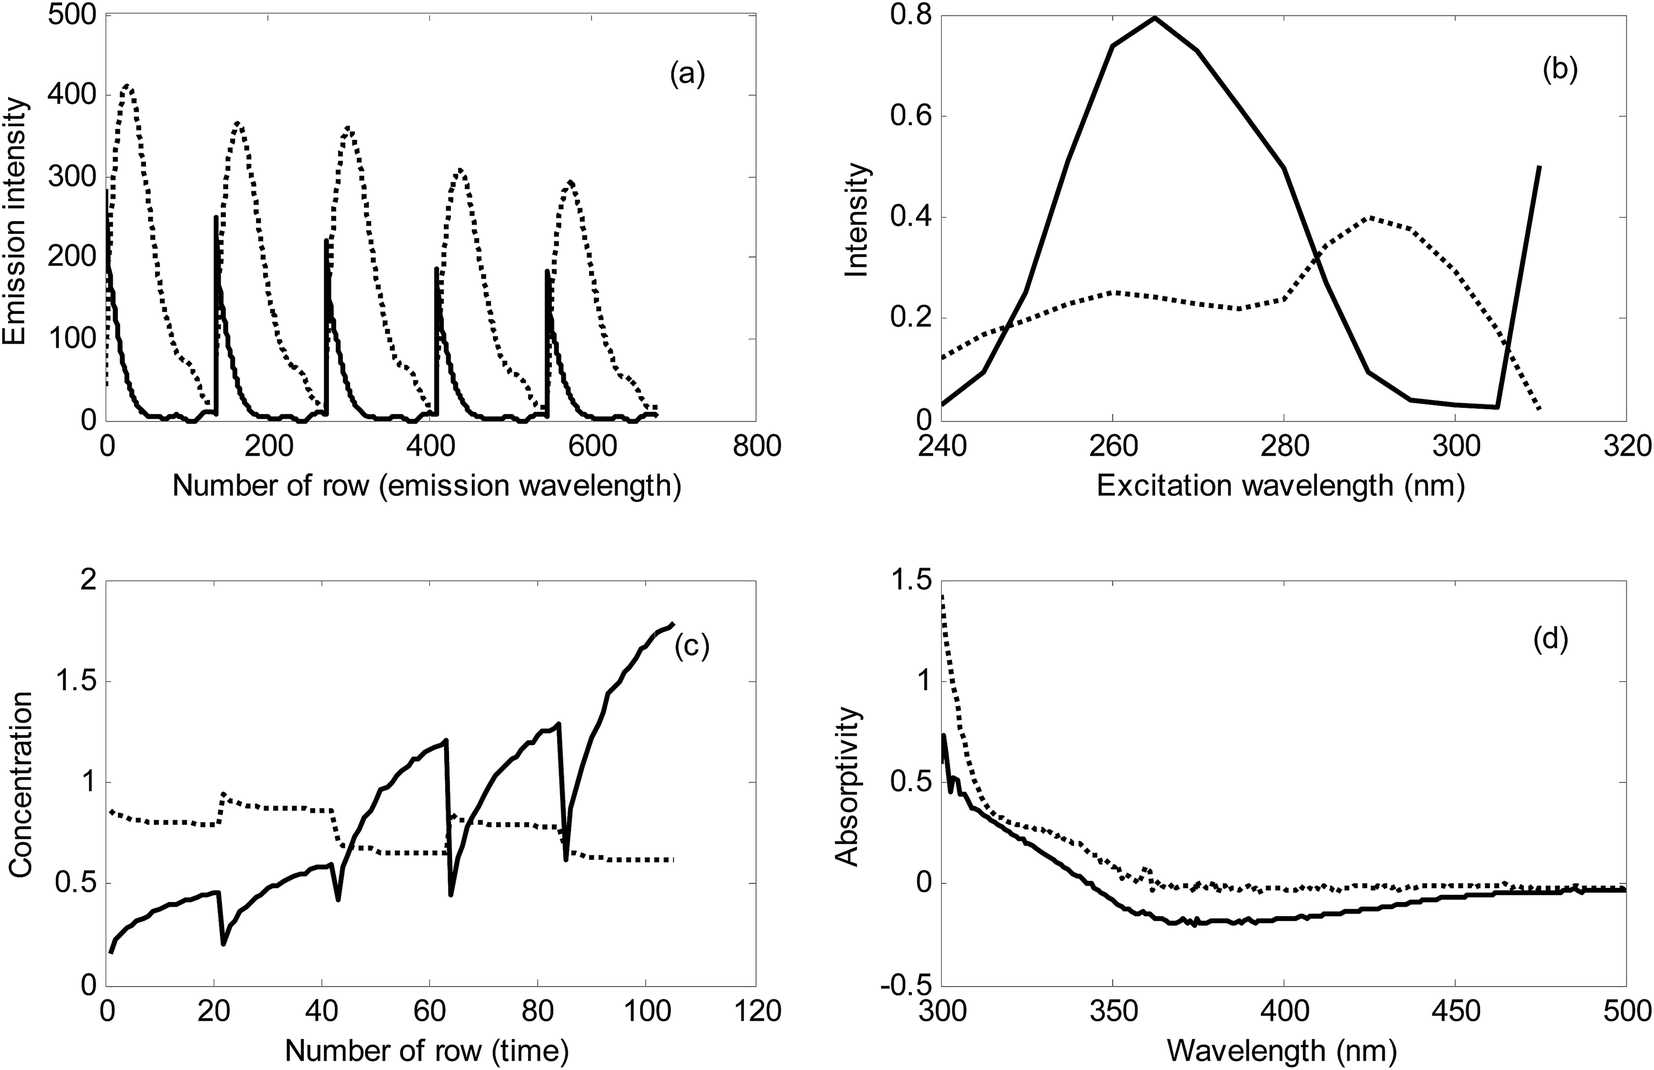 | ||
| Fig. 8 Resolved emission (a) and excitation spectra (b) for Milk 1 sample and resolved kinetic concentration (c) and spectral profiles (d) for urine sample. Analyte related profiles (solid curves) and interferent(s) related profiles (dotted curves). | ||
For urine sample, because of the relatively low changes in concentration of the unknown interferent(s), it can be concluded that most of the variation in the analyzed kinetic data is attributed to the analyte (see Fig. 8c). However, in this sample, the unknown interferent(s) have a considerable contribution in signal which can be inferred from Fig. 8c and d.
Proximity of the results of NAS-IM-HPSAM to the MCR-ALS results (see Tables 2 and 3) confirms the usefulness and success of NAS-IM-HPSAM in application to complex samples with unknown interferent(s). Moreover, success of NAS-IM-HPSAM in application to these samples has previously been approved.1
5. Conclusions
It was shown that NAS-IM can recover a valid spectrum for the unknown interferent(s). Based on this spectrum, it can be possible to determine analyte in complex samples containing both matrix effect and unknown spectral interferent(s). The complex samples can be analyzed by the proposed strategy irrespective of the number of the unknown interferents.References
- M. Shariati-Rad, M. Irandoust and S. Sheikhi, Anal. Methods, 2015, 7, 8901–8910 RSC.
- H. Martens and T. Naes, Multivariate Calibration, Wiley, Chichester, UK, 1989 Search PubMed.
- P. Geladi and B. R. Kowalski, Anal. Chim. Acta, 1986, 185, 1–17 CrossRef CAS.
- M. Shariati-Rad and M. Hasani, J. Chemom., 2010, 24, 45–56 CAS.
- S. Wold, M. Sjostrom and L. Eriksson, Chemom. Intell. Lab. Syst., 2001, 58, 109–130 CrossRef CAS.
- M. B. Gholivand, M. Shariati-Rad, N. Karimian and M. Torkashvand, Analyst, 2012, 137, 1190–1198 RSC.
- R. A. Harshman, UCLA Working Papers in Phonetics, 1970, 16, 1–84 Search PubMed.
- J. D. Carroll and J. J. Chang, Psychometrika, 1970, 35, 283–319 CrossRef.
- A. P. Silva, A. S. Luna, T. M. D. Silva Costa, R. Q. Aucelio, J. W. B. Braga, R. Boque and J. Ferre, Int. J. Life Sci. Pharma Res., 2012, 2, L147–L158 Search PubMed.
- P. Valderrama and R. Jesus Poppi, Chemom. Intell. Lab. Syst., 2011, 106, 160–165 CrossRef CAS.
- Y. Ni, Y. Gu and S. Kokot, Chemom. Intell. Lab. Syst., 2012, 112, 55–64 CrossRef CAS.
- L. Rubio, L. A. Sarabia and M. C. Ortiz, Talanta, 2015, 138, 86–99 CrossRef CAS PubMed.
- A. Lorber, K. Faber and B. R. Kowalski, Anal. Chem., 1997, 69, 1620–1626 CrossRef CAS.
- L. Xu and I. Schechter, Anal. Chem., 1997, 69, 3722–3730 CrossRef CAS.
- A. J. Berger, T.-W. Koo, I. Itzkan and M. S. Feld, Anal. Chem., 1998, 70, 623–627 CrossRef CAS PubMed.
- H. C. Goicoechea and A. C. Olivieri, Anal. Chem., 1999, 71, 4361–4368 CrossRef CAS PubMed.
- H. C. Goicoechea and A. C. Olivieri, Trends Anal. Chem., 2000, 19, 599–605 CrossRef CAS.
- A. Espinosa-Mansilla, M. I. A. Valenzuela, A. M. de la Peña, F. Salinas and F. C. Canada, Anal. Chim. Acta, 2001, 427, 129–136 CrossRef CAS.
- A. Espinosa-Mansilla, I. Duran-Meras and R. Galian, Appl. Spectrosc., 2001, 55, 701–707 CrossRef CAS.
- H. C. Goicoechea and A. C. Olivieri, Anal. Chim. Acta, 2002, 453, 289–300 CrossRef CAS.
- A. M. de la Peña, A. Espinosa-Mansilla, M. I. A. Valenzuela, H. C. Goicoechea and A. C. Olivieri, Anal. Chim. Acta, 2002, 463, 75–88 CrossRef.
- D. Rodriguez, C. E. Boschetti and A. C. Olivieri, Analyst, 2002, 127, 304–309 RSC.
- W. Xuan, C. Sheng, Y. Cao, W. He and W. Wang, Angew. Chem., Int. Ed., 2012, 51, 2282–2284 CrossRef CAS PubMed.
- C. Liu, B. Peng, S. Li, C.-M. Park, A. R. Whorton and M. Xian, Org. Lett., 2012, 14, 2184–2187 CrossRef CAS PubMed.
- Y. Qian, J. Karpus, O. Kabil, S. Y. Zhang, H. L. Zhu, R. Banerjee, J. Zhao and C. He, Nat. Commun., 2011, 2, 495–502 CrossRef PubMed.
- K. Sasakura, K. Hanaoka, N. Shibuya, Y. Mikami, Y. Kimura, T. Komatsu, T. Ueno, T. Terai, H. Kimura and T. Nagano, J. Am. Chem. Soc., 2011, 133, 18003–18005 CrossRef CAS PubMed.
- W. Xuan, C. Sheng, Y. Cao, W. He and W. Wang, Angew. Chem., Int. Ed., 2012, 51, 2282–2284 CrossRef CAS PubMed.
- D. Jimenez, R. Martinez-Manez, F. Sancenon, J. V. Ros-Lis, A. Benito and J. Soto, J. Am. Chem. Soc., 2003, 125, 9000–9001 CrossRef CAS PubMed.
- D. G. Searcy and M. A. Peterson, Anal. Biochem., 2004, 324, 269–275 CrossRef CAS PubMed.
- J. E. Doeller, T. S. Isbell, G. Benavides, J. Koenitzer, H. Patel, R. P. Patel, J. R. Lancaster, V. M. Darley-Usmar and D. W. Kraus, Anal. Biochem., 2005, 341, 40–51 CrossRef CAS PubMed.
- B. H. Yocis, D. J. Kieber and K. Mopper, Deep Sea Res., Part I, 2000, 47, 1077–1099 CrossRef CAS.
- K. Fujiwara, T. Ushiroda, K. Takeda, Y. Kumamoto and H. Tsubota, Geochem. J., 1993, 27, 103–115 CrossRef CAS.
- R. J. Kieber and G. R. Heltz, Anal. Chem., 1986, 58, 2312–2315 CrossRef CAS.
- A. L. Lazrus, G. L. Kok, S. N. Gitlin, J. A. Lind and S. E. McLaren, Anal. Chem., 1985, 57, 917–922 CrossRef CAS.
- W. L. Miller and D. R. Kester, Anal. Chem., 1988, 60, 2711–2715 CrossRef CAS.
- H. Afsar, R. Apak and I. Tor, Analyst, 1990, 115, 99–103 RSC.
- H. S. Bader, V. Sturzenegger and J. Hoigne, Water Res., 1988, 22, 1109–1115 CrossRef CAS.
- D. J. Johnson, C. M. Sakamoto-Arnold, S. W. Willason and L. Beehler, Anal. Chim. Acta, 1987, 201, 83–94 CrossRef.
- J. H. Lee and I. N. Tang, Anal. Chem., 1990, 62, 2381–2384 CrossRef CAS.
- W. J. Cooper, J. K. Moegling, R. J. Kieber and J. J. Kiddle, Mar. Chem., 2000, 70, 191–200 CrossRef CAS.
- D. Price, R. F. C. Mantoura and P. J. Worsfold, Anal. Chim. Acta, 1998, 377, 145–155 CrossRef CAS.
- J. Yuan and A. M. Shiller, Anal. Chem., 1999, 71, 1975–1980 CrossRef CAS.
- Y. Hu, Z. Zhang and C. Yang, Anal. Sci., 2008, 24, 201–206 CrossRef CAS PubMed.
- J. Ferre, S. D. Brown and F. X. Rius, J. Chemom., 2001, 15, 537–553 CrossRef CAS.
- A. de Juan and R. Tauler, Anal. Chim. Acta, 2003, 500, 195–210 CrossRef CAS.
- J. Jaumot, A. de Juan and R. Tauler, Chemom. Intell. Lab. Syst., 2015, 140, 1–12 CrossRef CAS.
- W. Windig and J. Guilment, Anal. Chem., 1991, 63, 1425–1432 CrossRef CAS.
- W. Windig and D. A. Stephenson, Anal. Chem., 1992, 64, 2735–2742 CrossRef CAS.
- R. Bro, Chemom. Intell. Lab. Syst., 1997, 38, 149–171 CrossRef CAS.
- N. Holland, Comput. Stat. Data Anal., 1994, 18, 39–72 CrossRef.
- R. Bro and H. A. L. Kiers, J. Chemom., 2003, 17, 274–286 CrossRef CAS.
- M. Shariati-Rad, M. Irandoust and F. Jalilvand, Int. J. Environ. Sci. Technol., 2016, 13, 1347–1356 CrossRef CAS.
- R. Tauler, A. Smilde and B. R. Kowalski, J. Chemom., 1995, 9, 31–58 CrossRef CAS.
- R. Tauler, J. Chemom., 2002, 16, 117–118 CrossRef CAS.
- B. M. G. Vandeginste, D. L. Massart, L. M. C. Buydens, S. De Jong, P. J. Lewi and J. Smeyers-Verbeke, Handbook of Chemometrics and Qualimetrics, Part B, Elsevier Science B V, Amsterdam, 1998 Search PubMed.
- S. Wold, K. Esbensen and P. Geladi, Chemom. Intell. Lab. Syst., 1987, 2, 37–52 CrossRef CAS.
- W. P. Carey, K. R. Beebe, E. Sanchez, P. Geladi and B. R. Kowalski, Sens. Actuators, 1986, 9, 223–234 CrossRef CAS.
- M. J. Cardone, F. Bosch Reig and P. Campins Falco, Analyst, 1990, 115, 111–113 RSC.
- E. Hund, D. L. Massart and J. Smeyers-Verbeke, J. Pharm. Biomed. Anal., 1999, 21, 23–42 CrossRef CAS PubMed.
- M. Shariati-Rad and M. Hasani, Biochimie, 2009, 91, 850–856 CrossRef CAS PubMed.
- R. Tauler and D. Barcelo, Anal. Chem., 1993, 12, 319–327 CAS.
| This journal is © The Royal Society of Chemistry 2017 |