 Open Access Article
Dielectric relaxation of nonaqueous ionic liquid microemulsions: polarization, microstructure, and phase transition†
Cancan Zhang,
Zhen Zhen,
Liyan Ma and
Kongshuang Zhao *
*
College of Chemistry, Beijing Normal University, Beijing 100875, China. E-mail: zhaoks@bnu.edu.cn; Tel: +86-010-58805856
First published on 28th February 2017
Abstract
Two nonaqueous ionic liquid (IL) microemulsions (toluene/TX-100/[bmim][PF6] and [bmim][BF4]/TX-100/benzene) were studied by dielectric spectroscopy covering a wide frequency range (40 Hz to 110 MHz). A unique relaxation was observed in the radio frequency (RF) range. By methodically analyzing the dependence of relaxation parameters on the ILs content, the microstructures of the microemulsions were identified. Additionally, based on the interfacial polarization theory and Einstein equation, the mechanism of the relaxation caused by the fluctuation of IL anions along the TX-100 PEO chain was confirmed, what's more, according to the dependence of the dc conductivity of the microemulsions on IL concentration, it was concluded that the hydrophilicity of the IL in the nonaqueous IL microemulsions may play a crucial role in the electrical conduction mechanism: our analysis results suggest that a dynamic percolation process occurs in the toluene/TX-100/[bmim][PF6] system in which IL is hydrophobic, while a static percolation happens in benzene/TX-100/[bmim][BF4] where IL is hydrophilic. The otherness of relaxation time provides evidence that there is a possible coupling effect between IL and TX-100. Moreover, there are hints that all of the disparities, such as relaxation time, percolation type, ion migration rate and the size of different micro zones, may just stem from the different hydrophobicity of the two kinds of IL.
1. Introduction
Due to their unique physicochemical properties, such as environmental friendliness, low volatility, wide electrochemical window, low flammability, high thermal stability, and wide liquid range, ILs have been receiving more and more attention in recent years.1–6Recently, many researchers have been attempting to use ILs to prepare microemulsions, since in 2004 Han et al. first found an uncommon microemulsion system where [bmim][BF4] in the fashion of nanoscale droplets was dispersed in a continuous hydrocarbon solvent,7,8 which soon afterwards was investigated by Eastoe et al. and Sarkar et al.9,10 respectively. Therefrom, the study of nonaqueous microemulsions with ILs instead of water has become an active research area.11–17 A large number of studies have shown that the nonaqueous microemulsion systems have generous obvious advantages, for example, compared with a similar aqueous solution, the nonaqueous systems often show a large stable region in isotropic solution.17,18 In addition, due to their characteristics, ILs can provide micro environments for some special reactions. Although the solubility of polar solutes in ILs is still limited, it can be surmounted through the introduction of micelles or IL/O microemulsions which can provide a hydrocarbon chain region. In this context, it is pretty significant to study the ternary microemulsions which ILs participate in constructing.
The copious efforts of many researchers on a wide variety of nonaqueous microemulsions with diverse oil phase have brought to light their potential applicabilities in massive practical applications (such as chemical reaction, separation, nanoparticles and porous materials preparation etc.),19–23 which greatly widens the application range of the traditional microemulsions. Nevertheless, from what we know, there is still no more comparative reports about microemulsions with different ILs phase, which may make a thorough inquiry of the micro structure, especially the polarity and formation mechanism of the micro structure and provide more basic information for the application of nonaqueous IL-based microemulsions.
Dielectric spectroscopy (DS), as a powerful tool to explore the polarization and dynamics inside materials, have been early used to study the dynamic and structural properties of colloidal systems, such as emulsion and particle dispersion.24–26 On the other hand, percolation can not only bring considerable current interest in practical application, but provide us a very good way to judge the microstructure transition in a microemulsion.27,28 Most of these studies have focused on promulgating the dynamics, the percolation process and the interaction between the droplets. For example, Buchner et al.29 conducted the dielectric measurement on water/octane/C12E5 from which they determined the dynamic percolation process induced by the temperature and obtained the percolation temperature. Asami30 studied the temperature dependence of the dielectric properties of water/toluene/TX-100 microemulsion, and gained favorable construction on the percolation and dielectric spectrum data with the interfacial polarization theory. Cametti31 measured the temperature dependent dielectric spectrum for AOT/decane/water microemulsion, and obtained the percolation temperature from the static permittivity and the DC conductivity data. They attributed the low-frequency dielectric relaxation to the polarization of bulk ions in the drop and ascribed the high frequency relaxation to the polarization of surfactant head group at the water–surfactant interface. Z. Chen and R. Nozaki32 found a new relaxation in 107 to 108 Hz through comparing water/TX-100/[bmim][PF6] and TX-100/water mixtures with various φw, and put it down to the hopping of IL cationic/anionic species between the anionic/cationic sites. And their studies above are about aqueous microemulsion. To the best of our knowledge, the dielectric study about the percolation of nonaqueous microemulsion and their comparisons is very little. Among them, Gao et al. used the relationship between conductivity and percolation to estimate the effect of water on the IL microemulsion.33 We recently reported the dielectric behavior of nonaqueous IL microemulsions and explained the percolation phenomena of systems combining percolation theory.34,35 And these works firstly systematically discussed the solubility and polarity of ILs, the interaction between IL and TX-100, and percolation phenomena in the B.C. phase. Meanwhile, some characteristics of soft materials in such microemulsion systems have been explained. In that way, whether other IL-based microemulsion systems also have a similar dynamic behavior and formation mechanism, especially, how about their percolation behavior? Because percolation problem is a significant criterion of the structure and phase transition, as well as an important issue in the dielectric study of microemulsions. In this study, we select the toluene/TX-100/[bmim][PF6] (Han 2005) and benzene/TX-100/[bmim][BF4] (Zheng 2007) two representative systems. Through measuring their dielectric behavior in radio frequency, their phase transition processes and percolation phenomena were discussed, and the relaxation time of the ionic fluctuation and migration, the electric conduction model and the difference of ion transport rate caused by the distinct hydrophobicity of ILs were proffered.
2. Experimental and methods
2.1 Materials and preparations of IL microemulsions
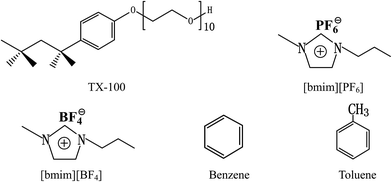
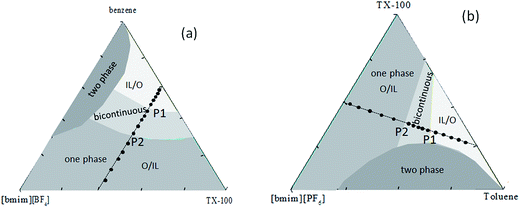
The IL [bmim][PF6] and [bmim][BF4] (purity > 99%) were both purchased from Shanghai Cheng Jie Chemical Co. Ltd., China. The content of residual chloride and water in these two ILs were both less than 800 ppm, and less than 1000 ppm respectively. TX-100 (p-(1,1,3,3-tetramethylbutyl)phenoxypolyoxyethyleneglycol) (reagent grade) was obtained from Amresco Chemical Inc. America. Benzene and toluene were produced by Beijing Chemical Reagent Factory, China, and were analytical reagent grade. The structural formula of TX-100 and IL [bmim][PF6], [bmim][BF4] are all shown in Fig. 1. Before used, they were dried under vacuum for 12 hours at 80 °C to remove water.The sample compositions of dielectric measurements are shown in the isothermal triangular phase diagram,36,37 as Fig. 2, ● presents the measured phase points which make up the path of experiment: Fig. 2a denotes the ternary system in which the weight concentration of IL is increased to the weight ratio of IL/TX-100 3![[thin space (1/6-em)]](https://www.rsc.org/images/entities/char_2009.gif) :
:![[thin space (1/6-em)]](https://www.rsc.org/images/entities/char_2009.gif) 2, when the weight ratio of benzene/TX-100 is fixed as 3
2, when the weight ratio of benzene/TX-100 is fixed as 3![[thin space (1/6-em)]](https://www.rsc.org/images/entities/char_2009.gif) :
:![[thin space (1/6-em)]](https://www.rsc.org/images/entities/char_2009.gif) 2; Fig. 2b shows the ternary system in which the weight concentration of IL is increased to the weight ratio of IL/TX-100 1
2; Fig. 2b shows the ternary system in which the weight concentration of IL is increased to the weight ratio of IL/TX-100 1![[thin space (1/6-em)]](https://www.rsc.org/images/entities/char_2009.gif) :
:![[thin space (1/6-em)]](https://www.rsc.org/images/entities/char_2009.gif) 1, when the weight ratio of toluene/TX-100 is fixed as 3
1, when the weight ratio of toluene/TX-100 is fixed as 3![[thin space (1/6-em)]](https://www.rsc.org/images/entities/char_2009.gif) :
:![[thin space (1/6-em)]](https://www.rsc.org/images/entities/char_2009.gif) 1. These two paths both span the microstructure concentration range of the microemulsion monophase region, so it can be used to study the transformation of the system mesoscopic order. The points taking from Fig. 2 determines the quality ratio of the three components in the system and their specific quantity respectively needed was calculated by per sample 3 g, and weighed with the electronic analysis balance, then mixed. The prepared sample was put into a sealed glass bottle which was clean and dry. Light grey area in Fig. 2 represents IL packages oil area (O/IL) in which there are a mass of microemulsion spheres. Whereas the bright grey area delegates the oil coats ILs region (IL/O), there are a great deal of microemulsion spheres. There is a B.C. structure during the transition of the two kinds of mesoscopic structures.
1. These two paths both span the microstructure concentration range of the microemulsion monophase region, so it can be used to study the transformation of the system mesoscopic order. The points taking from Fig. 2 determines the quality ratio of the three components in the system and their specific quantity respectively needed was calculated by per sample 3 g, and weighed with the electronic analysis balance, then mixed. The prepared sample was put into a sealed glass bottle which was clean and dry. Light grey area in Fig. 2 represents IL packages oil area (O/IL) in which there are a mass of microemulsion spheres. Whereas the bright grey area delegates the oil coats ILs region (IL/O), there are a great deal of microemulsion spheres. There is a B.C. structure during the transition of the two kinds of mesoscopic structures.
2.2 Dielectric measurements
The low-frequency dielectric measurement of the two microemulsion systems were performed on a 4294A precision impedance analyzer (Agilent Technologies, made in Japan) that allows a continuous frequency measurement from 40 Hz to 110 MHz. A dielectric measurement cell with concentrically cylindrical platinum electrodes38 was employed and connected to the impedance analyzer by a 16047E spring clip fixture (Agilent Technologies, made in Japan). The original data capacitance C and conductance G, which was corrected by the measured parameters such as cell constant Cl, the stray capacitance Cr and the residual inductance Lr (obtained by using ethanol, water, and KCl solution) according to Schwan's method. The permittivity ε and the conductivity κ were calculated according to ε = (C − Cr)/Cl and κ = Gε0/Cl, (ε0 (=8.854 × 10⁻¹² F m−1) is permittivity of vacuum) (the detailed description is provided in the part A of the ESI†).2.3 Determination of relaxation parameters
Dielectric relaxation can be characterized by a series of dielectric parameters, which can be obtained by fitting the experimental data with the Havriliak–Negami equation.39
 | (1) |
3. Results and discussion
3.1 The concentration dependence of dielectric spectrum
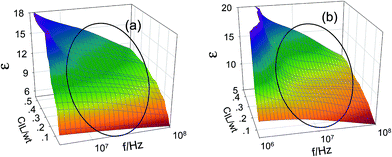
From Fig. 3, there is a remarkable dielectric relaxation around 107 to 108 Hz. It's easy to observe that both the dielectric relaxation intensity Δε and relaxation frequency f0 change with the increase of IL concentration. We have attempted to use the Havriliak–Negami equation, namely, formula (1), to fit the dielectric spectroscopy, from which we can obtained the dielectric relaxation parameters. The best fitting results for the relaxation parameters of the two systems are listed in Table 1.| C[bmim][BF4] (wt) | τ[bmim][BF4] (ns) | κ[bmim][BF4] (S m−1) | C[bmim][PF6] (wt) | τ[bmim][BF6] (ns) | κ[bmim][PF6] (S m−1) |
|---|---|---|---|---|---|
| 0.018 | 4.27 ± 0.07 | 0.0007 ± 0.0005 | 0.041 | 4.74 ± 0.10 | 0.0025 ± 0.0004 |
| 0.028 | 4.13 ± 0.05 | 0.0018 ± 0.0006 | 0.067 | 4.13 ± 0.12 | 0.0066 ± 0.0004 |
| 0.047 | 3.59 ± 0.06 | 0.0063 ± 0.0004 | 0.098 | 3.59 ± 0.09 | 0.0173 ± 0.0006 |
| 0.069 | 3.13 ± 0.07 | 0.0121 ± 0.0008 | 0.128 | 2.06 ± 0.05 | 0.0380 ± 0.0008 |
| 0.095 | 2.56 ± 0.08 | 0.0288 ± 0.0007 | 0.153 | 1.79 ± 0.08 | 0.0454 ± 0.0006 |
| 0.136 | 1.79 ± 0.09 | 0.0524 ± 0.0006 | 0.196 | 0.35 ± 0.11 | 0.0645 ± 0.0004 |
| 0.162 | 1.67 ± 0.10 | 0.0876 ± 0.0005 | 0.214 | 0.32 ± 0.14 | 0.0731 ± 0.0007 |
| 0.187 | 1.56 ± 0.08 | 0.1023 ± 0.0007 | 0.229 | 0.31 ± 0.10 | 0.0833 ± 0.0005 |
| 0.208 | 1.45 ± 0.11 | 0.1154 ± 0.0008 | 0.244 | 0.36 ± 0.08 | 0.0866 ± 0.0003 |
| 0.238 | 1.33 ± 0.09 | 0.1328 ± 0.0006 | 0.265 | 0.39 ± 0.05 | 0.0913 ± 0.0004 |
| 0.344 | 1.34 ± 0.06 | 0.1421 ± 0.0007 | 0.314 | 0.61 ± 0.07 | 0.0947 ± 0.0005 |
| 0.394 | 1.76 ± 0.05 | 0.1256 ± 0.0008 | 0.356 | 1.67 ± 0.06 | 0.0861 ± 0.0006 |
| 0.450 | 2.08 ± 0.07 | 0.1172 ± 0.0009 | 0.390 | 2.17 ± 0.05 | 0.0819 ± 0.0005 |
| 0.499 | 2.37 ± 0.05 | 0.0999 ± 0.0006 | 0.432 | 3.13 ± 0.08 | 0.0755 ± 0.0006 |
| 0.548 | 3.13 ± 0.08 | 0.0871 ± 0.0004 | 0.471 | 4.13 ± 0.11 | 0.0534 ± 0.0004 |
3.2 Relaxation mechanism
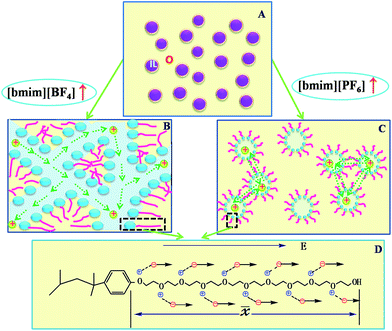
Due to containing a hydrophilic chain composed of approximately 10 EO units, TX-100 can be bonded by water molecules through hydrogen bonding. The combination between water and TX-100 plays a crucial role in deciding phase structure, which also, in a large extent, determines the physicochemical properties of the microemulsion TX-100/water/IL.17 The dielectric behavior of TX-100/water mixtures has been studied by Asami30 in detail. An obvious relaxation was observed in the vicinity of 1 GHz, which was accredited to the bulk water and bound water. After that, the dielectric measurements of ILs microemulsions which constructed by IL and TX-100 with water or oil were also respectively performed as mentioned above.32,35,40 In these measurements, researchers observed another relaxation of higher radio frequency 107 to 108 Hz. Nevertheless, just as what have been used to interprete the relaxation of the IL/TX-100/water system, many possible relaxation mechanisms may contribute to this relaxation. There is a system the IL/TX-100/cyclohexane in our previous study, quite similar to this present work. We have formerly ascribed the relaxation found in that work to the counterion polarization at the micelle interface. In our present results, the relaxation in 107 to 108 Hz frequency range has been likewise observed and its relaxation intensity increase with increasing the concentration of IL [bmim][PF6] or [bmim][BF4] (see Fig. 3a and b). Besides, it can be seen from Table 1 that the changes of the relaxation parameters with concentration of ILs were segmented (details will be discussed later), which means that at least one relaxation mechanism should be responsible for this relaxation. In general, this relaxation is due to the aggregation or recombination, the tangential or radial diffusion of the interfacial ions, and the fluctuations caused by the thermal motion of the aggregates. The kinetic relaxation time of micellar is generally in 0.6 μs, and thermal motion and interfacial polarization are respectively about 15 μs, 160 μs. These relaxation times are far greater than the observed values. Therefore, with a rough estimate, these three mechanisms didn't mainly contribute to the observed the relaxation.In order to explain our results, we proposed a model shown in Fig. 4. In the two systems, the OE units on the TX-100 chain have electrostatic interaction on the cations [bmim]+ of ILs, which limits the diffusion of cations. Further, due to the electrostatic attraction from the limited cations, the anions [BF4]−/[PF6]− are as well forced to distribute around the cations. Nevertheless, the movement of anions isn't fully fettered by the weak electrostatic attraction. Therefore, anions still have a diffusion coefficient D−. Before and after the application of electric field, in order to balance the distribution, the anions fluctuate within the PEO chain length and produce the relaxation. Assuming that the fluctuation length 〈![[x with combining macron]](https://www.rsc.org/images/entities/i_char_0078_0304.gif) 〉 is the length of the PEO chain (see Fig. 4D), the time that this relaxation process needed can be calculated according to the Einstein displacement equation:41
〉 is the length of the PEO chain (see Fig. 4D), the time that this relaxation process needed can be calculated according to the Einstein displacement equation:41
τ = 〈![[x with combining macron]](https://www.rsc.org/images/entities/i_char_0078_0304.gif) 〉2/2D− 〉2/2D−
| (2) |
For the system benzene/TX-100/[bmim][BF4], putting limit molar conductivity Λ0m([bmim][BF4], 298 K) = 9.37 S m−1 M−1, λ+([bmim]+, 298 K)10 = 5.17 S m−1 M−1, reported in the literature, into independent ionic motion law formula:
| Λ0m = ν+λ+ + ν−λ− | (3) |
| D = (RT/F2)(λ/|ν|) | (4) |
According to Fig. 5a and Table 1, we can find that the experimental values of the relaxation time for the benzene/TX-100/[bmim][BF4] system are between 1.330 ns and 4.272 ns which is in the same order of magnitude with its theoretical value 1.78 ns. Similarly, the experimental values of the relaxation time for toluene/TX-100/[bmim][PF6] system are between 0.313 ns and 4.743 ns (Fig. 5b and Table 1) which is also in the same order of its theoretical 1.32 ns. Accordingly, there is reason to believe that the relaxation is caused by the fluctuations of the IL anions in the TX-100 hydrophilic chain.
For comparison, the relaxation time τ for the two IL-based microemulsions was plotted as a function of the weight fraction of ILs in Fig. 5. As can be seen that whether for benzene/TX-100/[bmim][BF4] or toluene/TX-100/[bmim][PF6], the values of τ were divided into three regions (at the vicinity of 0.1 and 0.28 for benzene/TX-100/[bmim][BF4]; at about 0.18 and 0.3 for toluene/TX-100/[bmim][PF6]). It is worth mentioning that the two inflection points arrowed in Fig. 5 were in amazing consistency with the points P1 and P2 in their phase diagram (Fig. 2), and the three regions correspond with the IL/O, B.C. and O/IL micro area in the phase diagram, respectively. This indicates that the dielectric parameter can be an indicator which can monitor the phase transition and provide certain information on the transition.
It was also seen from Fig. 5 that when ILs concentration CIL increase near B.C. region, the values of observed τ close to the calculated values, while the calculated values were always lower than the observed values in O/IL or IL/O micro region. This might be explained as: in the O/IL and IL/O micro regions, ions fluctuated in a confined space. Because in the micelle/reverse micelle shell, there is the ineluctable electrostatic interaction between the ions and fixed charges on the adjacent chains, and the calculated values were obtained under the assumption that the ions drifted freely in the free space. While for the B.C. micro region, although there may be different microstructures for these two different systems, the ion migration was promoted in B.C. of both systems. Because there was no micelles/reverse micelles shell for benzene/TX-100/[bmim][BF4] in B.C. (see Fig. 4B) so that ions in aqueous channel can fluctuate freely; and for toluene/TX-100/[bmim][PF6] (Fig. 4C), the exchange between molecule clusters also accelerated the ion migration. As a result, the experiment values in B.C. of both systems were far closer to the calculated values compared to the above two micro areas.
3.3 Electric conduction mechanism
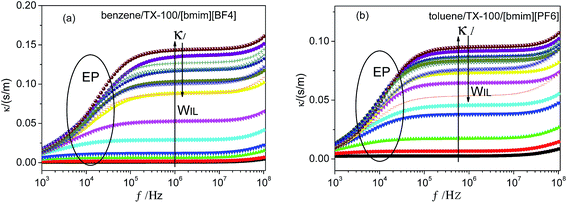
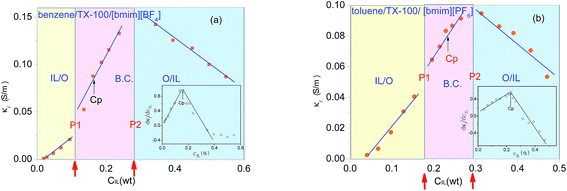
The ions of the ILs played the electric conduction role in the present studied microemulsions. From the model in Fig. 4D, it can be seen that, it is the anions surrounding the TX-100 molecular chain that fluctuated under the action of an alternating electric field. The low frequency conductivity, namely, the 105 to 107 Hz frequency band in the conductivity spectrum (Fig. 6), is ascribed to the migration of anions and cations in the bulk solution along the direction of the electric field (the low frequency band below 105 Hz was from the electrode polarization (EP)43). From Fig. 6, we can roughly see that the change of the conductivity κ with CIL is non-linear, i.e. not monotonically increase or decrease. To analyze this variation trend in detail, we plotted the low-frequency conductivity κl (the values of κl were drawn from 1 MHz to avoid the influence of EP) against the CIL for the two IL-based microemulsions in Fig. 7.From Fig. 7, it can be seen that κl shows different change trends in the different micro regions of both two systems. Besides, it's worth mentioning that the inflection points of the two microemulsions are unanimous with the points P1, P2 of the phase diagram shown in Fig. 2. This accordance means that discontinuity of conductivity indicated the changes in the internal structure of the microemulsions. And according to the conductivity, we can get explanations about the mechanism of the microscopic phase transition: the conductivity was small, but increased linearly with the increase of the CIL in the IL/O region. This is because that although the IL was encapsulated in the microemulsion droplets, due to the large conductivity of the IL, the conductivity of the system was also influenced strongly by the IL. In the B.C. region, since the ILs formed their own special transportation pipeline which enhanced the conductive ability, κl appears sharp increase at the junction between IL/O and B.C. region for benzene/TX-100/[bmim][BF4] microemulsion (Fig. 7a). While κl of toluene/TX-100/[bmim][PF6] kept increase trend (Fig. 7b). In the O/IL region, owing to the gradually increasing viscosity of the system, although the IL increased, the migration of IL was constricted. Consequently, the low-frequency conductivity of the systems decreased.
In addition, the areas of the B.C. of the two microemulsion systems in both Fig. 5 and 7, were similar-sized. While their IL/O and O/IL micro regions were different from one another. Regarding to this difference, we can consider from the difference of the hydrophobicity of the ILs in the two microemulsions: [bmim][BF4] is hydrophilic and [bmim][PF6] is hydrophobic. In this way, with the increase of CIL, [bmim][BF4] was easier to form a core with the hydrophilic surfactant TX-100, so the area of O/IL was larger than IL/O. In contrast, as a result of the hydrophobility of [bmim][PF6], the difference between [bmim][PF6] and toluene was not large, so the IL/O area and O/IL area was roughly the same.
3.4 The percolation in IL-based microemulsions
The uprush of κl in B.C. region of Fig. 7 reminds us of percolation. In order to obtain the percolation threshold Cp, we plotted dκl/dCIL against CIL as inset in Fig. 7. And its inflection point gives the percolation threshold Cp (≈16.2 wt%) for benzene/TX-100/[bmim][BF4] and Cp (≈22.9 wt%) for toluene/TX-100/[bmim][PF6] microemulsion, which are pointed out by the arrows. Generally, there are two kinds of theories to explain the percolation process of the low-frequency conductivity of the microemulsion: the static percolation theory comes down the percolation to the appearance of the B.C. structure of oil and water.44 Dynamic percolation theory holds that it's the interaction between water-drops that causes the formation of percolation clusters, and ions are transported by the exchange of clusters.45 Both the static and dynamic percolation theory agree that when it closes to the percolation transition concentration (percolation threshold), the relation between DC conductivity and the concentration of the hydrophilic phase follows the scaling law:| κl ∝ |Cp − C|−s, Cp > C | (5) |
| κl ∝ |C − Cp|μ, Cp < C | (6) |
| Entries | Static percolation | Dynamic percolation | Benzene/TX-100/[bmim][BF4] | Toluene/TX-100/[bmim][PF6] |
|---|---|---|---|---|
| s | 0.7 | 1.2 | 0.503 | 1.039 |
| μ | 1.9 | 1.9 | 0.609 | 0.809 |
From the dynamic perspective of the mechanism, the ion migration rate is in proportion to the absolute value of C − Cp which imply that the smaller the absolute value of C − Cp was, far closer to equilibrium, the lower ion transfer rate was. According to the results of our experiments, there is reason to believe that the ions transfer rate of benzene/TX-100/[bmim][BF4] system was faster than toluene/TX-100/[bmim][PF6] system. And we can interpret it in the light of percolation model (dynamic or static). In the benzene/TX-100/[bmim][BF4] system (Fig. 4B), because of the hydrophilicity of [bmim][BF4], they increasingly penetrated to the core of the reverse micelles of TX-100 which urged the system gradually to form a continuous phase just like an ion channel. That's what the static percolation process called, thus the ion migration rate was much faster. While in toluene/TX-100/[bmim][PF6] system (Fig. 4C), [bmim][PF6] is hydrophobic which make it less easily enter the core of the micelles. In addition, IL ions participate in the formation of the molecule clusters of oil phase with toluene. As a result, the ions conducted charges by exchanging charges between molecular clusters, namely dynamic percolation process, so that ion migration rate become relatively slower. Regarding the values of μ of the two systems were somewhat low, this may be because those factual factors didn't perfectly conform to the assumptions, such as the too large viscosity of the system.
4. Concluding remarks
In emulsion or microemulsion system, the huge oil–water interface results in a relaxation which called the interfacial polarization, relying on the ratio of the electrical properties of both oil and aqueous phase. More specifically, the permittivity of water is close to 80, while that of the benzene and toluene are less than 10. Accordingly, interfacial polarization occurs because of the large differences in electrical properties between the oil phase and water phase. However, the permittivity of IL is just close to 10 similarly to that of oil phase, as a result that the interfacial polarization become less marked and even disappearing. Instead, a relaxation caused by ions fluctuating on the molecular chains of TX-100 was observed. This conclusion was confirmed by the relaxation time obtained with Einstein equation and comparing with our experimental values.The experiment paths are divided into three distinct regions by the IL concentration dependence of relaxation time or low frequency conductivity. The inflection points were in amazing accordance with the phase transition points in the corresponding phase diagram. In addition, the relaxation parameters and electrical parameters also reveal the microstructure of all regions. All these above strongly confirmed that dielectric analysis can be used as a powerful indicator to find phase change process.
The difference of anions of ILs resulted in the different relaxation time, although the ions fluctuate similarly along the same TX-100 molecular chain. This mainly stemmed from the difference on the hydrophilicity of the ILs between the two microemulsion systems: [bmim][BF4] is hydrophilic, while the [bmim][PF6] is hydrophobic. From microcosmic point of view, with the change of IL's concentration, there are three microdomains, i.e. IL/O, intermediate transition region B.C., and O/IL. And our analyzing results suggested diverse microscopical physical picture to show how the ion migrated through the B.C. of two systems. In the benzene/TX-100/[bmim][BF4] microemulsion, the ions in B.C. directly entered into the continuous phase TX-100 constructed through the pipeline, which was so-called the static percolation process. While for the toluene/TX-100/[bmim][PF6], ions transported in a dynamic process: ions reached the other side through the ionic exchange between the surfactant molecule clusters.
Acknowledgements
Financial support of this work by the National Natural Science Foundation of China (No. 21173025 and 21473012) and the Major Research Plan of NSFC (21233003) are gratefully acknowledged.References
- W. Kunz, T. Zemb and A. Harrar, Using ionic liquids to formulate microemulsions: current state of affairs, Curr. Opin. Colloid Interface Sci., 2012, 17(4), 205–211 CrossRef CAS.
- Z. Qiu and J. Texter, Ionic liquids in microemulsions, Curr. Opin. Colloid Interface Sci., 2008, 13(4), 252–262 CrossRef CAS.
- T. L. Greaves and C. J. Drummond, Protic ionic liquids: properties and applications, Chem. Rev., 2008, 108(1), 206–237 CrossRef CAS PubMed.
- T. L. Greaves and C. J. Drummond, Ionic liquids as amphiphile self-assembly media, Chem. Soc. Rev., 2008, 37(8), 1709–1726 RSC.
- J. P. Hallett and T. Welton, Room-temperature ionic liquids: solvents for synthesis and catalysis. 2, Chem. Rev., 2011, 111(5), 3508–3576 CrossRef CAS PubMed.
- X. Han and D. W. Armstrong, Ionic liquids in separations, Acc. Chem. Res., 2007, 40(11), 1079–1086 CrossRef CAS PubMed.
- J. Li, J. Zhang, B. Han, Y. Wang and L. Gao, Compressed CO2-enhanced solubilization of 1-butyl-3-methylimidazolium tetrafluoroborate in reverse micelles of Triton X-100, J. Chem. Phys., 2004, 121(15), 7408–7412 CrossRef CAS PubMed.
- Y. Gao, S. Wang, L. Zheng, S. Han, X. Zhang, D. Lu, L. Yu, Y. Ji and G. Zhang, Microregion detection of ionic liquid microemulsions, J. Colloid Interface Sci., 2006, 301(2), 612–616 CrossRef CAS PubMed.
- J. Eastoe, S. Gold, S. E. Rogers, A. Paul, T. Welton, R. K. Heenan and I. Grillo, Ionic liquid-in-oil microemulsions, J. Am. Chem. Soc., 2005, 127(20), 7302–7303 CrossRef CAS PubMed.
- M. Ali, A. Sarkar, M. Tariq, A. Ali and S. Pandey, Dilute aqueous 1-butyl-3-methylimidazolium hexafluorophosphate: properties and solvatochromic probe behavior, Green Chem., 2007, 9(11), 1252–1258 RSC.
- J. Liu, S. Cheng, J. Zhang, X. Feng, X. Fu and B. Han, Reverse Micelles in Carbon Dioxide with Ionic-Liquid Domains, Angew. Chem., 2007, 119(18), 3377–3379 CrossRef.
- X. Yu, Q. Li, M. Wang, N. Du and X. Huang, Study on the catalytic performance of laccase in the hydrophobic ionic liquid-based bicontinuous microemulsion stabilized by polyoxyethylene-type nonionic surfactants, Soft Matter, 2016, 12(6), 1713–1720 RSC.
- A. Klee, S. Prevost, W. Kunz, R. Schweins, K. Kiefer and M. Gradzielski, Magnetic microemulsions based on magnetic ionic liquids, Phys. Chem. Chem. Phys., 2012, 14(44), 15355–15360 RSC.
- M. L. Klossek, D. Touraud and W. Kunz, Microemulsions with renewable feedstock oils, Green Chem., 2012, 14(7), 2017–2023 RSC.
- S. Mandal, S. Ghosh, C. Banerjee, J. Kuchlyan, D. Banik and N. Sarkar, A novel ionic liquid-in-oil microemulsion composed of biologically acceptable components: an excitation wavelength dependent fluorescence resonance energy transfer study, J. Phys. Chem. B, 2013, 117(11), 3221–3231 CrossRef CAS PubMed.
- J. H. Porada, D. Zauser, B. Feucht and C. Stubenrauch, Tailored ionic liquid-based surfactants for the formation of microemulsions with water and a hydrophobic ionic liquid, Soft Matter, 2016, 12(30), 6352–6356 RSC.
- Y. Gao, S. Han, B. Han, G. Li, D. Shen, Z. Li, J. Du, W. Hou and G. Zhang, TX-100/water/1-butyl-3-methylimidazolium hexafluorophosphate microemulsions, Langmuir, 2005, 21(13), 5681–5684 CrossRef CAS PubMed.
- Y. Gao, N. Li, L. Zheng, X. Zhao, S. Zhang, B. Han, W. Hou and G. Li, A cyclic voltammetric technique for the detection of micro-regions of bmimPF6/Tween 20/H2O microemulsions and their performance characterization by UV-Vis spectroscopy, Green Chem., 2006, 8(1), 43–49 RSC.
- D. Jiang, L. Chen, A. Wang and Z. Yan, Esterification of oleic acid in [Bmim]BF4/[Hmim]HSO4 + TX-100/cyclohexane ionic liquid microemulsion, RSC Adv., 2014, 4(97), 54427–54433 RSC.
- A. K. Ganguli, A. Ganguly and S. Vaidya, Microemulsion-based synthesis of nanocrystalline materials, Chem. Soc. Rev., 2010, 39(2), 474–485 RSC.
- B. Kar, S. Bardhan, K. Kundu, S. K. Saha, B. K. Paul and S. Das, Physicochemical studies of water-in-oil nonionic microemulsion in presence of benzimidazole-based ionic liquid and probing of microenvironment using model C–C cross coupling (Heck) reaction, RSC Adv., 2014, 4(40), 21000 RSC.
- H. Zhang, Z. Hu, M. Li, L. Hu and S. Jiao, A high-performance supercapacitor based on a polythiophene/multiwalled carbon nanotube composite by electropolymerization in an ionic liquid microemulsion, J. Mater. Chem. A, 2014, 2(40), 17024–17030 CAS.
- X. Wang, J. Cheng, G. Ji, X. Peng and Z. Luo, Starch nanoparticles prepared in a two ionic liquid based microemulsion system and their drug loading and release properties, RSC Adv., 2016, 6(6), 4751–4757 RSC.
- K. Asami, Characterization of heterogeneous systems by dielectric spectroscopy, Prog. Polym. Sci., 2002, 27(8), 1617–1659 CrossRef CAS.
- T. Hanai, Electrical properties of emulsions, Emulsion Sci., 1968, 354–477 Search PubMed.
- T. Skodvin, T. Jakobsen and J. Sjöblom, Dielectric properties of W/O emulsions under flow, J. Dispersion Sci. Technol., 1994, 15(4), 423–448 CrossRef CAS.
- A. Ponton, T. K. Bose and G. Delbos, Dielectric study of percolation in an oil-continuous microemulsion, J. Chem. Phys., 1991, 94(10), 6879–6886 CrossRef CAS.
- S. Bhattacharya, J. P. Stokes, M. W. Kim and J. S. Huang, Percolation in an oil-continuous microemulsion, Phys. Rev. Lett., 1985, 55(18), 1884 CrossRef CAS PubMed.
- S. Schrödle, G. Hefter, W. Kunz and R. Buchner, Effects of nonionic surfactant C12E5 on the cooperative dynamics of water, Langmuir, 2006, 22(3), 924–932 CrossRef PubMed.
- K. Asami, Dielectric relaxation in a water-oil-triton X-100 microemulsion near phase inversion, Langmuir, 2005, 21(20), 9032–9037 CrossRef CAS PubMed.
- C. Cametti, Dielectric spectra of ionic water-in-oil microemulsions below percolation: Frequency dependence behavior, Phys. Rev. E, 2010, 81(3), 031403 CrossRef CAS PubMed.
- Z. Chen and R. Nozaki, Dielectric spectroscopy study on ionic liquid microemulsion composed of water, TX-100, and BmimPF6, J. Chem. Phys., 2012, 136(24), 244505 CrossRef PubMed.
- Y. Gao, N. Li, L. Zheng, X. Bai, L. Yu, X. Zhao, J. Zhang, M. Zhao and Z. Li, Role of Solubilized Water in the Reverse Ionic Liquid Microemulsion of 1-Butyl-3-methylimidazolium Tetrafluoroborate/TX-100/Benzene, J. Phys. Chem. B, 2007, 111(10), 2506–2513 CrossRef CAS PubMed.
- Y. Lian and K. Zhao, Dielectric analysis of micelles and microemulsions formed in a hydrophilic ionic liquid. I. Interaction and percolation, J. Phys. Chem. B, 2011, 115(39), 11368–11374 CrossRef CAS PubMed.
- K. Chen and K. Zhao, Dielectric analysis of the [Bmim][PF 6]/TX-100/ethyleneglycol nonaqueous microemulsions: Microstructures and percolation, Colloids Surf., A, 2014, 461, 50–56 CrossRef CAS.
- J. Li, J. Zhang, H. Gao, B. Han and L. Gao, Nonaqueous microemulsion-containing ionic liquid [bmim][PF6] as polar microenvironment, Colloid Polym. Sci., 2005, 283(12), 1371–1375 CAS.
- Y. Gao, N. Li, L. Zheng, X. Bai, L. Yu, X. Zhao, J. Zhang, M. Zhao and Z. Li, Role of solubilized water in the reverse ionic liquid microemulsion of 1-butyl-3-methylimidazolium tetrafluoroborate/TX-100/benzene, J. Phys. Chem. B, 2007, 111(10), 2506–2513 CrossRef CAS PubMed.
- T. Hanai, T. Imakita and N. Koizumi, Analysis of dielectric relaxations of w/o emulsions in the light of theories of interfacial polarization, Colloid Polym. Sci., 1982, 260(11), 1029–1034 CAS.
- S. Havriliak and S. Negami, A complex plane representation of dielectric and mechanical relaxation processes in some polymers, Polymer, 1967, 8, 161–210 CrossRef CAS.
- Y. Lian and K. Zhao, Study of micelles and microemulsions formed in a hydrophobic ionic liquid by a dielectric spectroscopy method. I. Interaction and percolation, Soft Matter, 2011, 7(19), 8828–8837 RSC.
- D. R. Lide, Handbook of Chemistry and Physics, 77th edn, 1996 Search PubMed.
- H. H. Paradies, Shape and size of a nonionic surfactant micelle. Triton X-100 in aqueous solution, J. Phys. Chem., 1980, 84(6), 599–607 CrossRef CAS.
- F. Bordi, C. Cametti and T. Gili, Reduction of the contribution of electrode polarization effects in the radiowave dielectric measurements of highly conductive biological cell suspensions, Bioelectrochemistry, 2001, 54(1), 53–61 CrossRef CAS PubMed.
- Y. Talmon and S. Prager, Statistical thermodynamics of phase equilibria in microemulsions, J. Chem. Phys., 1978, 69(7), 2984–2991 CrossRef CAS.
- M. Laguës, Electrical conductivity of microemulsions: a case of stirred percolation, J. Phys., Lett., 1979, 40(14), 331–333 CrossRef.
- G. S. Grest, I. Webman, S. A. Safran and A. Bug, Dynamic percolation in microemulsions, Phys. Rev. A, 1986, 33(4), 2842 CrossRef CAS.
- B. Derrida, D. Stauffer, H. J. Herrmann and J. Vannimenus, Transfer matrix calculation of conductivity in three-dimensional random resistor networks at percolation threshold, J. Phys., Lett., 1983, 44(17), 701–706 CrossRef.
Footnote |
| † Electronic supplementary information (ESI) available. See DOI: 10.1039/c7ra00573c |
| This journal is © The Royal Society of Chemistry 2017 |

