
 Open Access Article
 This Open Access Article is licensed under a Creative Commons Attribution-Non Commercial 3.0 Unported Licence
Electrochemical impedance spectroscopy (EIS) study on the degradation of acrylic polyurethane coatings
Fuyou Luabcd,
Baodong Song*a,
Pei Heabcd,
Zhi Wang abcd and
Jixiao Wang*abcd
abcd and
Jixiao Wang*abcd
aCERC, School of Chemical Engineering and Technology, Tianjin University, Tianjin 300072, PR China. E-mail: bdsong@tju.edu.cn; jxwang@tju.edu.cn; Fax: +86 22 27404757; Fax: +86 22 27404496; Tel: +86 22 27403584 Tel: +86 22 27404533
bTianjin Key Laboratory of Membrane Science and Desalination Technology, Tianjin University, Tianjin 300072, PR China
cState Key Laboratory of Chemical Engineering, Tianjin University, Tianjin 300072, PR China
dCollaborative Innovation Center of Chemical Science and Engineering (Tianjin), Tianjin University, Tianjin 300072, PR China
First published on 28th February 2017
Abstract
Two component polyurethane coatings are widely used for materials protection. Herein, a series of acrylic polyurethane coatings were prepared by reaction of hydroxyl acrylic resin and hexamethylene diisocyanate (HDI) biuret. These coatings have different isocyanate to hydroxyl ratios (expressed as NCO/OH). The degradation process of the coatings was evaluated by electrochemical impedance spectroscopy measurement. Then, the results were analyzed using equivalent electrical circuits. Besides, the adhesion and water resistance of the coatings were also investigated. Experimental results demonstrated that the higher the NCO/OH ratios within a certain range, the better the corrosion resistance. Specifically, the coating with NCO/OH = 1.4 provided the best corrosion resistance, and its impedance modulus still remained at close to 1 × 10¹¹ ohms per cm2 after 50 days immersion. However, the corrosion resistance of coatings with NCO/OH = 0.8 and NCO/OH = 1.0 were relatively poor. More interestingly, with the increase in NCO/OH ratios, the coating's adhesion increased slightly and the water resistance improved noticeably.
1. Introduction
Organic coatings play a very important role in the protection of materials. Polyurethane coatings have the characteristics of good abrasion resistance and high flexibility, and good physical and mechanical properties. They are widely used in the automotive, furniture and ship surface fields.1–5 It is generally considered that polyurethane is a block copolymer composed of a soft segment and a hard segment. The soft segment pertains to various polyols or ammonia (terminal hydroxyl or amine groups polymer), such as polyester polyol, polyether polyol and acrylic polyol or mixtures of them. The hard segment includes chain extenders and curing agents.6,7 In particular, the coatings prepared by hydroxyl acrylic resin and aliphatic isocyanate exhibit a better performance, and are widely used in high performance establishments.8,9 Nevertheless, isocyanate curing agents usually react with water from moisture, water in pigments or amines of pretreated pigments,10 resulting in coatings that have cured thoroughly possessing different NCO/OH ratios. Further, different NCO/OH ratios affect corrosion resistance, water absorption, and adhesion properties of coatings significantly.11–13 But above all, it is difficult to get detailed impact information on the NCO/OH ratios of the coatings from coating distributors and manufacturers. Thus, it is necessary to investigate the effect of NCO/OH ratios on the comprehensive performance of acrylic polyurethane coatings.We study the degradation behavior of acrylic polyurethane varnish with different NCO/OH ratios in saline solution. The coated specimens were immersed in 3.5 wt% NaCl solution at 50 °C for 50 days. Then, electrochemical impedance spectroscopy (EIS) was conducted. By the way, EIS was an effective tool for examination and evaluation of the protective properties of organic coatings.14,15 Furthermore, it is rapid and has no destructive effective on samples.16,17 Finally, results of the EIS measurement were simulated and analyzed by equivalent electrical circuits (EEC) deep. Besides, the effects of NCO/OH ratios on adhesion and water resistance of the coatings were also investigated roundly. These research results would provide important information to product excellent two component acrylic polyurethane coatings.
2. Experimental section
2.1. Materials
Hydroxyl acrylic resin (1107N, hydroxyl groups content is 3.2 wt%) was purchased from Foshan gaoming tod chemical Ltd. Co., China. The HDI biuret (N75, NCO groups content is 16.8 wt%) was obtained from Bayer Co., Germany. Organic Tin Catalyst (DBTDL-T12) was purchased from Shanghai Aladdin Bio-Chem Technology Ltd., China. Butyl acetate (BAC) supplied as thinner was purchased from Tianjin Jiangtian Reagent Ltd. Co., China. All chemical materials are analytical reagent and used directly without further purification. No pigments and other fillers were added to the coatings.Mild steel plates, 80 mm × 30 mm × 3 mm (Q235, C: 0.17–0.24%; Si: 0.17–0.37%; Mn: 0.35–0.65%; S: <0.030%; P: <0.030%), were used as the metal substrates. The steel plates were grinded with 360#, 600#, 1000# and 1500# abrasive papers to remove the rust, followed by a thorough rinse with anhydrous ethanol and acetone. Polycarbonate sheets are used as substrates for obtaining detached coating sheets.
2.2. Preparation of coatings
Firstly, stoichiometric hydroxyl acrylic resin, BAC and DBTDL were mixed and ultrasonicated for dispersion. Then, the N75 was added into the above mixtures using an ultrasonic homogenizer for another five minutes to form homogeneous coatings. Coatings with different ratios of NCO/OH (that is 0.8, 1.0, 1.2 and 1.4) were prepared by adjusting the amount of N75. Finally, the formed coatings were brushed onto the pretreated steel plates. To avoid pinhole defects, the specimens was brushed twice. All the coated samples were cured at ambient temperature for 24 hours and then at 60 °C for 12 hours. The dried thickness of the coatings is about 60 ± 10 μm. Curing mechanism of the coatings is shown below Scheme 1.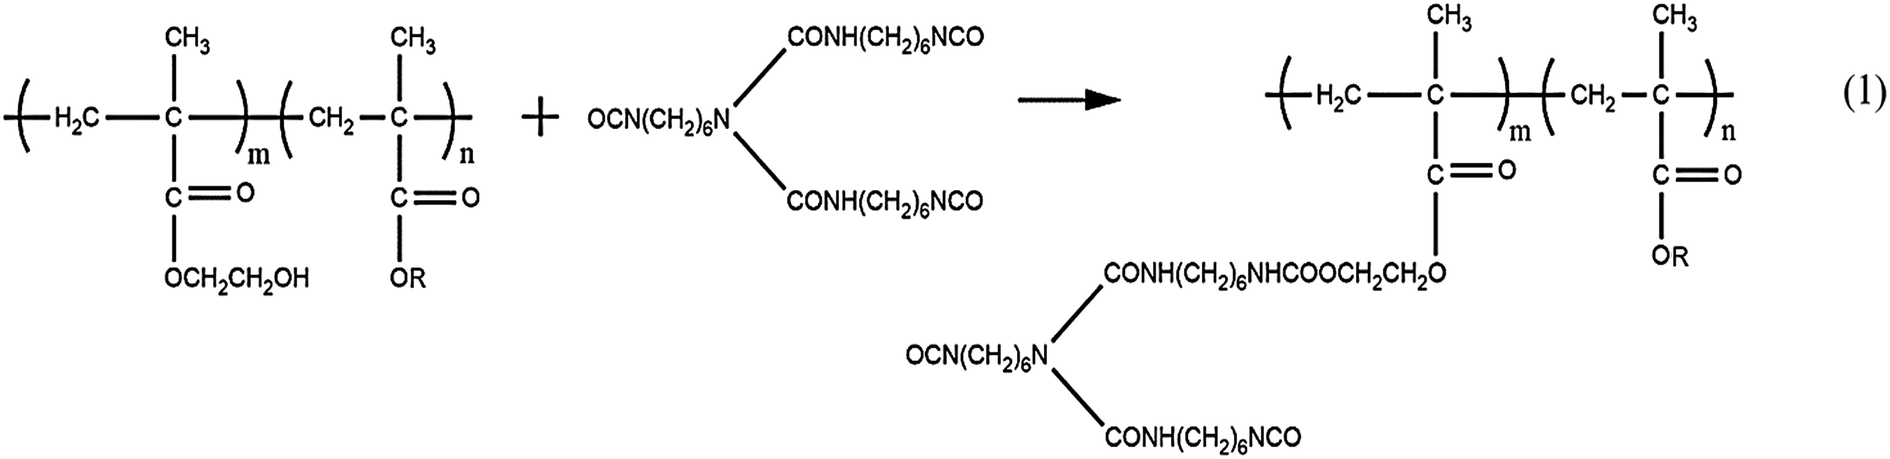 | ||
| Scheme 1 The reaction of acrylic resin and hexamethylene diisocyanate (HDI) biuret. | ||
2.3. Characterizations
The electrochemical workstation (VersaSTAT, USA) was employed with a three-electrode arrangement cell with 3.5 wt% NaCl as the electrolyte. Graphite electrode, saturated calomel electrode (SCE) and coated specimen were used as counter electrode, reference electrode and working electrode respectively. The valid area of the working electrode was 1.00 cm2. EIS measurements were conducted after different immersion intervals in 3.5 wt% NaCl solution. The measurements frequencies ranges from 0.01 Hz to 100 kHz with a 10 mV amplitude. All measurements were carried out in a faraday cage to avoid Coulombs fields.18 The impedance data were fitted and analyzed with equivalent electrical circuit models by ZsimpWin software.The morphology of the coating surface was observed before and after immersion by scanning electron microscopy (SEM) with a JEOL JSM-6700F microscope. The optical photographs of specimens after immersion for 50 days were also recorded by a HD camera.
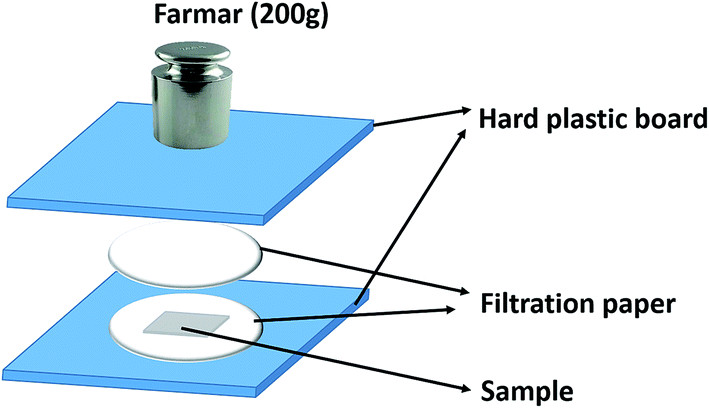
Contact angle (CA) of the coatings was measured to evaluate the hydrophilicity and hydrophobicity by a Dataphysics OCA15EC contact-angle goniometer. Water absorption process of the coatings was test as well by gravimetric method. Detailedly, dry samples (30.0 mm × 80.0 mm) were weighed and then immersed in distilled water. The coating films were immersed in deionized water for some time and then taken out from the water, then absorbing the visible water droplets on surface of samples quickly with a homemade apparatus as shown in Scheme 2.
 | ||
| Scheme 2 A homemade apparatus for removing residual water droplets under the identical condition. | ||
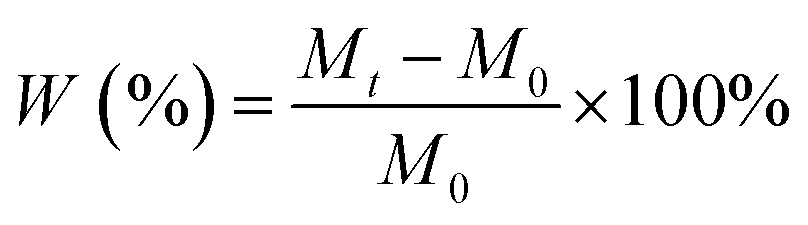
Because of the high aspect ratio of coating films, the edge of the coating is no need to be sealed with wax. The filtration paper is need to be renew for every sample, at least three parallel samples were used to test. The samples were weighed regularly until the weight reaching a stable value. The water absorption ratio (W%) was determined by the following equation:19
 | (1) |
Chemical proportion differences of the coatings were monitored by FTIR-ATR analysis using a Bio-Rad FTS 6000 spectrometer. The ATR attachment was used with 16 scans and a resolution of 8 cm−1 during the range of 4000–650 cm−1.
Adhesion measurements of the coatings on steel plates were tested by pulling off dollies stuck vertically on the surface with a PosiTest Adhesion Tester (PosiTest AT-M, Defelsko, USA). There were five dollies on each sample. All the measurements were conducted at room temperature.
3. Result and discussion
As is known, corrosion of metals include complex electrochemical reactions. It is applicable to analyze the degradation process of coatings by electrochemical measurements.20,21 The Bode and Nyquist plots of different samples are shown below. We can conclude from Fig. 1 that, impedance spectra changes of the samples at different time are obviously. In order to clearly present the capacitive loops at low frequencies, the Nyquist plots at low frequencies are magnified.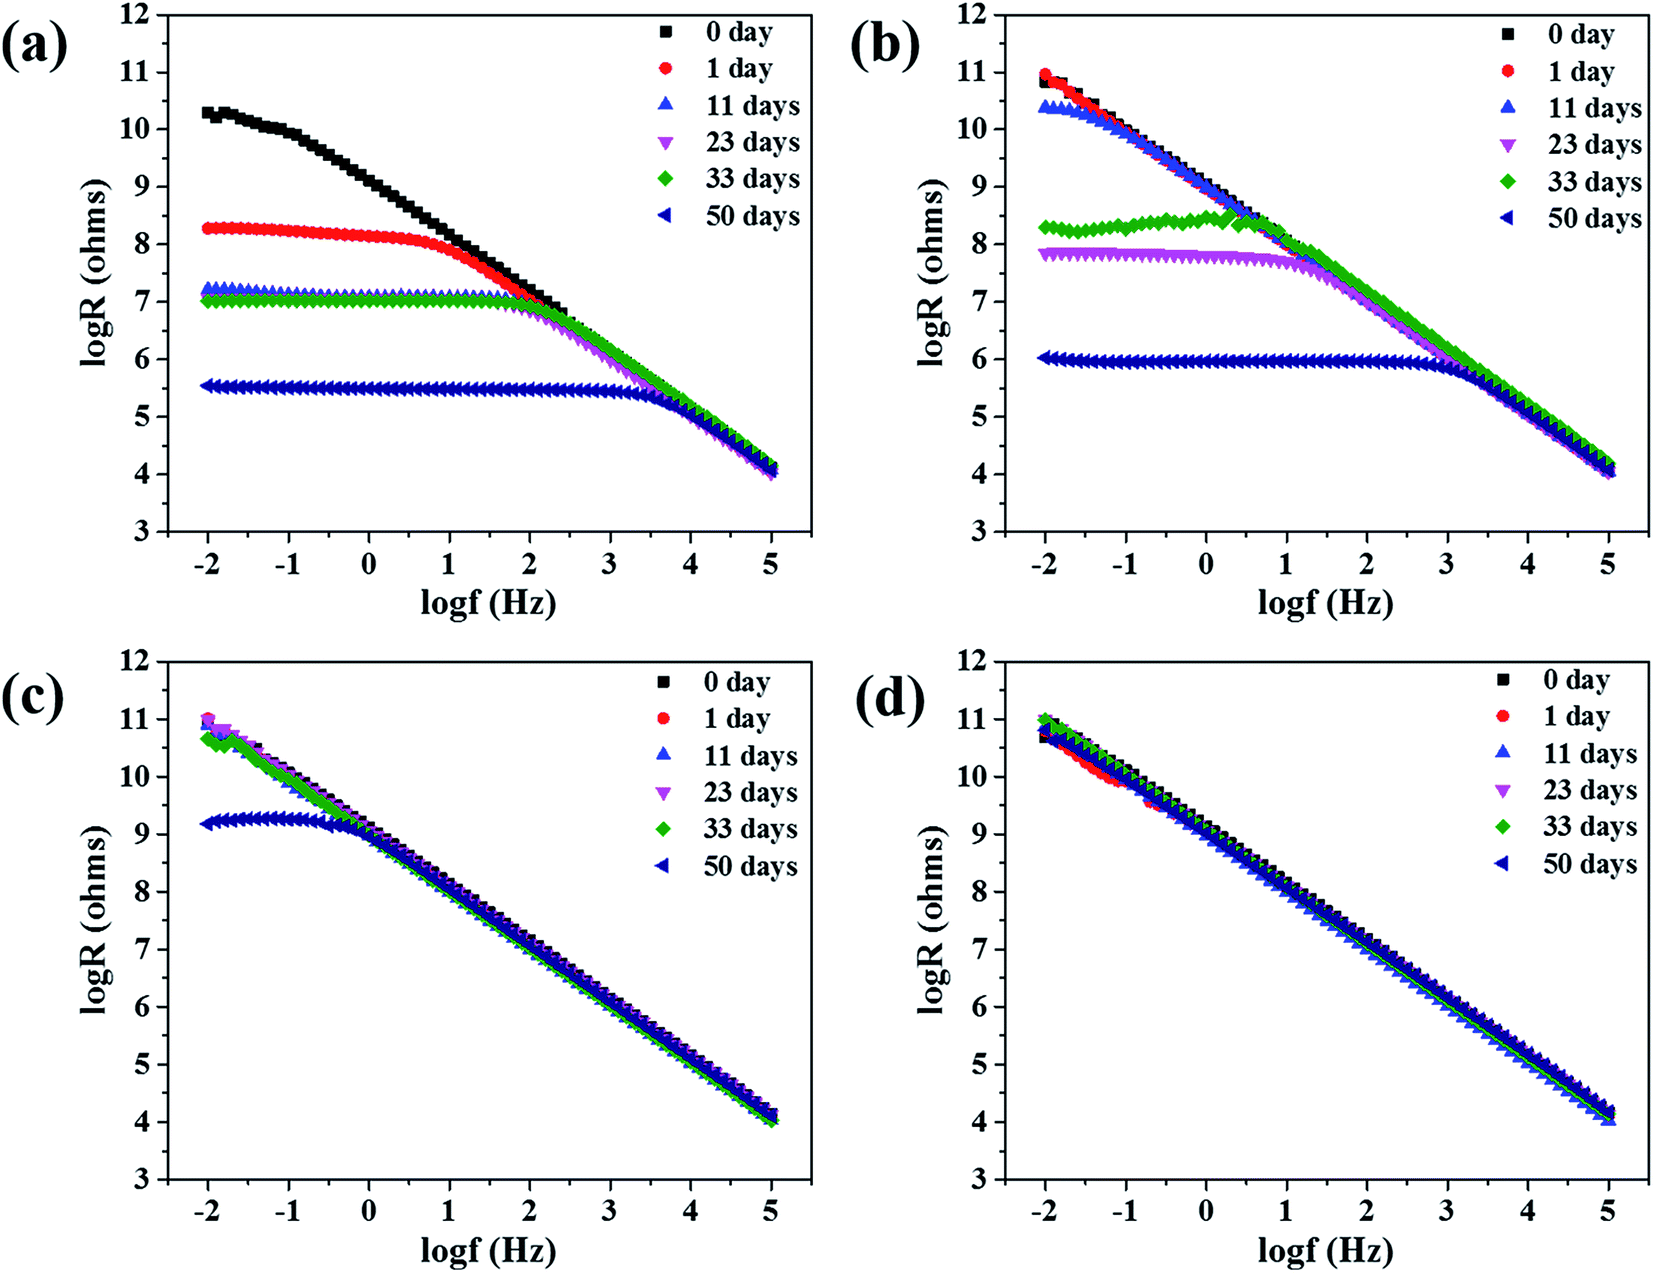 | ||
| Fig. 1 Bode plots of samples in 3.5 wt% NaCl solution after different immersion times: (a) the coating with NCO/OH = 0.8; (b) the coating with NCO/OH = 1.0; (c) the coating with NCO/OH = 1.2; (d) the coating with NCO/OH = 1.4. | ||
Fig. 1 and 2 are the Bode and Nyquist plots respectively. Initially, all samples show a very high resistance (>1010 ohms per cm2) at low frequencies. The Bode plots are close to a straight line with a slope of −1 and the Nyquist plots is close to the Y axis. The phenomena indicated that the coatings act as a pure capacitor at initial days of immersion.22 Then the impedance at the low frequencies gradually decreased with increasing of immersion time. The Nyquist graph slope of the coating with NCO/OH = 0.8 changed from the Y axis to the X axis obviously. And after immersion for 11 days, an obvious trailing semicircle corresponding to two time constants appeared. This phenomenon means the dramatically decrease of coating protection property and the initial corrosion at the metal/coating interface. However, after immersion for 11 days, coating with NCO/OH = 1.0, 1.2 and 1.4 showed no obvious semicircle corresponding to only one time constants. Ordinarily, time constants refers to barrier performance of organic coatings,23 therefore, the last three samples had no obvious corrosion.
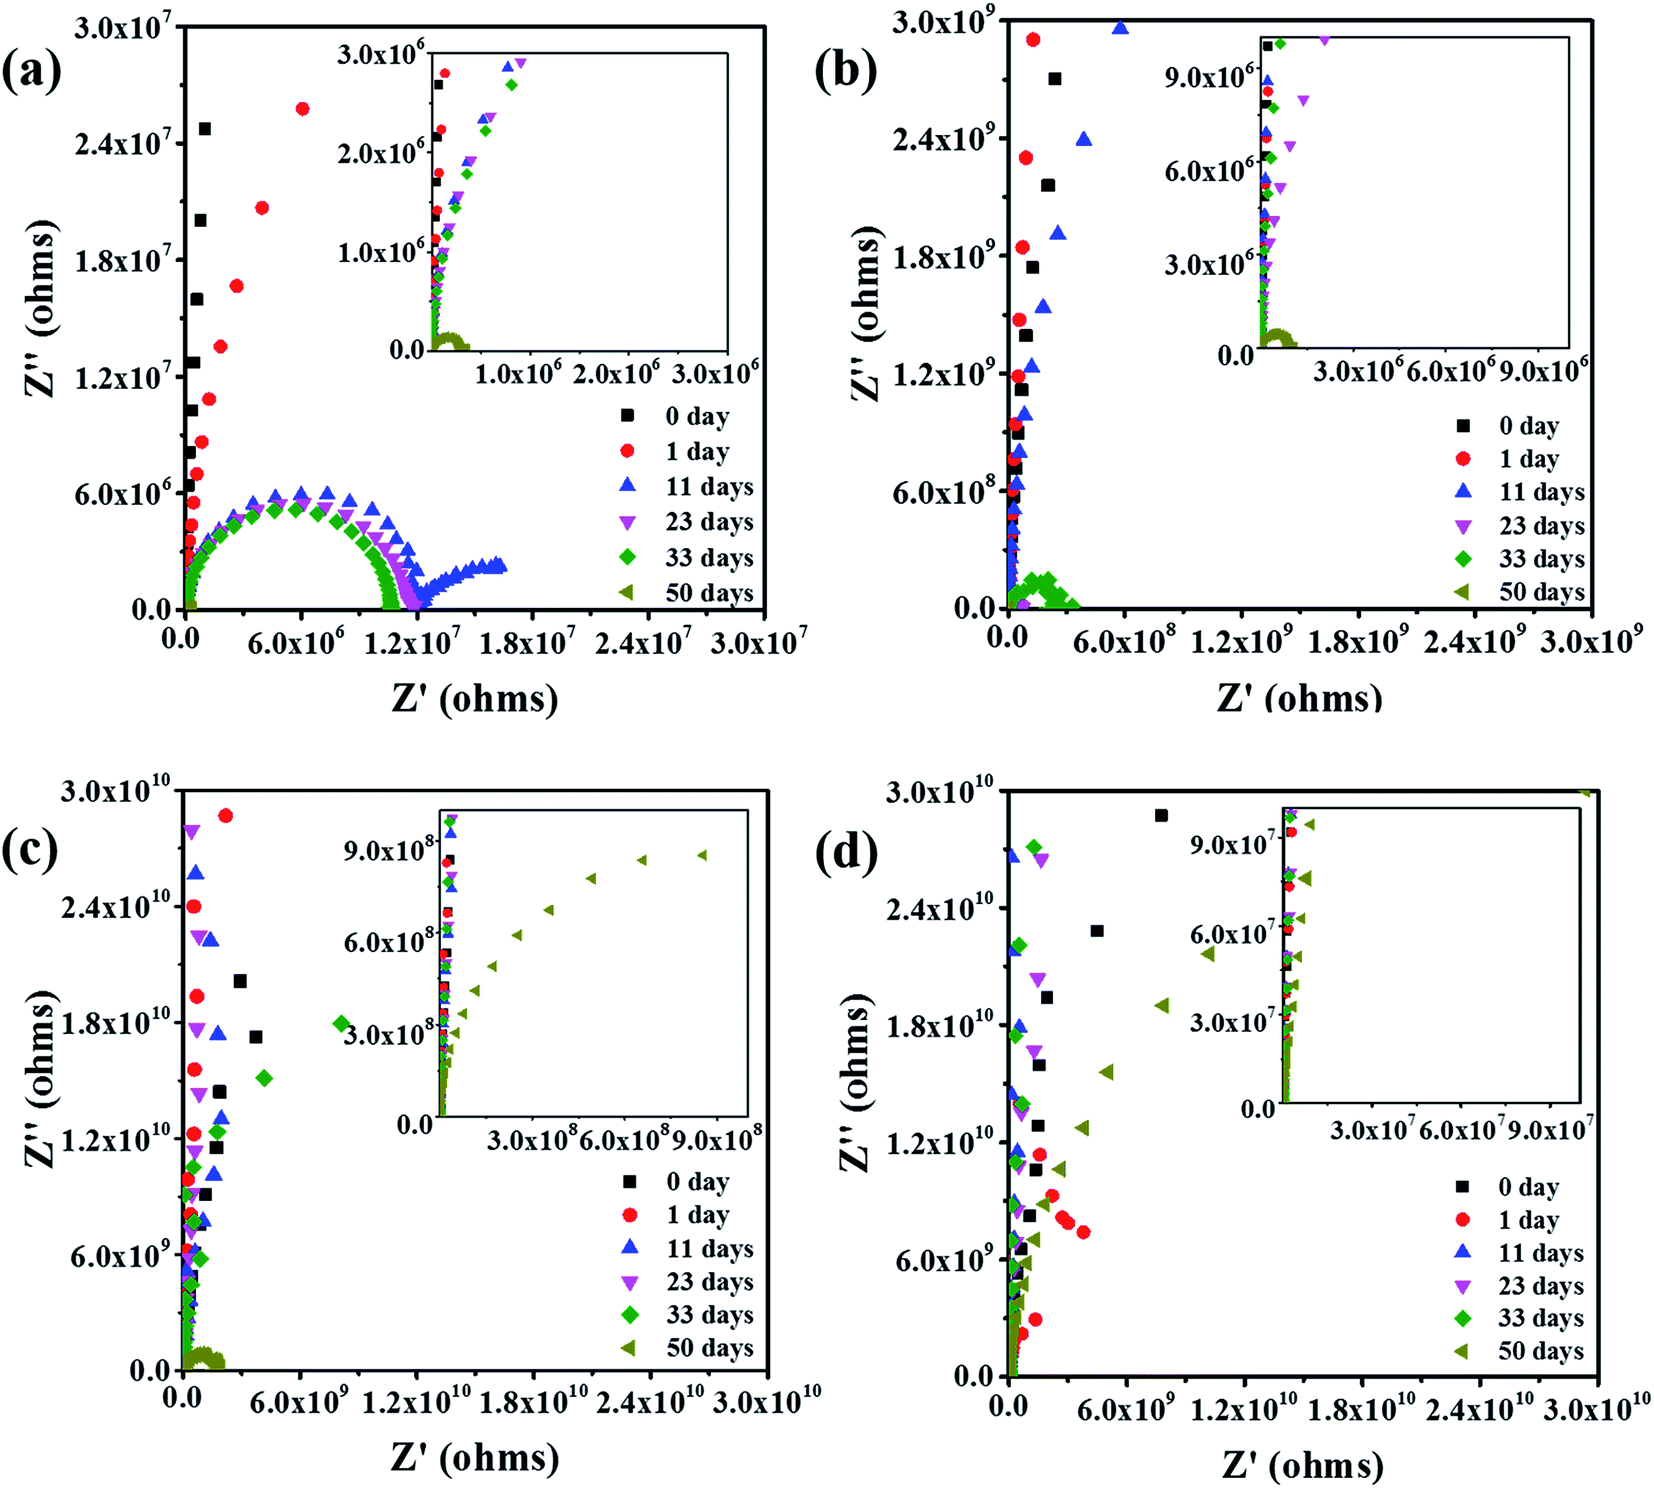 | ||
| Fig. 2 Nyquist plots of specimens in 3.5 wt% NaCl solution after different immersion times: (a) the coating with NCO/OH = 0.8; (b) the coating with NCO/OH = 1.0; (c) the coating with NCO/OH = 1.2; (d) the coating with NCO/OH = 1.4. | ||
After 50 days of immersion, the coating with NCO/OH = 1.4 still maintained very high impedance and the modulus was as high as 1011 ohms per cm2 at low frequencies. For the coating with NCO/OH = 1.2, the impedance modulus at 0.01 Hz is greater than 109 ohms per cm2. As we known, higher than 107 ohms per cm2 impedance at low frequencies means excellent protection for substrate of the coatings.24,25 While, the impedance modulus of both coatings with NCO/OH = 0.8 and coatings with NCO/OH = 1.0 at 0.01 Hz decreased to nearly 1 × 10⁶ ohms per cm2, which indicated the coatings almost losing its protection ability for substrates. It was also found that the Nyquist plots of both coatings of NCO/OH = 0.8 and 1.0 possessed two incomplete capacitive loops after 50 days of immersion. The half circle at high frequency was attributed to the coating protection performance, and the half circle at low frequency was related to the products underneath the coating.26–28 This phenomenon indicated there have generated a serious corrosion. Besides, the Nyquist plot of coating with NCO/OH = 1.4 also showed two unsharp incomplete capacitive loops. It mean the charge transfer resistance is just forming, which may attribute to slight delamination on the interface between metal and coating. Consequently, the barrier effect of the coatings with higher NCO/OH ratios were better.
Equivalent electrical circuits (EEC) were used to quantitatively analyze the degradation degree of coatings. The EEC of the sample with NCO/OH = 0.8 after immersion for 50 days was showed in Fig. 3(a). We can see that, the coatings lost the barrier property completely and formed a new diffusion layer consist of the corrosion products. However, the coatings with NCO/OH = 1.4 still had high protective performance after immersion for 50 days as shown in Fig. 3(b). The charge transfer was the control step of corrosion process. These two classical EEC contained solution resistance (Rs), coating resistance (Rc), coating capacitance (CPEc), double layer capacitance (CPEdl) and charge transfer resistance (Rct). Zw representing the Warburg impedance, which resulted from the diffusion of ions from the electrolyte to the electrode interface. Constant phase elements (CPE) are employed to replace capacitance (C) elements with dispersion effect to obtain more precious fitting results.29,30
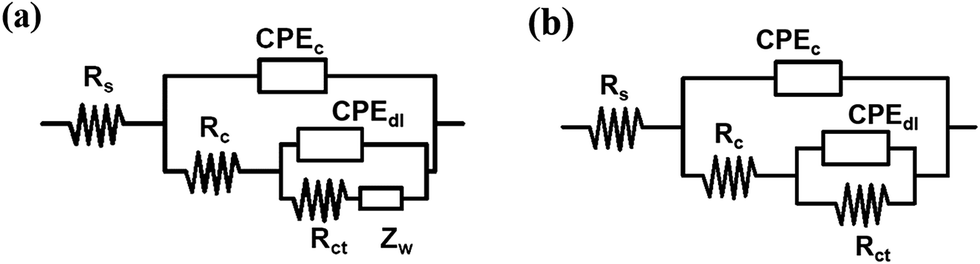 | ||
| Fig. 3 EEC models selected to fit the EIS measurement: (a) the coating with NCO/OH = 0.8; (b) the coating with NCO/OH = 1.4. | ||
The fitting results of both Bode plots and phase angle plots after 50 days immersion were shown in Fig. 4. And the simulated parameters of electrochemical elements were listed in Table 1. The experimental results matched well with the calculated results of equivalent electrical circuits. After immersion for 50 days, the coating resistance (Rc) increased obviously with the increase of the NCO/OH ratios. Specifically, the resistance of the coating with NCO/OH = 1.4 was 1.19 × 10⁸, reflecting the coating could prevent electrolyte penetrating into the coatings effectively. While, the resistance of the coating with NCO/OH = 0.8 was very low, with a value of 2.93 × 10⁵. In order to compare the difference between capacitance (Cc) and double layer capacitance (Cdl), Cc values and CPEdl values according to the fitting CPEc and CPEdl values respectively were calculated purposely. The calculation results showed that the Cc were of the same order of magnitude at different NCO/OH ratios. Precisely, Cc decreased with the increase of the NCO/OH ratios, which was caused by different water content of the coatings. It is generally considered that, the higher the value of Cdl is, the more serious delamination.31 As you can see, the Cdl decreased obviously with the increase of NCO/OH, which was attributed to massive polar effect of excess NCO. Rct is supposed to reflect the trend of electrochemical reactions, and the smaller the value of Rct, the more difficult the protection.32 We can see from Table 1 that, Rct increased with the increase of the NCO/OH ratios. That is to say, coatings with high ratios of NCO/OH were not easy to degrade, which was coincide with Bode and Nyquist results.
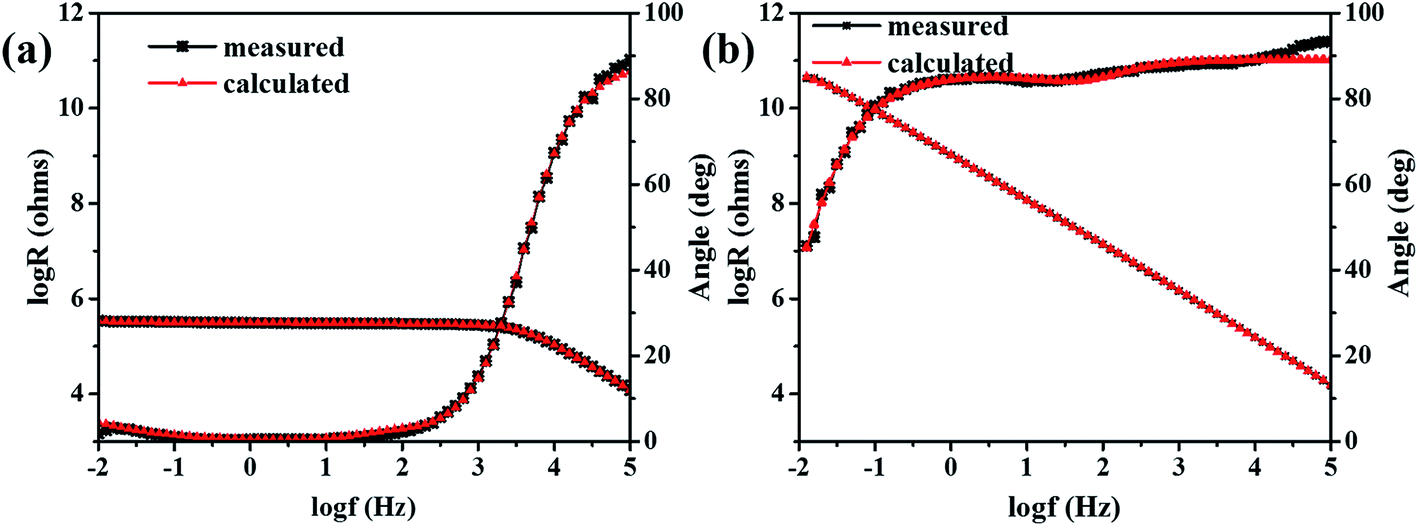 | ||
| Fig. 4 The EEC fitting results of (a) the coating with NCO/OH = 0.8 and (b) the coating with NCO/OH = 1.4 after 50 days immersion. | ||
| NCO/OH (R) | Rs (ohms per cm2) | Rc (ohms per cm2) | Cc (F cm−2) | Rct (ohms per cm2) | Cdl (F cm−2) | Zw (ohms per cm2) |
|---|---|---|---|---|---|---|
| 0.8 | 1.00 × 10⁻² | 2.93 × 10⁵ | 1.40 × 10⁻¹⁰ | 1.67 × 10⁴ | 1.41 × 10⁻⁷ | 2.6 × 10⁻⁶ |
| 1.0 | 1.62 × 10⁻² | 8.19 × 10⁵ | 1.33 × 10⁻¹⁰ | 1.14 × 10⁵ | 9.74 × 10⁻¹⁰ | |
| 1.2 | 1.00 × 10⁻² | 8.13 × 10⁶ | 1.28 × 10⁻¹⁰ | 1.79 × 10⁹ | 2.35 × 10⁻¹¹ | |
| 1.4 | 1.01 × 10⁻² | 1.19 × 10⁸ | 1.20 × 10⁻¹⁰ | 7.30 × 10¹⁰ | 8.31 × 10⁻¹¹ |
Morphologies of the surface of the coatings are shown in Fig. 5. The figures clearly showed that there was no difference between coatings with different NCO/OH ratios before immersion. While, after 50 days immersion, many scratches appeared on the coating with NCO/OH = 0.8 and NCO/OH = 1.0, destruction and decomposition occurred. On the contrary, the coating with NCO/OH = 1.4 appeared a few scratches, and there was no obvious degradation. As showed in Fig. 6, the coatings with lower NCO/OH ratios corroded seriously. The coating with NCO = 1.4 just appeared little delamination after 50 days immersion. It was consistent with the above impedance characterization results.
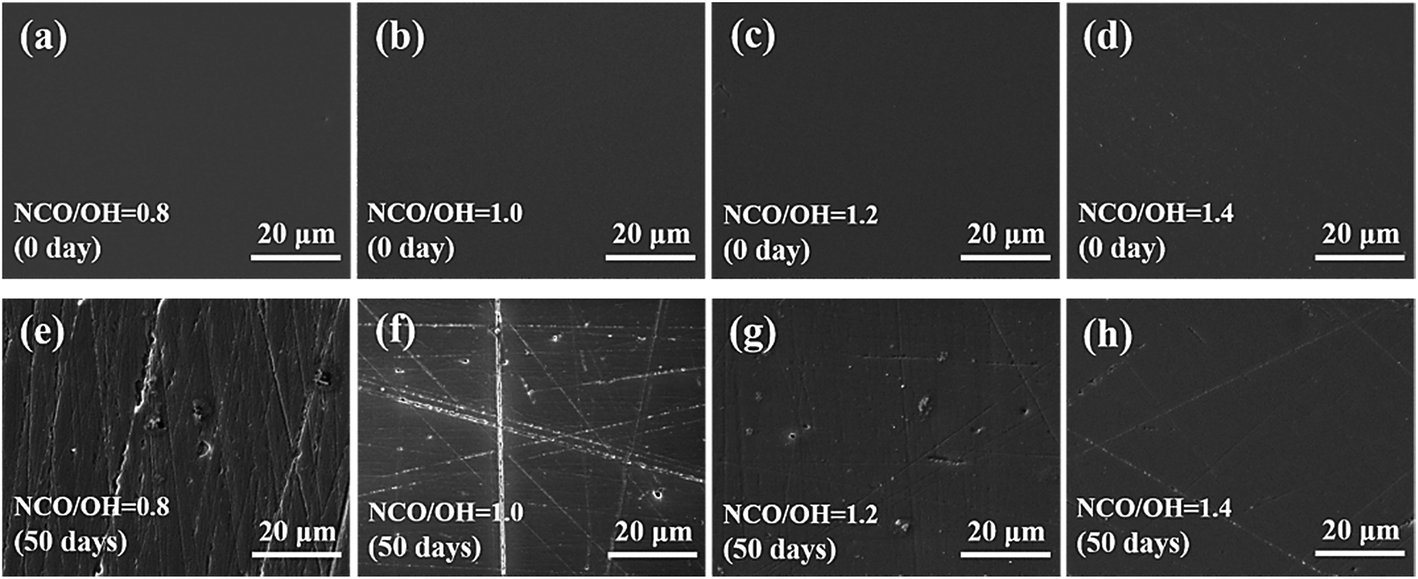 | ||
| Fig. 5 SEM images of surface of the coating with (a) NCO/OH = 0.8 before immersion; (b) NCO/OH = 1.0 before immersion; (c) NCO/OH = 1.2 before immersion; (d) NCO/OH = 1.4 before immersion; (e) NCO/OH = 0.8 for 50 days immersion; (f) NCO/OH = 1.0 for 50 days immersion; (g) NCO/OH = 1.2 for 50 days immersion and (h) NCO/OH = 1.4 for 50 days immersion. | ||
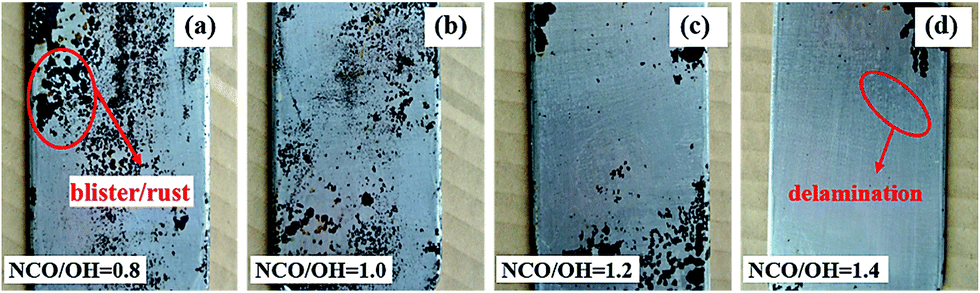 | ||
| Fig. 6 Photographs of specimens exposed in 3.5 wt% NaCl solution at 50 °C after 50 days. | ||
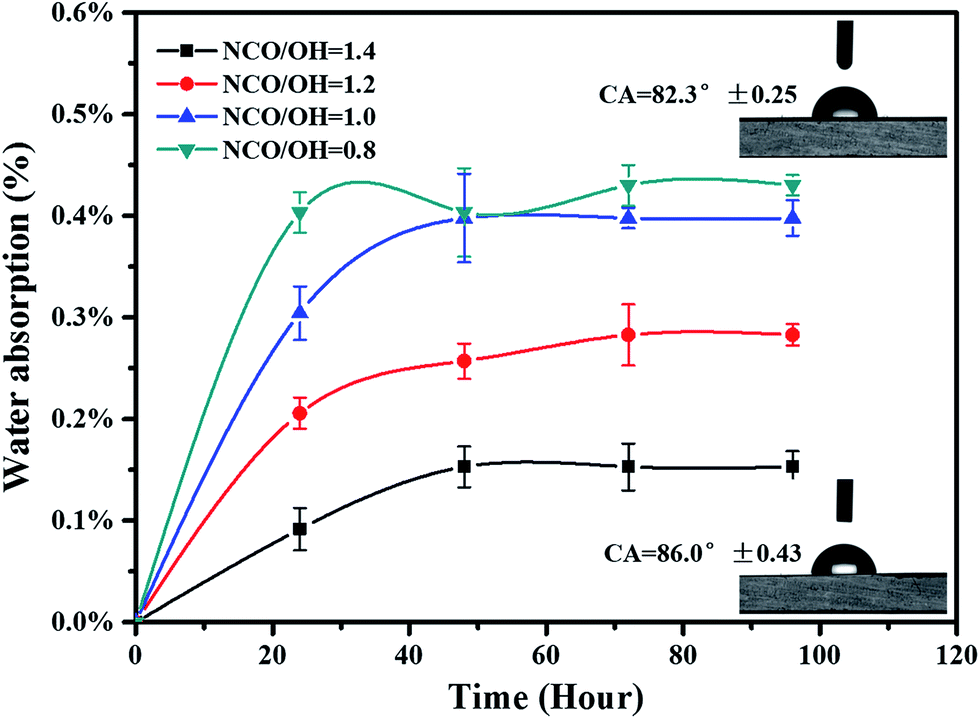
Water absorption of coatings was characterized by gravimetric method. As shown in Fig. 7, the water absorption of all the coatings was less than 0.45 wt%, and decreased with increase of the NCO/OH ratios. The water absorption is only 0.15% wt% when the NCO/OH value was 1.4, which showed the coating film has good water resistance. However, when the NCO/OH ratio was lower than the stoichiometric ratio, polymers had excrescent hydroxyl groups. Thus, water molecules permeated into the coatings more easily. Wettability of coatings was also characterized auxiliarily by contact angle measurement. It was found that the static contact angles of the coating with NCO/OH = 0.8 and NCO/OH = 1.4 were 82.3° and 86.0° respectively. The former possessed better hydrophilicity, because the more the content of hydroxyl acrylic resin, the better hydrophilic of the coatings.
 | ||
| Fig. 7 Water absorption rate and wettability of coatings. | ||
FTIR-ATR was also used to analyze the structure of the coatings (as showed in Fig. 8). There is a very weak wide peak at 3506 cm−1, it represents the absorption peak of O–H. The peak at 3376 cm−1 represents the stretching vibration absorption of N–H. The peaks at 2863 cm−1 and 2933 cm−1 are attributed to the stretching vibration absorption of C–H. Especially, the peak at 2350 attributed to the stretching vibration absorption of –NCO, explaining unreacted NCO groups in coatings with NCO/OH = 1.2 or 1.4. In general, hydrogen bonded carbonyl groups appear at low frequency range compared with free carbonyl band.33,34 The peak at 1682 cm−1 and the peak at 1723 cm−1 are attributed to the hydrogen bonded carbonyl group (C![[double bond, length as m-dash]](https://www.rsc.org/images/entities/char_e001.gif) O) and the stretching vibration absorption of free carbonyl group (CO) respectively. Results show that there are a few unreacted NCO groups on the coating with NCO/OH = 1.4, and there are several unreacted OH groups on the coating with NCO/OH = 0.8. These results explain the difference of water resistance and corrosion resistance of coating with varied NCO/OH ratios.
O) and the stretching vibration absorption of free carbonyl group (CO) respectively. Results show that there are a few unreacted NCO groups on the coating with NCO/OH = 1.4, and there are several unreacted OH groups on the coating with NCO/OH = 0.8. These results explain the difference of water resistance and corrosion resistance of coating with varied NCO/OH ratios.
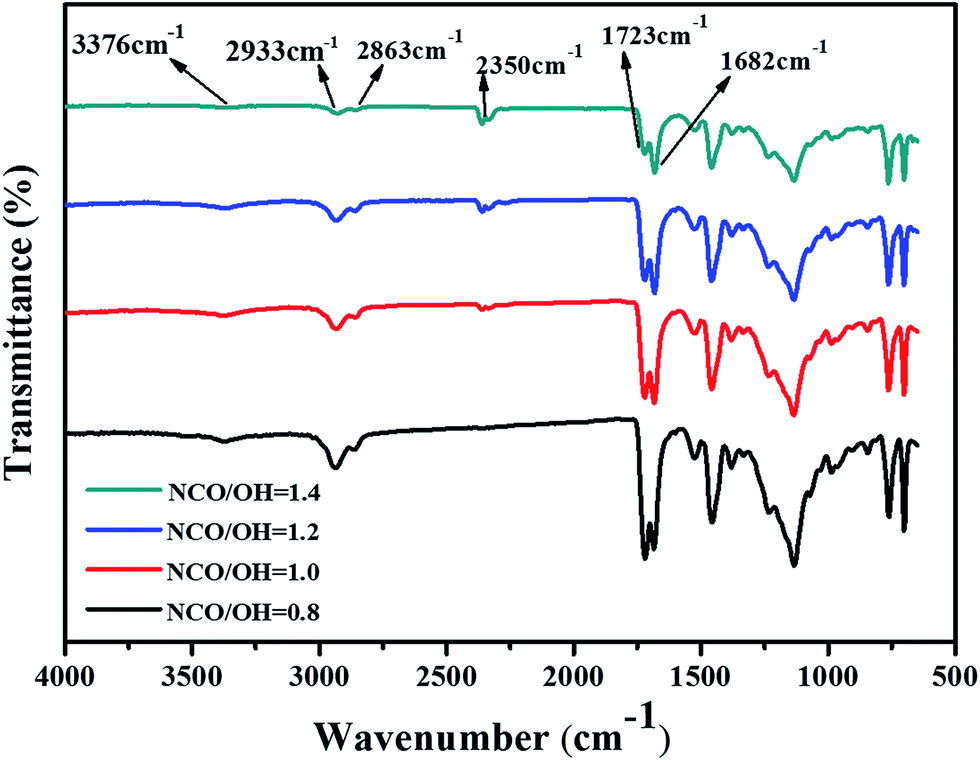 | ||
| Fig. 8 ATR-FTIR spectra of different NCO/OH ratios acrylic polyurethane coating in the range 650–4000 cm−1. | ||
Adhesion measurements were also performed, and each sample was measured at five points. The average values were plotted in Fig. 9(a). It can be seen from the figure that, the adhesion strength of the coating slightly improved with the increase of NCO/OH ratios. However, it was found that range of the error bars was very large. In order to further illustrate this phenomenon, the pictures of adhesion test were placed in Fig. 9(b). Generally, when all paint film is pulled off, the adhesion strength of the coatings is accurate. But, under certain conditions, there were some adhesives cracked internally and dollies not pulled off from the specimen, because the adhesion strength was beyond the using upper limit of the adhesive or machine. These phenomena indicated that the actual adhesion strength is usually larger than that of the test value. Fig. 9(b) the adhesion strength is getting high with that of NCO/OH ratios. Therefore, raising the NCO/OH ratios is helpful to enhance adhesion strength, which resulted from interaction force between urethane and urea of the coatings with hydrogen atoms of the substrate.
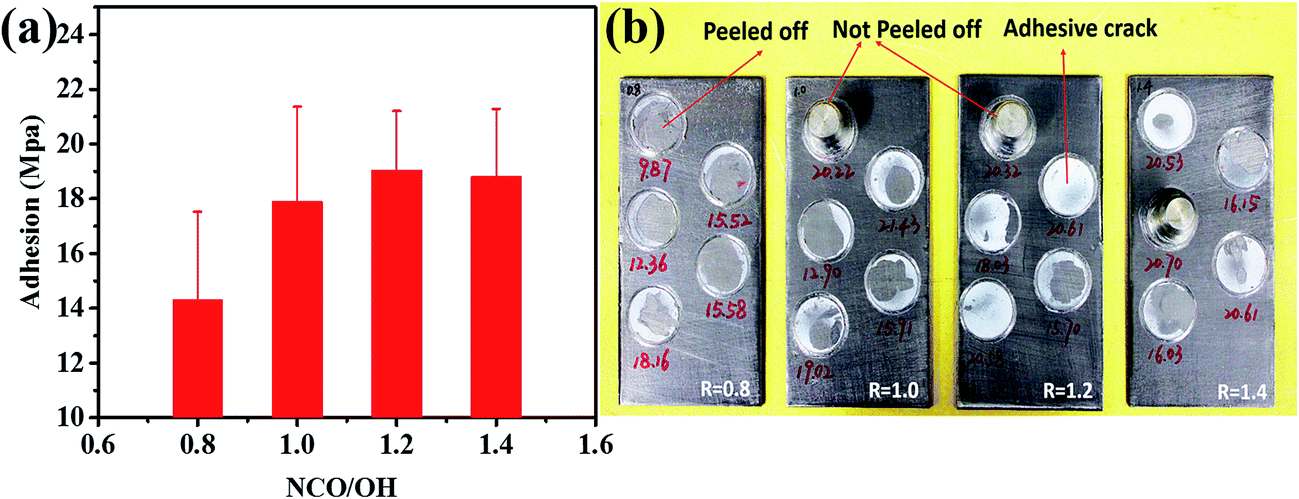 | ||
| Fig. 9 (a) Pull-off adhesion results of acrylic polyurethane coatings (b) specific areas of pull-off adhesion measurement. | ||
4. Conclusions
Acrylic polyurethane coatings with different NCO/OH ratios were prepared and characterized. Coating degradation was test in 3.5 wt% NaCl solution and the EIS measurement results revealed that the coating with NCO/OH = 1.4 could protect the mild steel from corrosion effectively, which is attributed to formation a dense three-dimensional structure under the condition of excess curing agents exists. We can see from the morphology of the surface that, the coating with NCO/OH = 1.2 or NCO/OH = 1.4 still possessed good scratch resistance and hydrolysis resistance after 50 days immersion, which contributes to prolonging the life of coating drastically. Acrylic polyurethane coatings with high NCO/OH ratios have more urethane groups than coatings with the low NCO/OH ratios measured by ATR-FTIR, resulting in better water resistance and adhesion strength. Most of the paint distributors do not give advice or only recommend the ratio of curing agent to resin is 1.0–1.05. However, through experiments, we found that coatings with more proportion of urethane linkage have better mechanical properties and corrosion resistance. Thus, it is meaningful to improve the NCO/OH ratios in a certain range under the consideration of excellent protection performance.Acknowledgements
This work was supported by National High Technology Research and Development Program (2012AA03A611), the Public Science and Technology Research Funds Projects of Ocean (no. 201405013-5), National Natural Science Foundation of China (20836006).References
- H. W. Engels, H. G. Pirkl, R. Albers, R. W. Albach, J. Krause, A. Hoffmann, H. Casselmann and J. Dormish, Angew. Chem., Int. Ed., 2013, 52, 9422–9441 CrossRef CAS PubMed.
- D. K. Chattopadhyay and K. V. S. N. Raju, Prog. Polym. Sci., 2007, 32, 352–418 CrossRef CAS.
- C. W. Phetphaisit, J. Namahoot, K. Saengkiettiyut, J. Ruamcharoen and P. Ruamcharoen, Prog. Org. Coat., 2015, 86, 181–189 CrossRef CAS.
- S. M. Mirabedini, M. Sabzi, J. Zohuriaan-Mehr, M. Atai and M. Behzadnasab, Appl. Surf. Sci., 2011, 257, 4196–4203 CrossRef CAS.
- J. H. Li, R. Y. Hong, M. Y. Li, H. Z. Li, Y. Zheng and J. Ding, Prog. Org. Coat., 2009, 64, 504–509 CrossRef CAS.
- V. V. Gite, P. P. Mahulikar and D. G. Hundiwale, Prog. Org. Coat., 2010, 68, 307–312 CrossRef CAS.
- M. Song and D. Cai, In Situ Synthesis of Polymer Nanocomposites, 2011, pp. 169–220 Search PubMed.
- G. Wang, K. Li, W. Zou, A. Hu, C. Hu, Y. Zhu, C. Chen, G. Guo, A. Yang, R. Drumright and J. Argyropoulos, Prog. Org. Coat., 2015, 78, 225–233 CrossRef CAS.
- Y. Zhu, J. Xiong, Y. Tang and Y. Zuo, Prog. Org. Coat., 2010, 69, 7–11 CrossRef CAS.
- C. H. Hare, J. Prot. Coat. Linings, 2000, 17, 34–44 Search PubMed.
- C. Jin, J. Lu, W. S. Li, L. Zhou, Q. M. Huang and X. H. Yang, J. Appl. Polym. Sci., 2006, 102, 4958–4962 CrossRef CAS.
- M. Melchiors, M. Sonntag, C. Kobusch and E. Jürgens, Prog. Org. Coat., 2000, 40, 99–109 CrossRef CAS.
- W. Nierzwicki, J. Appl. Polym. Sci., 1985, 30, 761–768 CrossRef CAS.
- V. Lavaert, M. Moors and E. Wettinck, J. Appl. Electrochem., 2002, 32, 853–857 CrossRef CAS.
- H. C. Yu, B. Z. Chen, X. C. Shi, H. Y. Wu and B. Li, J. Appl. Electrochem., 2008, 39, 303–309 CrossRef.
- F. Mansfeld, J. Appl. Electrochem., 1995, 25, 187–202 Search PubMed.
- N. Buenfeld and J.-Z. Zhang, J. Mater. Sci., 2000, 35, 39–44 CrossRef CAS.
- D. Chu, J. Wang, Y. Han, Q. Ma and Z. Wang, RSC Adv., 2015, 5, 11378–11384 RSC.
- N. Coniglio, K. Nguyen, R. Kurji and E. Gamboa, Prog. Org. Coat., 2013, 76, 1168–1177 CrossRef CAS.
- Q.-A. Huang, R. Hui, B. Wang and J. Zhang, Electrochim. Acta, 2007, 52, 8144–8164 CrossRef CAS.
- M. Moradi, H. Yeganeh and S. Pazokifard, RSC Adv., 2016, 6, 28089–28102 RSC.
- M. Nematollahi, M. Heidarian, M. Peikari, S. Kassiriha, N. Arianpouya and M. Esmaeilpour, Corros. Sci., 2010, 52, 1809–1817 CrossRef CAS.
- Y. González-García, S. González and R. M. Souto, Corros. Sci., 2007, 49, 3514–3526 CrossRef.
- C. Lee and F. Mansfeld, Corros. Sci., 1998, 41, 439–461 CrossRef.
- J. R. Scully, J. Electrochem. Soc., 1989, 136, 979–990 CrossRef CAS.
- E. Akbarinezhad, M. Ebrahimi and H. R. Faridi, Prog. Org. Coat., 2009, 64, 361–364 CrossRef CAS.
- I. C. Margarit and O. R. Mattos, Electrochim. Acta, 1998, 44, 363–371 CrossRef CAS.
- A. Magalhães, I. Margarit and O. Mattos, Electrochim. Acta, 1999, 44, 4281–4287 CrossRef.
- F. Chen and P. Liu, ACS Appl. Mater. Interfaces, 2011, 3, 2694–2702 CAS.
- X. Guo, K. Du, Y. Wang, Y. Shao and F. Wang, Surf. Coat. Technol., 2012, 206, 4833–4839 CrossRef CAS.
- H. Wei, D. Ding, S. Wei and Z. Guo, J. Mater. Chem. A, 2013, 1, 10805 CAS.
- G. Walter, Corros. Sci., 1991, 32, 1041–1058 CrossRef CAS.
- A. K. Mishra, D. K. Chattopadhyay, B. Sreedhar and K. V. S. N. Raju, Prog. Org. Coat., 2006, 55, 231–243 CrossRef CAS.
- D. Varnell, J. Runt and M. Coleman, Macromolecules, 1981, 14, 1350–1356 CrossRef CAS.
| This journal is © The Royal Society of Chemistry 2017 |