 Open Access Article
Creative Commons Attribution 3.0 Unported Licence
Porous 3D carbon decorated Fe3O4 nanocomposite electrode for highly symmetrical supercapacitor performance†
You Sing Lim ,
Chin Wei Lai
 * and
Sharifah Bee Abd Hamid
Nanotechnology & Catalysis Research Centre (NANOCAT), University of Malaya (UM), Level 3, IPS Building, 50603 Kuala Lumpur, Malaysia. E-mail: cwlai@um.edu.my; Tel: +603-79676960
First published on 26th April 2017
Abstract
In the present study, a hierarchical nanostructure of Fe3O4-porous hydrochar (p-Fe/HC) core shell nanocomposite was readily synthesized via a facile hydrothermal carbonization route followed by a KOH activation. In our new invention, hydrothermally formed core–shell nanoparticles underwent KOH activation to create micro- and mesopores forming porous hydrochar outer-shell on Fe3O4 nanoparticles core for improving capacitance performance. These porous structures eventually could act as potential electrolyte-accessible pathways which led to the contribution of pseudocapacitance connecting from the core (reaction at Fe3O4/electrolyte interface). Based on our electrochemical capacitive performance evaluation, p-Fe/HC nanocomposite electrode which comprised of 5 wt% Fe3O4 nanoparticles (±45 nm) could reach the specific capacitance of 259.3 F g−1 with a superior wide potential window of 1.8 V in 1 mol L−1 Na2SO4 aqueous electrolyte. By comparing KOH activation of pristine porous hydrochar and p-Fe/HC, an exceptionally high specific surface area (1712.8 m2 g−1) with bimodal type pores size distribution was observed. In addition, p-Fe/HC displayed a maximum energy density of 29.2 W h kg−1 at a power density of 1.2 kW kg−1, which is about 26% higher energy density than that of pristine porous hydrochar. In this manner, the synthesized porous hydrochar outer-shell could provide additional electrochemical stability to Fe3O4 core, preventing volume change at high current loading as well as conductive coating to enhance pseudocapacitance performance. Consequently, a symmetrical nanocomposite cell was successfully designed, with high capacitance retention of 95.1% after 5000 cycles.
Introduction
Supercapacitor has emerged as one of the favorable and promising energy storage devices owing to its versatility, energy efficiency and scalable technology for rapid energy storage and delivery. Demands for supercapacitors continue to increase as they have extensive applications, including digital communications equipment, portable electronic devices, hybrid electronic vehicles as well as renewable energy systems. The extensive applications are possible owing to theirs high power density,1,2 fast charging–discharging capability,2 a wide range of operating temperature, being environmentally friendly and having an excellent long life cycle (>10![[thin space (1/6-em)]](https://www.rsc.org/images/entities/char_2009.gif) 000 cycles).3–5
000 cycles).3–5
The interesting part of the supercapacitor is that it is distinctively different from the traditional capacitor where its electrodes comprise of high surface area of conductive materials with a uniformed distribution of pore structure and surface morphology, such as hierarchical carbonaceous materials (activated carbon, carbon nanotubes, carbide-derived carbons, and graphene, etc.).6 The development of cost effective electrode material becomes a major concern in the selection of materials. Thus, low cost activated carbon is the most commonly used and studied carbon materials in the commercial industry. Despite being a cost effective material, activated carbon based electrodes also exhibit excellent electrochemical performance, with a long lifespan and cyclability.2,5 Apart from that, it has a remarkable electrochemical stability which is attributed to high electronic conductivity and specific surface area.2 Assembled carbon based electrodes continuously accumulate the charges on the thin layer of the electrode/electrolyte interface via the electrostatic force or non-faradic effect.3 Nevertheless, the energy density of the carbon-based supercapacitors is still limited (<10 W h kg−1) compared to their battery counterparts. To overcome the problem, various research efforts such as modifying the structural properties and incorporating metal oxide into carbon matrix have been conducted to increase the gravimetric energy density as well as maintain their high power density and long life cycle.
It is important to increase the specific capacitance (Cs), operating potential window (V) and also reduce equivalent series resistance (ESR) of the electrode materials in favor of high energy density and power density.7 In addition to increasing energy density of a supercapacitor through the use of pseudocapacitive materials, the incorporation of cost-effective materials, as well as an environmentally friendly method, should be taken into consideration. Iron oxides have increasingly become the leading candidate with high theoretical capacity (ca. 926 mA h g−1),7,8 low costs, non-toxicity9 and among the most abundant metal oxides on earth. Iron oxides are notable with numerous crystal structures and multiple combinations of chemical compounds. The unique characteristics of various iron oxide species, which are useful in many applications as catalysts, pigments,10 magnetic recorder10 and biomedical applications.11 Among the iron oxides family, Fe3O4 have emerged as the leading candidate as efficient electrodes because of their high stability in the general environment.12
Recently, Fe3O4 has attracted the increasing interest of researchers in energy conversion and storage application, which include battery electrodes,8 supercapacitor electrodes,13–15 and catalyst16 for photochemical conversion because Fe3O4 nanoparticles have a large surface area, good electrochemical properties, and offered potentially high pseudo-capacitance through redox reaction. Notwithstanding its high theoretical capacity, Fe3O4 cannot directly apply as supercapacitors electrode owing to low electrical conductivity among micro- and nanostructures, limiting fast electron transport required by high rate application. Fe3O4 electrodes also vulnerable to side reactions during the repeated charge–discharge cycling resulted in particle disintegration. As an alternative, porous carbon outer-shell has been introduced to provide additional protection onto oxide to prevent particle aggregation.17 It has been reported that the negatively charged carbon outer-shell formed a strong electrostatic interaction with the positively charged Fe3O4 nanoparticles, forming nanocomposite with reduced charge transfer resistance and strengthens the electrochemical stability of Fe3O4 as well as provided a fast electron transfer pathway, specifically in supercapacitor applications.12 In the past few years, several reports on various Fe3O4/C composite have been used as supercapacitor electrode material such as Fe3O4/carbon nanotube (CNT),18 Fe3O4/carbon nanosheets (CNS),19 Fe3O4/graphene (Gr),20 and Fe3O4/activated carbon (AC).21–23 Preparation of carbon/Fe3O4 composite often involves either direct mixing of Fe3O4 onto the activated carbon or wet impregnation of iron salts21,23 onto the activated carbon, followed by thermal or chemical reduction to form Fe3O4/activated carbon composite. However, the formation of Fe3O4 particles is often associated with a reduction of composite surface area. This is due to the fact that Fe3O4 particles are formed within/in the open pores of activated carbon, and thus blockage of the pores occurred. Higher loading of Fe3O4 will lead to the increase in a number of blockages, resulting in a decrease of the final surface area. Khiew21 and his co-workers22 suggested that the contribution of pseudocapacitance charge storage of Fe3O4 nanomaterials at low concentration can improve the overall capacitive performance. They reported that if the optimum threshold of Fe3O4 loading has exceeded, the capacitive performance of the composite electrode starts to deteriorate, as a result of undesired particle aggregation. Reported composite materials and electrochemical performance results are summarized in Table 1 (ESI†).
In previous work, we have successfully prepared Fe3O4/hydrochar (Fe/HC) nanocomposite materials derived from hydrothermal carbonization (HTC) method.24 The Fe/HC materials was applied in the preparation of porous nanocomposite materials. This nanocomposite supercapacitor can utilize both faradic (pseudocapacitance) and non-faradic (EDLC) processes to store charge, achieving high energy and power density while maintaining good cycling stability. HTC method is a novel method used to synthesize the desired hydrochar outer-shell. The synthesized hydrochar shows homogenous spherical particles and rich in oxygen functional group25 is excellent to form core–shell composite with Fe3O4 embedded. The embedded Fe3O4 nanoparticles are protected in hydrochar matrix which prevented from phase transformation during surface modification through KOH activation.26 A considerable amount of micro- and mesopores volume is created at the external surface of the hydrochar, forming high specific surface area porous outer-shell. Chemical activation of the hydrochar using KOH as the activating agent is very promising because it requires a lower activation temperature and achieves higher yields as well as well-defined micro- and meso pore size distribution and volume.27 Therefore, the aim of the present study is to report a hybrid nanocomposite consisting both 5 wt% Fe3O4 core nanoparticles and high porosity hydrochar shell synthesized using hydrothermal carbonization method to improve the specific capacitance and energy density of supercapacitor application. The composite materials of Fe/HC were characterized, and their electrochemical performances were investigated using CV (cyclic voltammetry) and EIS (electrochemical impedance spectroscopy) analysis. Fe/HC nanocomposite underwent surface modification to form porous Fe/HC (p-Fe/HC) nanocomposite. Electrochemical performance of the p-Fe/HC nanocomposite was investigated using CV, EIS and galvanostatic charge–discharge analysis. Specific capacitance and cyclability were also analyzed. The specific capacitance and energy density of porous nanocomposite had significantly improved compared with pristine porous hydrochar.
Experimental procedure
All the chemical reagents in this work were of analytical grade purity. Fe3O4 nanoparticles were synthesized using co-precipitation method as described in our previous work.28 The preparation processes of the Fe/HC nanocomposite included a hydrothermal carbonization reaction24 and a chemical activation process. Glucose was used as a carbon source to form hydrochar outer-shell coating on Fe3O4 nanoparticles. Sufficient amount (5 wt%) of Fe3O4 nanoparticles were dispersed into a solution containing 5 g of glucose in 50 mL DI water under stirring condition. The prepared suspension was transferred to a Teflon-lined stainless steel autoclave (100 mL) heated to 180 °C and held for 6 hours. The nanocomposite product was repeatedly washed and filtered using 95% alcohol and de-ionized water to remove the reactions of the by-products. The final products were dried at 50 °C and sent for characterization and electrochemical testing. In order to create a p-Fe/HC nanocomposite with a high specific surface area, the as-formed nanocomposite was impregnated in 20% KOH with a weight ratio of 1![[thin space (1/6-em)]](https://www.rsc.org/images/entities/char_2009.gif) :
:![[thin space (1/6-em)]](https://www.rsc.org/images/entities/char_2009.gif) 4 (HC
4 (HC![[thin space (1/6-em)]](https://www.rsc.org/images/entities/char_2009.gif) :
:![[thin space (1/6-em)]](https://www.rsc.org/images/entities/char_2009.gif) KOH) for 12 hours. The impregnated nanocomposites were then activated in at 650 °C for 2 hours under Ar atmosphere.
KOH) for 12 hours. The impregnated nanocomposites were then activated in at 650 °C for 2 hours under Ar atmosphere.
Physical characterization of Fe/HC nanocomposite was performed by a field emission scanning electron microscope (FESEM) (Zeiss SUPRA 35VP) which is a high-resolution transmittance electron microscope (HRTEM) to investigate surface morphology and particle size. X-ray diffraction (XRD, Philips PW 1729) with Cu Kα radiation sources of 40 kV in the 2θ range of 15° to 75° was used to determine crystallinity and the phase of compounds in the samples. The presence of oxygen functional group and Fe–O bonding was determined using the Fourier transform infrared spectroscopy (FT-IR) scanning from 400 to 2000 cm−1 region. The thermogravimetric analyzer was used to investigate thermal stability and weight loss of samples under a wide range of heating (30–900 °C). Energy dispersive X-ray spectroscopy (EDX) was used to do elemental mapping and composition detection. Finally, Brunauer–Emmett–Teller (BET) was used to investigate the surface area and pore size distribution of p-Fe/HC nanocomposite was determined by using Barret–Joyner–Halenda (BJH) model. The chemistries of p-Fe/HC nanocomposite in powder form was determined by X-ray photoelectron spectroscopy (XPS). The depth profiling measurement were carried out on a scanning X-ray microprobe PHI Quantera II (Ulvac-PHI, INC.) using a monochromatic Al-Kα (hν = 1486.6 eV) X-ray source that operated at 25.1 W (beam diameter of 100 μm) under chamber base pressure of 3 × 10⁻⁷ Pa. Wide scan analysis was examined using a pass energy of 280 eV.
Electrochemical measurement of both p-HC and p-Fe/HC nanocomposite were carried out on an electrochemical workstation (Metrohm Autolab PGSTAT M204, Netherland) at room ambient, using two electrodes configurations. Working electrodes were prepared from the final products before conducting the electrochemical testing in 1 mol L−1 Na2SO4. The working electrode was prepared by mixing 80 wt% of the prepared nanocomposite materials, 10 wt% of acetylene black, and 10 wt% of polytetrafluoroethylene (PTFE) as a binder in the presence of absolute ethanol to form a viscous slurry. The slurry paste was coated onto a nickel foam with a square of 1 cm × 1 cm active area and pressed under constant pressure (5 MPa). The prepared electrode was then dried at 50 °C under vacuum overnight. Next, the symmetric device of p-Fe/HC nanocomposite electrode was assembled such that the two electrodes were separated by a 0.18 μm thickness microfiber glass filter paper. The capacitive performance was evaluated using cyclic voltammetry (CV), galvanostatic charge–discharge (GCD) and electrochemical impedance spectroscopy (EIS). The CV and GCD measurements for the assembled devices were conducted in a potential window ranging from 0 to 2 V at different scan rates (5, 10, 50, 100, 150 and 200 mV s−1) and current densities (0.5, 1.0, 2.0, 3.0, 4.0 and 5.0 A g−1). The EIS analysis was recorded in a frequency range from 100 kHz to 10 mHz with an open circuit potential using a sinusoidal signal of 5 mV. The gravimetric capacitance for the single electrode was calculated according to the eqn (1) and (2):29,30
Specific capacitance obtained from CV curve,
 | (1) |
Specific capacitance obtained from GCD curve,
 | (2) |
 | (3) |
 | (4) |
The coulombic efficiency or current efficiency of the electrodes is calculated from the charge–discharge curve using the following eqn (5).
 | (5) |
Results and discussion
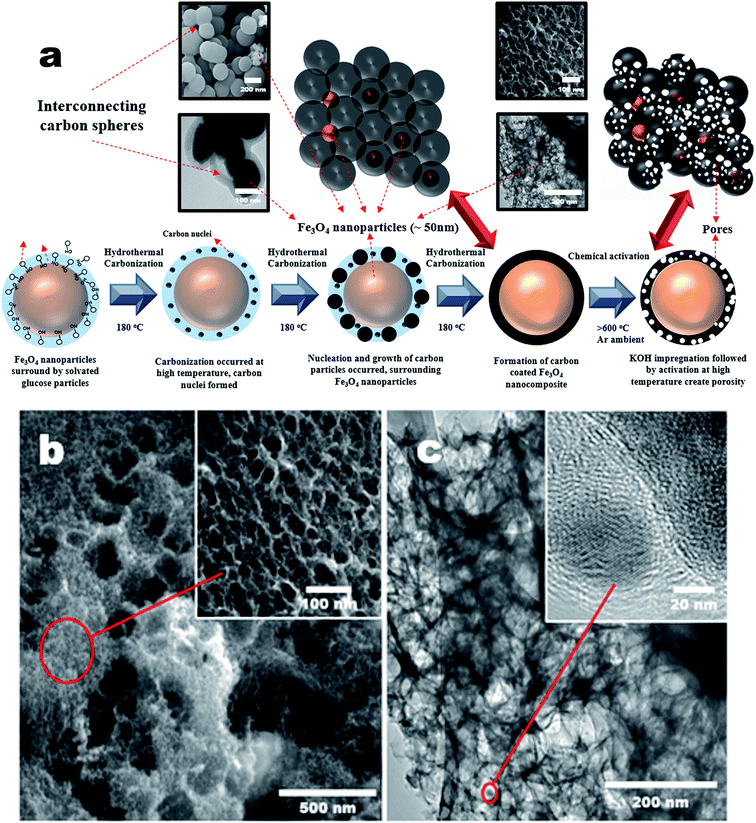
Porous carbons with well-controlled pores size distribution and a high specific surface area with micro- and mesopores are needed for advanced supercapacitors to improve their volumetric and gravimetric energy storage characteristics. In this work, chemical activation was carried out on the p-Fe/HC nanocomposite to create porous structure specifically on the hydrochar outer shell. In this case, KOH was chosen as an activating agent because it has the ability to induce a well-defined micro- and mesopores during pores formation. It is a well-known fact that development of pores structure mainly attributed to the gasification of carbon matrix by the intercalation of metallic potassium ions into carbon network at high temperature.3 During the activation, potassium containing compound such as K2O or K2CO3 were formed in the presence of oxygen on carbon matrix. The reduction of potassium containing compound by carbon matrix was occurred resulting in liberation of carbon. The CO2 gas further react with carbon matrix to create open pores and enlarge existing micropore.32 Chemical activation (KOH) is more energy efficient as compared to a physical activation (CO2 gas) method because chemical activation can be established at a lower activation temperature (400–700 °C), provided high yields in carbon products as well as generated a considerable amount of micropores.27 Fig. 1(a) shows transformation steps from Fe/HC nanoparticles into p-Fe/HC nanocomposite using HTC and chemical activation techniques. The interconnected Fe/HC spherical particles for KOH activation showed the diameter size in the range between 200–400 nm. Fig. 1(b) and (c) show the FESEM and HRTEM images of p-Fe/HYC formed after KOH activation. It can be observed that porous p-Fe/HC nanocomposite displays uniform mesopores with an average diameter of <50 nm. The magnified HRTEM images illustrate that the Fe3O4 nanoparticles are embedded within the porous outer-shell with distinguished lattice spacing of 2.53 Å.Additional EDX characterization was conducted in order to obtain element maps of the p-Fe/HC nanocomposite. Fig. 2 shows the scanned low magnification SEM image and corresponding carbon and iron elemental mapping. Fig. 2(a) depicts the overlay maps of both carbon and iron elements. The carbon map (Fig. 2(b)) depicts the carbon as the background element whereas the iron map is distributed evenly around the porous carbon. The overlaid map directly visualizes the presence of Fe3O4 nanoparticles within the porous carbon. By comparing both the element maps (Fig. 2 (b) and (c)), it can be concluded that Fe3O4 nanoparticles are distributed evenly within the pores of the carbon.
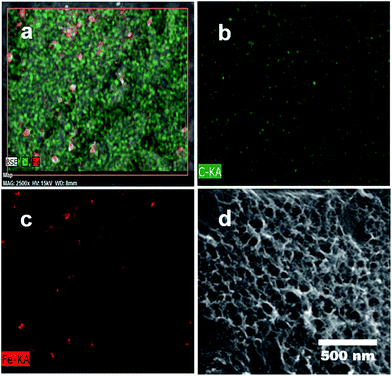 | ||
| Fig. 2 EDX elemental scanning and mapping: (a) overlay maps of Fe/C elements, (b) C distribution map and (c) Fe distribution map and (d) SEM image of mapping area. | ||
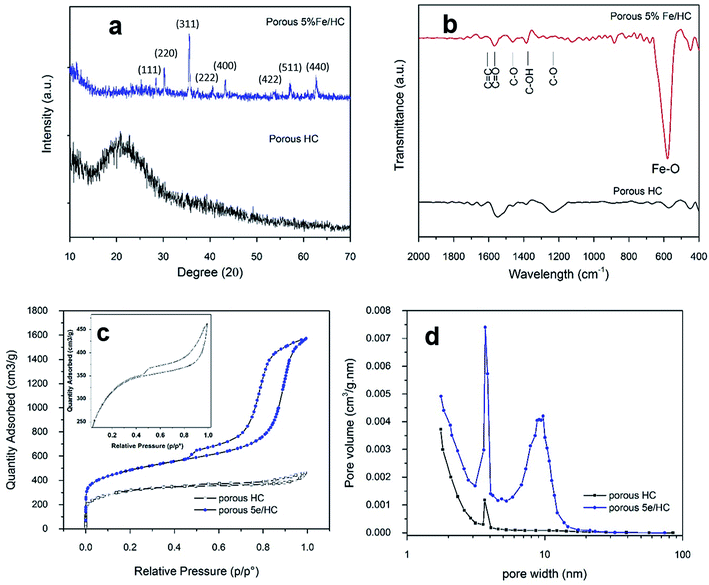
The presence of the crystal phase and residue functional group of porous HC (p-HC) and p-Fe/HC nanocomposite are confirmed by the XRD and FTIR characterizations. The observed XRD pattern for a HC sample was broad and absences of others prominent peaks. The observed diffraction peak at around 2θ = 25° was indexed to the diffraction of the highly defect (002) carbon interlayer packing in graphite structure. As showed in Fig. 3(a), resolved diffraction peaks in p-Fe/HC composites were corresponding to Fe3O4 magnetite phase with JCPDS card no. 01-089-0691. These diffraction peaks at 2θ ≈ 18°, 30°, 35°, 37°, 43°, 54°, 57°, 63°, 71° and 74° were attributed (111), (220), (311), (222), (400), (422), (511), (440), (620) and (622) planes which referred to a theoretical face-centered cubic spinel structures of magnetite phase. The average size of the Fe3O4 nanoparticles loaded into the HC, calculated by Scherrer formula, was estimated to be approximately 45 nm which was verified by HRTEM results. The increasing Fe3O4 content in the synthesized composite was in agreement with increasing peak intensity of (311) plane. FT-IR spectra were used to further investigate the structural nature and functionalities of composite products. Fig. 3(b) depicts the FT-IR spectrum located at 560 cm−1 was attributed to the stretching vibration of Fe–O in Fe3O4. It can be observed that a vibration band around 1100 cm−1 was corresponding to vibration stretching of C–O and C–OH while another two bands around 1409 and 1505 cm−1 are assigned to the asymmetry stretching vibration of COO–. The vibration bands at around 1650 and 1780 cm−1 also attributed to aromatic compound and the dominating olefinic C![[double bond, length as m-dash]](https://www.rsc.org/images/entities/char_e001.gif) C bonds in both cyclic structures and side chains. All of these peaks disclose that surface of p-Fe/HC composite still contained a considerate amount of functional groups, such as C–OH, C–O, and C–OO– group, which were residue of incomplete removal of oxide at a lower activation temperature. Pore size distribution and specific surface area play a vital role in the presenting of the presence of mechanical, thermal and chemical properties of the porous materials and their utility for the electrodes. Generally, the electrochemical performance of the electrode materials is determined by its generally determined by its electrolyte-accessible SSA and pore size distribution the BET SSA and pore volume of electrode materials.
C bonds in both cyclic structures and side chains. All of these peaks disclose that surface of p-Fe/HC composite still contained a considerate amount of functional groups, such as C–OH, C–O, and C–OO– group, which were residue of incomplete removal of oxide at a lower activation temperature. Pore size distribution and specific surface area play a vital role in the presenting of the presence of mechanical, thermal and chemical properties of the porous materials and their utility for the electrodes. Generally, the electrochemical performance of the electrode materials is determined by its generally determined by its electrolyte-accessible SSA and pore size distribution the BET SSA and pore volume of electrode materials.
Direct information about the specific surface area and pore size distribution of the sample is obtained through a standard nitrogen adsorption in Brunauer–Emmett–Teller (BET) analysis. The nitrogen adsorption–desorption isotherms is shown in Fig. 3(c) with the BET results in Table 2 (ESI†). The BET isotherm show a cross-curves between type I and type-IV isotherm with a H1-type hysteresis loop, corresponding to the micro- and mesoporous structure. The corresponding pore-size distribution curves, which can be calculated from the adsorption branches of the isotherm using the Barrett–Joyner–Halenda (BJH) method are shown in Fig. 3(d). The p-HC product exhibit unimodal type pore side distribution with max peak centered at 3.85 nm. Compare to p-Fe/HC, p-HC shows a narrow pore size distribution which indicated uniform micro- and mesopores created at the surface of hydrochar sphere-like particles. Pore size distribution of the p-Fe/HC nanocomposite is mainly within the range of 2–20 nm and presents a bimodal-type pore size distribution with the maximum peaks centered at 3.72 nm and 9.65 nm, which incidentally are the optimal pore size for the diffusion of ions and the transition of electrons within an active electrode materials.33,34 A secondary pore size was attributed to the association of Fe3O4 nanoparticles which evidenced the occurrence of open pores hydrochar shell. The micropore area of porous 5% Fe/HC nanocomposite is 602.65 m2 g−1 suggesting that the p-Fe/HC nanocomposite consists of a mixture of meso- and micro pores with a ratio of 2![[thin space (1/6-em)]](https://www.rsc.org/images/entities/char_2009.gif) :
:![[thin space (1/6-em)]](https://www.rsc.org/images/entities/char_2009.gif) 1. The increasing surface area and narrow pore size distribution is beneficial to the charge storage by providing the maximum possible number of electrolyte accessible active sites for electrochemical reactions.3,35 Furthermore, the narrow pore size distribution leads to high adsorbate accessibility and providing a wide range of transport channels to available micropores.3 The textural properties resulted from the p-HC, and porous 5% Fe/HC nanocomposite are listed in Table 2 (ESI†).
1. The increasing surface area and narrow pore size distribution is beneficial to the charge storage by providing the maximum possible number of electrolyte accessible active sites for electrochemical reactions.3,35 Furthermore, the narrow pore size distribution leads to high adsorbate accessibility and providing a wide range of transport channels to available micropores.3 The textural properties resulted from the p-HC, and porous 5% Fe/HC nanocomposite are listed in Table 2 (ESI†).
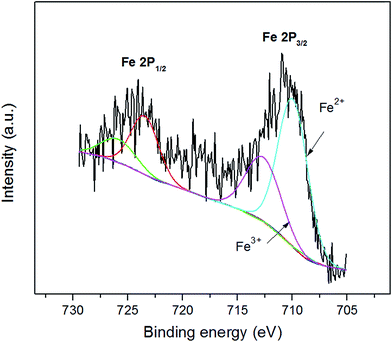
XPS survey of Fe ion (Fig. 4) is used to examine the likely change of chemical state in Fe ion during chemical activation. XPS analyses provide supportive evidences for XRD analyses, because of the very similar pattern between γ-Fe2O3 and Fe3O4, XRD analyses lack of significant evidence to confirm the transformation. Fe3O4 is a mixed valence compound with a stoichiometric structure of FeO·Fe2O3, where the Fe2+/3+ ratio are supposed to be 1![[thin space (1/6-em)]](https://www.rsc.org/images/entities/char_2009.gif) :
:![[thin space (1/6-em)]](https://www.rsc.org/images/entities/char_2009.gif) 2. Furthermore, Fe 2p core level is split into two components, 2p1/2 and 2p3/2. The asymmetric broad peak at around 710 eV also shows the co-existence of Fe2+ and Fe3+. The lowest binding energy peak at 710.6 eV 713.4 eV are attributed to Fe2+ and Fe3+ in 2p3/2 components, respectively. These values are equivalent to others reported in literature ref. 29–31 and 36. After fitting from the peak area of XPS Fe 2p spectrum, the Fe 2p3/2 spectrum verify that the Fe2+/Fe3+ ratio was found to be 1.95, close to its predicted value of 2. XPS studies are therefore manifested that the stable chemical state of Fe3O4 during chemical activation.
2. Furthermore, Fe 2p core level is split into two components, 2p1/2 and 2p3/2. The asymmetric broad peak at around 710 eV also shows the co-existence of Fe2+ and Fe3+. The lowest binding energy peak at 710.6 eV 713.4 eV are attributed to Fe2+ and Fe3+ in 2p3/2 components, respectively. These values are equivalent to others reported in literature ref. 29–31 and 36. After fitting from the peak area of XPS Fe 2p spectrum, the Fe 2p3/2 spectrum verify that the Fe2+/Fe3+ ratio was found to be 1.95, close to its predicted value of 2. XPS studies are therefore manifested that the stable chemical state of Fe3O4 during chemical activation.
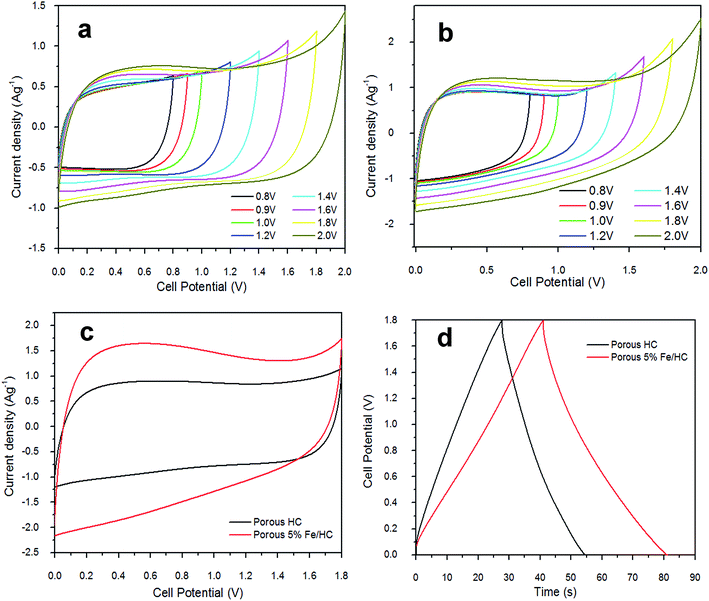
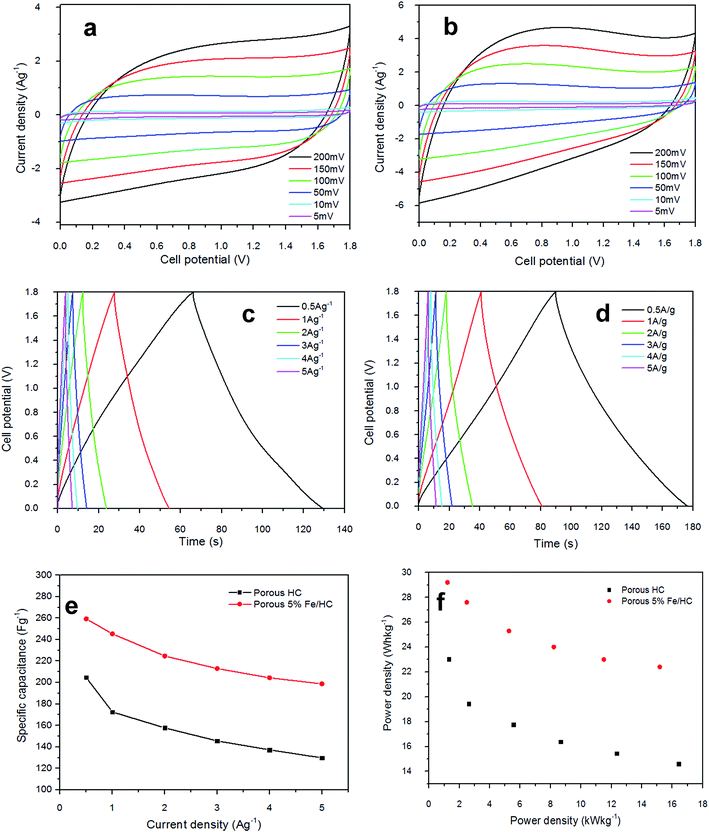
The electrochemical properties of p-HC and p-Fe/HC electrode were studied by cyclic voltammetry (CV) analysis and galvanostatic charge–discharge test. CV of prepared symmetric cell were initially measured at different potential range and is presented in Fig. 5. At low potential ranges, both of the CVs show nominally rectangular shape which are characteristic of a pure EDLC behavior. With increasing potential range, the CV of both symmetric cell still maintains its symmetric rectangular shape and a current leap at the maximum potential window of 2.0 V was observed. The current leap could be due to the evolution of gases generated from interaction between both positive and/or negative electrode with the electrolyte.37 Capacitance value of both symmetric cell shows a slight increase with increasing potential ranges. The CV measurement show that both symmetric cell is stable at a maximum potential limit of 1.8 V without significant distortion, hence further measurements were made at potential window of 1.8 V. Fig. 5(c) shows the CV behaviors of the symmetric cell at a potential scan rate of 50 mV s−1. The pristine p-HC cell demonstrates a narrow rectangular curve, which corresponds to a lower capacitance due to their small specific surface area and preserve only EDLC behavior. The p-Fe/HC cell demonstrate wider and slight distorted rectangular CV curve with higher capacitance value which attributed to both EDLC and pseudo-capacitance behavior. The GCD curve measurement also demonstrated that the symmetric cells are stable at a maximum potential range of 2.0 V without any distortion to the GCD curve.
Fig. 5(a) and (b) present the CV curves of the pristine p-HC electrode and p-Fe/HC symmetric cell at different scan rate in 1 mol L−1 Na2SO4 aqueous electrolyte. The CV analysis is conducted at a scan rate 5, 10, 50, 100, 150 and 200 mV s−1 (inner to outer) with a potential range of 0 to 1.8 V to characterize the capacitive behaviors of the electrode's materials as a symmetrical supercapacitor. Both symmetric cell show elevated current response with increasing scan rate, indicating the porous and polarizable nature of materials. Besides, we observed that the CV curve of p-Fe/HC cell was gradually deviated from the ideal rectangular shape at high scan rate, which is also evidenced to the overlapping effect of EDLC mechanisms and pseudo-capacitive reaction between the active materials and electrolyte.36,38 Fig. 5(c) indicates the mirror image characteristics with perfect rectangular shape of CV curves for pristine p-HC sample. In this case, the resultant CV curve shape of p-HC electrode implies that the full contribution of EDLC with physical charge separation process occurred between the electrode–electrolyte interfaces. Indeed, the rectangularity of p-Fe/HC nanocomposites suggested that there is a substantial pseudocapacitance contribution to the overall specific capacitance. As presented from the Fig. 5(c), the CV curve of the p-Fe/HC nanocomposite electrode exhibited much wider of area under curve than that of the pristine p-HC electrode, which can be proven by increasing the capacitance with addition Fe3O4 nanoparticles into porous hydrochar shell. Interestingly, it was found that the presence of sufficient amount of Fe3O4 nanoparticles (5 wt%) in the p-Fe/HC nanocomposite electrode could provide more electro-active sites for adsorption/de-adsorption of sulphate anions and thus promote more redox reactions between the electrode–electrolyte interfaces.39 The pseudocapacitance behavior of Fe3O4 nanoparticles might be resulted from the surface redox reactions between Fe2+ and Fe3+ ions associated with intercalation of sulphate ions on oxide layer40 as in eqn (6).
| 2FeIIO + SO42− ↔ (FeIIIO) + SO42−(FeIIIO) + 2e− | (6) |
As the scan rate increased, the CV curves demonstrate resistive CV shapes that best described the occurrence of increased ohmic behavior. The CV curve retained near rectangular shape with slight distortion at scan rate above 150 mV s−1 established the desired of high power capability porous materials. The distortion at high scan rate could be attributed to a decline in the capacitance. The performance of supercapacitors in a real application is primarily determined by their charge–discharge characteristics, which reveal their energy and power performance. Galvanostatic charge–discharge measurement was applied at different current densities to evaluate the capacitance performance and the result shown in Fig. 6(c) and (d). The gravimetric capacitance was calculated from these profile according to eqn (2) and it is shown in Fig. 6(e) and Table 3 (ESI†). The specific capacitance values of the p-HC electrode decrease from 204.7 F g−1 to 129.8 F g−1 as the current density increases from 0.5 A g−1 to 5 A g−1 with a total reduction of 36.6% capacitance.
On the other hand, the specific capacitance of the p-Fe/HC nanocomposite only exhibits a reduction of 23.4% which decreases gradually from 259.3 F g−1 at 0.5 A g−1 to 198.7 F g−1 at a current density of 5 A g−1, suggesting a good rate of capability. An ideal EDLC with an infinitely fast ion transport should deliver the same energy at virtually any current density. The decrease of capacitance despite having a higher current is generally attributed to an increase in the ohmic resistance due to the ion “traffic jam” within the particles' micropores.3,41 As can be seen from Fig. 6(f), the p-Fe/HC nanocomposite electrode manifests excellent energy density of 116.7 W h kg−1, which is 21% higher than p-HC electrode which is 92.1 W h kg−1 at a current density of 0.5 A g−1. The p-Fe/HC electrode also preserved 76.6% of energy density at high current density (5 A g−1), which is 89.4 W kg−1. The excellent capacitive and energy density performance of the p-Fe/HC nanocomposite electrode can be attributed to the synergistic effect of the electric double layer contribution of the high specific surface area with good distribution of micro- and mesopore volumes of the porous outer shell and pseudo-capacitive contribution of Fe3O4 nanoparticles.23 Based on the results obtained, the p-Fe/HC nanocomposite electrode delivers a maximum energy density of 29.2 W h kg−1 at a power density of 1.2 kW kg−1 as well as a maximum power density of 15.2 kW kg−1 at the energy density of 22.4 W h kg−1. The variations of energy density as a function of power density (Ragone plot) for pristine p-HC and p-Fe/HC electrodes are shown in Fig. 6(f). By comparing the energy density between p-HC and p-Fe/HC symmetric cell, it was found that the energy density was increasing from 23 W h kg−1 (p-HC) up to 29.2 W h kg−1 which provides evidence that about 27% of increment was attributed to the contribution of 5% of Fe3O4 into porous hydrochar shell. During the charge–discharge steps, a symmetric triangular charge–discharge profile distinctive for an ideal capacitor was observed (the coulombic efficiency is above 88%), indicating the reversible adsorption/desorption of ions.
(EIS) is an important tool to examine the mechanism of ion transport and provides information regarding the internal resistance of the electrode materials and resistance between the electrode/electrolyte interfaces. Fig. 7(a) shows the Nyquist impedance spectrum of the p-HC and p-Fe/HC are similar to each other showing a nearly linear line in the low-frequency region and an arc in the high-frequency region. Both narrow arc and linear line in Nyquist spectrum indicate a remarkable capacitive performance of the porous carbon based electrode. The arc intersection with the real axis depends on the internal resistance (Rs and Rct) and the vertical line corresponds to good capacitive behaviors of the supercapacitors. The arcs are attributed to a parallel combination of charge transfer phenomena and double layer capacitance.42 It can be observed that arc diameter of the porous p-Fe/HC nanocomposite electrode is smaller than the p-HC electrode, indicating the charge transfer resistance of the nanocomposite materials is lower. These results support the previous findings21 that the addition of a small amount of Fe3O4 particles in the porous carbon materials leads to an increase in the conductivity of the nanocomposite electrode and hence improve the capacitive performance.
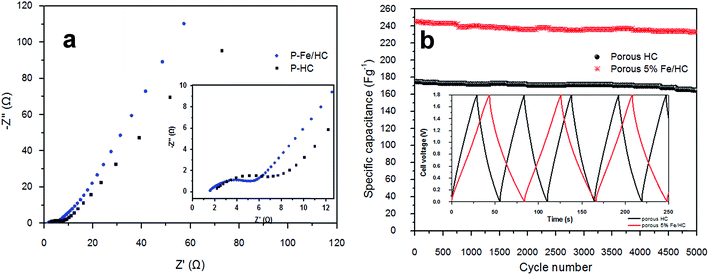 | ||
| Fig. 7 (a) Nyquist plots for the p-HC and 5% Fe/HC nanocomposite electrode and (b) coulomic efficiency and gravimetric capacitance vs. cycle number. | ||
Moreover, the rate capability measurement of the p-Fe/HC nanocomposite, long cycling stability test was conducted under a constant cyclic charge–discharge at a current density of 1 A g−1 for 5000 cycles. Fig. 7(b) shows the specific capacitance symmetric cell across 5000 cycles. The capacitance retention of p-HC is degraded gradually after 2500 cycles and retained almost 90% retention (162 F g−1) at the end of the cycle. The p-Fe/HC symmetric cell exhibit fluctuation between 2000 and 3000 cycles after which the capacitance retention is stable at 95% which is 233.5 F g−1. As observed from the figure, there are increasing capacitance values in the capacitance before the decay starts to occur. This phenomenon could be related to the pores expansion and swelling during the adsorption and desorption of electrolyte,23 thus creating more accessible active sites for charge adhesion. Interestingly, the specific capacitance was still 233 F g−1 after holding for more than 100 hours. Such excellent cycling stability could be achieved due to the excellent structural properties (high specific surface area with good pore size volume) as well as a robust network (utilization of Fe3O4 encapsulated in hydrochar shell nanocomposite) preventing crumbling or disintegration of the metal oxide nanoparticles.
Conclusion
In brief, p-Fe/HC (Fe3O4-porous hydrochar) nanocomposites has been successfully synthesized via a simple hydrothermal carbonization method and sequent KOH activation at 600 °C. Structural and morphological characterizations show the Fe3O4 embedded in 3D porous cavities with a specific surface area of 1712.8 m2 g−1. The p-Fe/HC nanocomposites were tested and measured in 1 mol L−1 Na2SO4 aqueous electrolyte show a high potential window of 1.8 V and an excellent capacitance value of 245.4 F g−1 at 1 A g−1 with the presence of both EDLC and pseudocapacitance. The high specific surface area with good pore size volume of micro and mesopores leads to the excellent energy density of 27.6 W h kg−1 at 1 A g−1 as well as a remarkable cycling stability with relatively 95.1% capacitance retention after 5000 cycles. The present work exhibited a good prospect for development of Fe3O4-porous hydrochar nanocomposite materials by performing the Fe3O4 embedded with hydrochar outer-shell and KOH activation to introduce micro and mesopores onto the external surface at the final stage. The protective carbon layer could enhance the electrochemical stability by reducing the volume change of oxide particles. Besides, conductive porous hydrochar provides more ion accessible diffusion medium for electrolyte ions and thus enables a fast electron transport pathways. The method we used in this work is facile and productive, which can be extended to the development of various metal oxide for supercapacitors application.Acknowledgements
The authors would like to thank University of Malaya for funding this research work under IPPP-Postgraduates Research Grant (PG021-2015B), University Malaya Research Fund Assistance (BKP) Grant (BK096-2016), and MOSTI-Science Fund, 03-01-03-SF1032 (SF003-2015).References
- Y. Zhang, H. Feng, X. Wu, L. Wang, A. Zhang, T. Xia, H. Dong, X. Li and L. Zhang, Int. J. Hydrogen Energy, 2009, 34, 4889–4899 CrossRef CAS.
- C. Liu, F. Li, L. P. Ma and H. M. Cheng, Adv. Mater., 2010, 22, E28–E62 CrossRef CAS PubMed.
- A. Bello, N. Manyala, F. Barzegar, A. A. Khaleed, D. Y. Momodu and J. K. Dangbegnon, RSC Adv., 2016, 6, 1800–1809 RSC.
- B. E. Conway, Electrochemical supercapacitors: scientific fundamentals and technological applications, Springer Science & Business Media, 2013 Search PubMed.
- L. Yuan, X. Xiao, T. Ding, J. Zhong, X. Zhang, Y. Shen, B. Hu, Y. Huang, J. Zhou and Z. L. Wang, Angew. Chem., 2012, 124, 5018–5022 CrossRef.
- Z.-L. Xie, R. J. White, J. Weber, A. Taubert and M. M. Titirici, J. Mater. Chem., 2011, 21, 7434–7442 RSC.
- M. Zhi, C. Xiang, J. Li, M. Li and N. Wu, Nanoscale, 2013, 5, 72–88 RSC.
- Y. Chen, H. Xia, L. Lu and J. Xue, J. Mater. Chem., 2012, 22, 5006–5012 RSC.
- C. Wu, H. Zhang, Y.-X. Wu, Q.-C. Zhuang, L.-L. Tian and X.-X. Zhang, Electrochim. Acta, 2014, 134, 18–27 CrossRef CAS.
- E. D. Daniel and I. Levine, J. Acoust. Soc. Am., 1960, 32, 1–15 CrossRef.
- A. Figuerola, R. Di Corato, L. Manna and T. Pellegrino, Pharmacol. Res., 2010, 62, 126–143 CrossRef CAS PubMed.
- J. Shin, K. Y. Lee, T. Yeo and W. Choi, Sci. Rep., 2016, 6, 21792 CrossRef CAS PubMed.
- X. Du, C. Wang, M. Chen, Y. Jiao and J. Wang, J. Phys. Chem. C, 2009, 113, 2643–2646 CAS.
- H. Quan, B. Cheng, Y. Xiao and S. Lei, Chem. Eng. J., 2016, 286, 165–173 CrossRef CAS.
- Y. Lin, X. Wang, G. Qian and J. J. Watkins, Chem. Mater., 2014, 26, 2128–2137 CrossRef CAS.
- A. L.-T. Pham, C. Lee, F. M. Doyle and D. L. Sedlak, Environ. Sci. Technol., 2009, 43, 8930–8935 CrossRef CAS PubMed.
- H. Cao, G. Huang, S. Xuan, Q. Wu, F. Gu and C. Li, J. Alloys Compd., 2008, 448, 272–276 CrossRef CAS.
- Y.-H. Kim and S.-J. Park, Curr. Appl. Phys., 2011, 11, 462–466 CrossRef.
- D. Liu, X. Wang, X. Wang, W. Tian, J. Liu, C. Zhi, D. He, Y. Bando and D. Golberg, J. Mater. Chem. A, 2013, 1, 1952–1955 CAS.
- S. Ghasemi and F. Ahmadi, J. Power Sources, 2015, 289, 129–137 CrossRef CAS.
- P. Khiew, M. Ho, T. Tan, W. Chiu, R. Shamsudin, M. A. Abd-Hamid and C. Chia, International Journal of Chemical, Molecular, Nuclear, Materials and Metallurgical Engineering, 2013, 7(8), 615–619 Search PubMed.
- M. Ho, P. Khiew, D. Isa, T. Tan, W. Chiu, C. H. Chia, M. A. A. Hamid and R. Shamsudin, Sains Malays., 2014, 43, 885–894 CAS.
- I. Oh, M. Kim and J. Kim, Energy, 2015, 86, 292–299 CrossRef CAS.
- Y. S. Lim, S. B. A. Hamid, C. W. Lai and S. J. Teh, Nanosci. Nanotechnol. Lett., 2015, 7, 655–660 CrossRef.
- M. Sevilla Solís and M. Titirici, Grupo Español del Carbón, 2012, 1, 7–17 Search PubMed.
- M. Sevilla and A. B. Fuertes, Chem.–Eur. J., 2009, 15, 4195–4203 CrossRef CAS PubMed.
- J. Wang and S. Kaskel, J. Mater. Chem., 2012, 22, 23710–23725 RSC.
- Y. Lim, C. Lai, S. Hamid, N. M. Julkapli, W. Yehya, M. Karim, M. Tai and K. Lau, Mater. Res. Innovations, 2014, 18, S6-457–S456-461 CrossRef.
- H. Xia, C. Hong, B. Li, B. Zhao, Z. Lin, M. Zheng, S. V. Savilov and S. M. Aldoshin, Adv. Funct. Mater., 2015, 25, 627–635 CrossRef CAS.
- J. Liu, M. Zheng, X. Shi, H. Zeng and H. Xia, Adv. Funct. Mater., 2016, 26, 919–930 CrossRef CAS.
- P. Taberna, P. Simon and J.-F. Fauvarque, J. Electrochem. Soc., 2003, 150, A292–A300 CrossRef CAS.
- M. A. Lillo-Ródenas, D. Cazorla-Amorós and A. Linares-Solano, Carbon, 2003, 41, 267–275 CrossRef.
- S. Yang, X. Song, P. Zhang, J. Sun and L. Gao, Small, 2014, 10, 2270–2279 CrossRef CAS PubMed.
- H. Quan, B. Cheng, Y. Xiao and S. Lei, Chem. Eng. J., 2016, 286, 165–173 CrossRef CAS.
- S.-I. Kim, J.-S. Lee, H.-J. Ahn, H.-K. Song and J.-H. Jang, ACS Appl. Mater. Interfaces, 2013, 5, 1596–1603 CAS.
- K. Qingqing, T. Chunhua, L. Yanqiong, L. Huajun and W. John, Mater. Res. Express, 2014, 1, 025015 CrossRef.
- J. W. Long, D. Bélanger, T. Brousse, W. Sugimoto, M. B. Sassin and O. Crosnier, MRS Bull., 2011, 36, 513–522 CrossRef CAS.
- L. Ding, Z. Wang, Y. Li, Y. Du, H. Liu and Y. Guo, Mater. Lett., 2012, 74, 111–114 CrossRef CAS.
- M. Y. Ho, P. S. Khiew, D. Isa, T. K. Tan, W. S. Chiu, C. H. Chia, M. A. A. Hamid and R. Shamsudin, Sains Malays., 2014, 43, 885–894 CAS.
- J. Zhu, S. Tang, H. Xie, Y. Dai and X. Meng, ACS Appl. Mater. Interfaces, 2014, 6, 17637–17646 CAS.
- L. Wei, M. Sevilla, A. B. Fuertes, R. Mokaya and G. Yushin, Adv. Energy Mater., 2011, 1, 356–361 CrossRef CAS.
- G. Wang, L. Zhang and J. Zhang, Chem. Soc. Rev., 2012, 41, 797–828 RSC.
Footnote |
| † Electronic supplementary information (ESI) available. See DOI: 10.1039/c7ra00572e |
| This journal is © The Royal Society of Chemistry 2017 |

