 Open Access Article
Creative Commons Attribution 3.0 Unported Licence
Electrocatalytic activity of porous Ni–Fe–Mo–C–LaNi5 sintered electrodes for hydrogen evolution reaction in alkaline solution
Liang Wu abc,
Xiaohua Guoabc,
Yang Xuabc,
Yifeng Xiao*abc,
Jinwen Qianabc,
Yanfei Xuabc,
Zhuo Guanabc,
Yuehui Hed and
Yi Zengd
aSchool of Mechanical Engineering, Xiangtan University, Hunan 411105, China. E-mail: sanyxyf@163.com
bKey Laboratory of Welding Robot and Application Technology of Hunan Province, Xiangtan University, Xiangtan 411105, China
cEngineering Research Center of Complex Tracks Processing Technology and Equipment of Ministry of Education, Xiangtan University, Xiangtan 411105, China
dState Key Laboratory of Powder Metallurgy, Central South University, Changsha 410083, China
First published on 23rd June 2017
Abstract
The hydrogen evolution reaction (HER) was studied in 6 M KOH solution at temperatures ranging between 303 K and 353 K on a porous Ni–Fe–Mo–C–LaNi5 electrode. By using steady-state polarization curves and electrochemical impedance spectroscopy (EIS), the surface roughness factor and the intrinsic activities of the porous Ni–Fe–Mo–C–LaNi5 electrode have been determined. The Tafel slope of the best-performing porous Ni–Fe–Mo–C–LaNi5 cathode materials is 140 mV dec−1, and the exchange current density is 9.9 × 10⁻⁴ A cm−2 at elevated temperature. The roughness factor is 8600, which was obtained for the HER on studied electrodes in 6 M KOH solution at 323 K temperature using the EIS data and complex nonlinear least square (CNLS) approximation method. These techniques also permitted us to determine the mechanism and kinetics of the HER on the investigated electrode. The overall experimental data indicates that the porous Ni–Fe–Mo–C–LaNi5 electrode yields electrocatalytic activity in the HER. Nevertheless, when the effect of the surface roughness is taken into consideration, it is demonstrated that alloying Ni with Fe, Mo, C and LaNi5 results in an increased electrocatalytic activity in the HER when comparing to pure Ni. This is due to an improved intrinsic activity of the material, which is explained on the basis of the synergism among the catalytic properties of Ni and of Fe, Mo, and induced by C embedded into Ni–Fe matrix and Ni–Fe–Mo matrix. LaNi5 enhances the H adsorption on the electrode surface and mainly plays a role of hydrogen storage for HER.
1. Introduction
Hydrogen, as a clean and sustainable chemical fuel, is recognized as the most promising substitute for fossil fuels in the future energy infrastructure.1–3 Water electrolysis is a renewable and secure way to create hydrogen of high purity with zero pollutants emission.4,5 The hydrogen evolution reaction (HER) is one of the most frequently studied electrochemical reactions for different reasons. First, the reaction takes place through a limited number of reaction steps with only one reaction intermediate involved.6–10 Second, it has an industrial/technological interest in the alkaline water electrolysis.11–13 Currently, the state-of-art cathode materials for the HER are based on Pt and Pt-based materials,14,15 but their broad applications are restricted by the high cost and resource scarcity. Thus, it is a crucial task to develop effective earth-abundant HER electrocatalysts to replace the precious metals. Among the non-noble metals, Ni and Ni-based electrode materials have been widely considered as promising electrocatalytic materials due to their comparatively large electrocatalytic activity and good stability for HER in alkaline solutions.16 Two main approaches including alloying Ni with some other metals or non-metals17–24 and compositing Ni with active nano-sized particles25–30 have been taken to enhance the intrinsic activity and/or increase the real surface area of electrode materials for HER.In general, the development of novel materials with low overpotential towards the HER could be based on two basic characteristics, namely, increase of intrinsic catalytic activity by use of multicomponent catalysts and increase of the real surface area. Ni-based alloys have represented high catalytic activity in HER and exhibited better catalytic capability than single Ni catalyst for synergistic electronic effect among alloys.31,32 In previous studies, a series of ternary Ni composites such as Ni–Mo–Fe, Ni–Mo–Cu, Ni–Mo–Zn, Ni–Mo–W, Ni–Mo–Co and Ni–Mo–Cr were studied for hydrogen evolution and the authors reported that the best and most stable cathode was Ni–Mo–Fe.33–35 High stability of amorphous Ni–Mo–Fe electrode was confirmed by other authors who tested the electrode with current interruptions.36 Besides, many interests have been devoted to the study of multicomponent alloy electrodes. It was found that Ni–Fe–C cathodes prepared by electrodeposition had high catalytic activity and stability for the HER in sodium hydroxide solution, in which the observed activity was mainly due to the intrinsic activity induced by carbon embedded into Ni–Fe matrix.37–39 Moreover, Machida and Enyo40 published that LaNi5 and other combinations of rare-earth metals and Ni, used as cathode come close to the reversible hydrogen electrode over a wide range of current densities. The authors highlighted the good performance of the electrode materials and proposed that the HER on the LaNi5 alloys proceeds via the Volmer–Tafel reaction route with mixed rate determining characteristics. Based on the above results, it is possible to produce new kinds of porous alloys which combine both a high surface area and good intrinsic catalytic activity in the process of the HER.
The present study was undertaken in order to investigate the electrochemical properties of Ni–Fe–Mo electrode materials, by adding carbon content and rare earths (RE) powders using solid state reaction and comparing with traditional electrocatalytic nickel activity on HER. The aim of the present work is to study the electrocatalytic performance of the developed electrodes for HER, distinguishing the effect of both the surface roughness and the intrinsic activity of the material, by the determination of the real active surface area of the catalyst, in terms of Rf. The mechanisms and kinetics of the HER on these electrodes have also been determined.
2. Experimental
2.1. Preparation of porous Ni–Fe–Mo–C–LaNi5 electrode
Pure commercial powders of Ni (3–5 μm), Fe (3–5 μm), Mo (3–5 μm), C (3–5 μm), LaNi5 (40–70 μm) were mixed in the ratio of 70![[thin space (1/6-em)]](https://www.rsc.org/images/entities/char_2009.gif) :
:![[thin space (1/6-em)]](https://www.rsc.org/images/entities/char_2009.gif) 25
25![[thin space (1/6-em)]](https://www.rsc.org/images/entities/char_2009.gif) :
:![[thin space (1/6-em)]](https://www.rsc.org/images/entities/char_2009.gif) 3
3![[thin space (1/6-em)]](https://www.rsc.org/images/entities/char_2009.gif) :
:![[thin space (1/6-em)]](https://www.rsc.org/images/entities/char_2009.gif) 1
1![[thin space (1/6-em)]](https://www.rsc.org/images/entities/char_2009.gif) :
:![[thin space (1/6-em)]](https://www.rsc.org/images/entities/char_2009.gif) 1 by weight. The powders were ball-milled for 10 h using a mixer, and pressed into compact specimens with dimensions of 28.84 mm × 7.5 mm × 4 mm under a pressure of 50 MPa. The specimens were then sintered in a vacuum furnace under 1 × 10⁻³ Pa at temperatures of 820 °C for a duration of 30 min. Based on our previous work, porous Ni–Cr–Fe with the composition of 7
1 by weight. The powders were ball-milled for 10 h using a mixer, and pressed into compact specimens with dimensions of 28.84 mm × 7.5 mm × 4 mm under a pressure of 50 MPa. The specimens were then sintered in a vacuum furnace under 1 × 10⁻³ Pa at temperatures of 820 °C for a duration of 30 min. Based on our previous work, porous Ni–Cr–Fe with the composition of 7![[thin space (1/6-em)]](https://www.rsc.org/images/entities/char_2009.gif) :
:![[thin space (1/6-em)]](https://www.rsc.org/images/entities/char_2009.gif) 2
2![[thin space (1/6-em)]](https://www.rsc.org/images/entities/char_2009.gif) :
:![[thin space (1/6-em)]](https://www.rsc.org/images/entities/char_2009.gif) 1 sintered under a temperature of 850 °C displayed the best activity for the HER.41 Therefore, porous Ni–Fe–Mo–C materials with powder compositions of 70
1 sintered under a temperature of 850 °C displayed the best activity for the HER.41 Therefore, porous Ni–Fe–Mo–C materials with powder compositions of 70![[thin space (1/6-em)]](https://www.rsc.org/images/entities/char_2009.gif) :
:![[thin space (1/6-em)]](https://www.rsc.org/images/entities/char_2009.gif) 27
27![[thin space (1/6-em)]](https://www.rsc.org/images/entities/char_2009.gif) :
:![[thin space (1/6-em)]](https://www.rsc.org/images/entities/char_2009.gif) 2
2![[thin space (1/6-em)]](https://www.rsc.org/images/entities/char_2009.gif) :
:![[thin space (1/6-em)]](https://www.rsc.org/images/entities/char_2009.gif) 1, 70
1, 70![[thin space (1/6-em)]](https://www.rsc.org/images/entities/char_2009.gif) :
:![[thin space (1/6-em)]](https://www.rsc.org/images/entities/char_2009.gif) 26
26![[thin space (1/6-em)]](https://www.rsc.org/images/entities/char_2009.gif) :
:![[thin space (1/6-em)]](https://www.rsc.org/images/entities/char_2009.gif) 3
3![[thin space (1/6-em)]](https://www.rsc.org/images/entities/char_2009.gif) :
:![[thin space (1/6-em)]](https://www.rsc.org/images/entities/char_2009.gif) 1 and porous Ni–Fe–Mo–C–LaNi5 materials with powder compositions of 70
1 and porous Ni–Fe–Mo–C–LaNi5 materials with powder compositions of 70![[thin space (1/6-em)]](https://www.rsc.org/images/entities/char_2009.gif) :
:![[thin space (1/6-em)]](https://www.rsc.org/images/entities/char_2009.gif) 26
26![[thin space (1/6-em)]](https://www.rsc.org/images/entities/char_2009.gif) :
:![[thin space (1/6-em)]](https://www.rsc.org/images/entities/char_2009.gif) 2
2![[thin space (1/6-em)]](https://www.rsc.org/images/entities/char_2009.gif) :
:![[thin space (1/6-em)]](https://www.rsc.org/images/entities/char_2009.gif) 1
1![[thin space (1/6-em)]](https://www.rsc.org/images/entities/char_2009.gif) :
:![[thin space (1/6-em)]](https://www.rsc.org/images/entities/char_2009.gif) 1 and 70
1 and 70![[thin space (1/6-em)]](https://www.rsc.org/images/entities/char_2009.gif) :
:![[thin space (1/6-em)]](https://www.rsc.org/images/entities/char_2009.gif) 25
25![[thin space (1/6-em)]](https://www.rsc.org/images/entities/char_2009.gif) :
:![[thin space (1/6-em)]](https://www.rsc.org/images/entities/char_2009.gif) 3
3![[thin space (1/6-em)]](https://www.rsc.org/images/entities/char_2009.gif) :
:![[thin space (1/6-em)]](https://www.rsc.org/images/entities/char_2009.gif) 1
1![[thin space (1/6-em)]](https://www.rsc.org/images/entities/char_2009.gif) :
:![[thin space (1/6-em)]](https://www.rsc.org/images/entities/char_2009.gif) 1 by weight and sintering temperatures of 820 °C, 850 °C and 880 °C were also prepared for comparing the HER activities.
1 by weight and sintering temperatures of 820 °C, 850 °C and 880 °C were also prepared for comparing the HER activities.
X-ray diffraction (XRD) (Rigaku D/max-2500, graphite monochromator, Cu Kα) and field-emission scanning electron microscopy (SEM) (NOVA NANOSEM 230) were employed to identify the phase composition, crystalline structures and surface morphology of the materials. The open porosity was measured by the Archimedes method in water based on the following principles: the mass (WS) of a dried porous disc and the mass (Wx) of the porous disc filled with the wax with a density of ρx were weighted in air. The external volume (Vx) of the waxed disc could be determined in water according to the Archimedes method. Then, the open porosity (θp) could be calculated by the expression: θp = (Wx − Ws)/(Vx*ρx).42
Japanese manufacturing electron microprobe (EPMA, JEOLCO, JXA8230 and JXA-8530-f) was employed to measure the distribution of phase elements.
2.2. Electrochemical measurements
The developed electrodes were characterized by means of steady-state polarization curves and electrochemical impedance spectroscopy (EIS). All these tests were performed in oxygen free 6 M KOH solutions which were achieved by bubbling N2 for 15 min before the experiments.Polarization curves were potentiodynamically recorded from −2.0 V vs. Hg/HgO up to the equilibrium potential at a scan rate of 1 mV s−1, and at six different temperatures: 303 K, 313 K, 323 K, 333 K, 343 K and 353 K. Before the tests, the working electrode was held at −1.5 V (vs. VHg/HgO) in the same solution in order to reduce the oxide film existing on the surface electrode layer, for the time needed to establish reproducible polarization diagrams.
EIS measurements were performed after obtaining the polarization curves. Alternating current impedance measurements were carried out at different cathodic overpotentials, and at the following temperatures: 303 K, 323 K, and 353 K. The measurements were made in the frequency range of 10 kHz to 10 mHz. Ten frequencies per decade were scanned using a sinusoidal signal of 10 mV peak-to-peak. The complex nonlinear least square (CNLS) fitting of the impedance data was carried out with the Zview 2.0 software package.
All the electrochemical tests were carried out using a CS350 electrochemical workstation in a standard three-electrode electrochemical cell in 6 M KOH solution. Pt foil and Hg/HgO electrodes were used as the counter and reference electrodes, respectively. The latter was connected to the working electrode via a Luggin capillary positioned close to the working electrode.
3. Results and discussion
3.1. Characterization of porous Ni–Fe–Mo–C–LaNi5 cathode materials
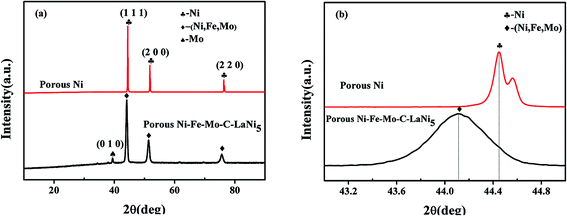
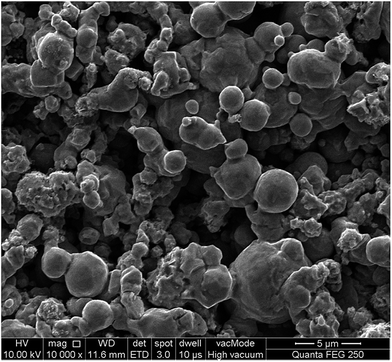
Fig. 1a shows a typical XRD pattern of a prepared porous Ni–Fe–Mo–C–LaNi5 alloy. The pattern indicates that the prepared porous material has a very similar crystal structure to that of Ni owing to the high solubility of Fe, Mo and C in the Ni matrix. The diffraction peaks are (111), (200) and (220). Fig. 1b shows the negative shift of the (111) peak of the porous Ni–Fe–Mo–C–LaNi5 cathode material relative to that of the porous Ni. Compared with Ni, the (111) peak of the Ni–Fe–Mo–C–LaNi5 alloy shows an obvious shift to the left (lower angle) due to the solid solution of Mo, Fe and C in the Ni.Scanning electron micrographs (SEM) of the porous Ni–Fe–Mo–C–LaNi5 cathode material is shown in Fig. 2. The porous microstructure indicates that the fabricated porous Ni–Fe–Mo–C–LaNi5 electrode has a high open porosity. It is widely accepted that one of the methods for the activity enhancement of cathode materials is the increase of the surface area.
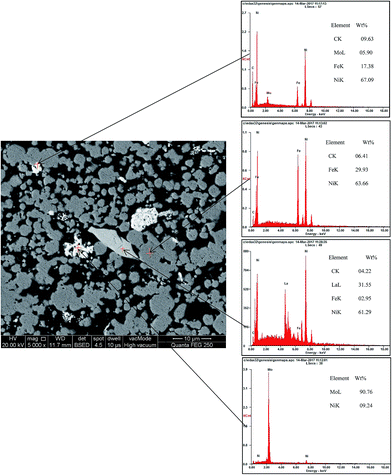
BSED and EDS maps of porous Ni–Fe–Mo–C–LaNi5 electrode are shown in Fig. 3. There are mainly four parts from the above picture. The main parts of the figure in the dark-grey are Ni–Fe–C solid solution. White parts are mainly Mo particles. Light grey parts are Ni–Fe–Mo–C solid solution. A long strip of material is LaNi5, which does not react with other elements.
EPMA mapping performed on the BSED images (Fig. 4(a)) of the porous Ni–Fe–Mo–C–LaNi5 electrode are shown in Fig. 4. From the Fig. 4(b) and (c), we can see that there are Ni–Fe solid solution generation. Fig. 4(d) shows that Mo elements exist in the form of aggregate. However, there are small number of Ni, Fe elements distributing on Mo particles, forming Ni–Fe–Mo–C solid solution. La elements are mainly enriched in an area, in combination with Fig. 4(e), which are LaNi5 alloy.
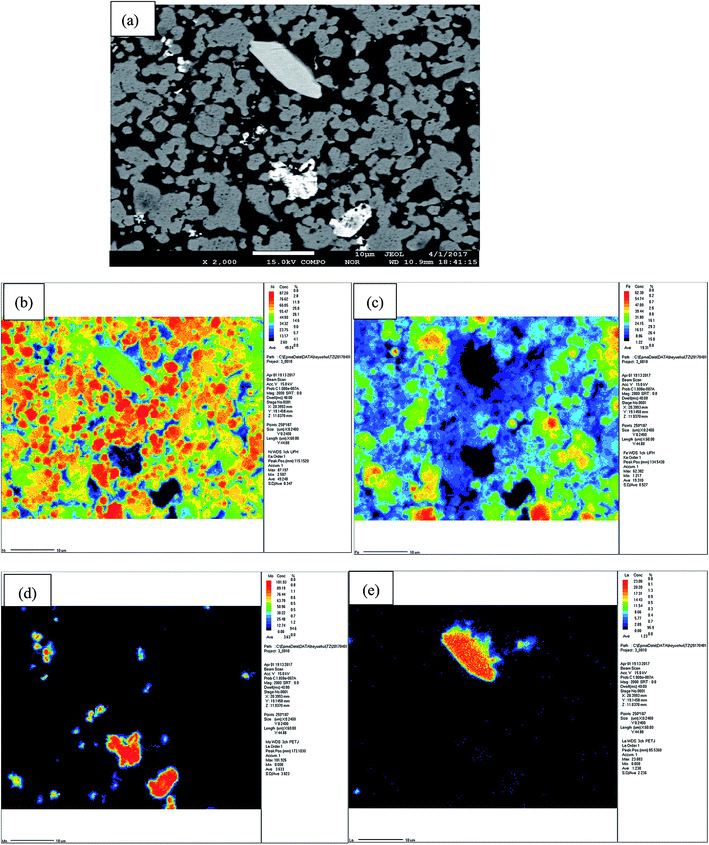 | ||
| Fig. 4 BSED images (a) and EPMA mappings of porous Ni–Fe–Mo–C–LaNi5 electrode, showing the elemental distribution of Ni (b), Fe (c), Mo (d) and La (e). | ||
EPMA line scanning performed on the BSED images (Fig. 5(a)) of the porous Ni–Fe–Mo–C–LaNi5 electrode is shown in Fig. 5. The left parts of the figure in the dark-grey are Ni, Fe and C elements. The right parts of the figure in the light grey are Ni, Fe, Mo and C elements. And the content of Ni, Fe elements increased gradually in the light grey part. It shows that some Ni, Fe elements diffuse into the Mo particles.
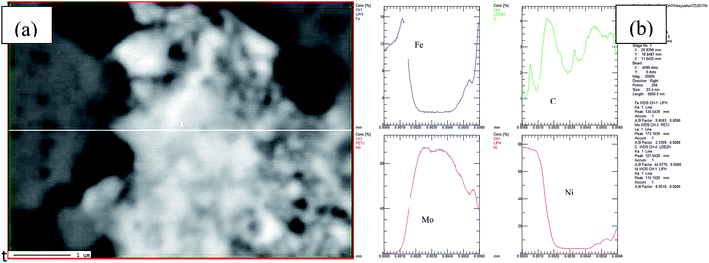 | ||
| Fig. 5 BSED images (a) and EPMA Line scanning (b) of porous Ni–Fe–Mo–C–LaNi5 electrode, showing the elemental distribution of Ni, Fe, Mo and C. | ||
The pore structure parameters of the freshly prepared porous Ni–Fe–Mo–C–LaNi5 cathode material are shown in Table 1. Obviously, the porous Ni–Fe–Mo–C–LaNi5 cathode material has a larger porosity and mean pore size than the porous Ni.
| Electrode | Sintering temperature (°C) | Mean pore size (μm) | Porosity (%) |
|---|---|---|---|
| Ni–Fe–Mo–C–LaNi5 | 820 | 3.7 | 35.1 |
| Ni | 820 | 2.1 | 24 |
3.2. Polarization measurements
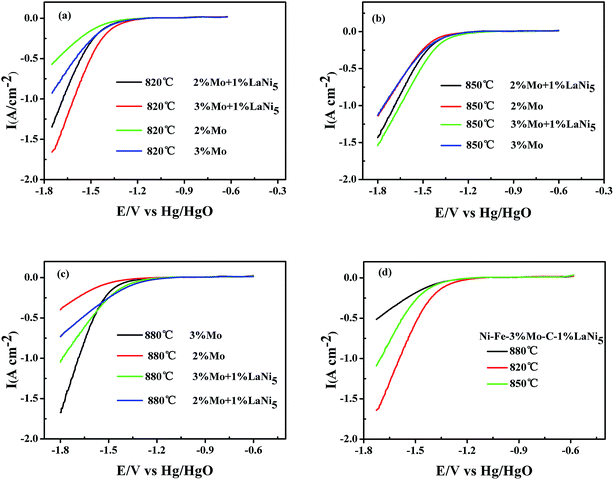
The linear sweep cathodic polarizations of the different kinds of porous Ni–Fe–Mo–C–LaNi5 cathode materials for the HER in 6 M KOH at 303 K are illustrated in Fig. 6. Porous Ni–Fe–Mo–C–LaNi5 materials with the composition of 70![[thin space (1/6-em)]](https://www.rsc.org/images/entities/char_2009.gif) :
:![[thin space (1/6-em)]](https://www.rsc.org/images/entities/char_2009.gif) 25
25![[thin space (1/6-em)]](https://www.rsc.org/images/entities/char_2009.gif) :
:![[thin space (1/6-em)]](https://www.rsc.org/images/entities/char_2009.gif) 3
3![[thin space (1/6-em)]](https://www.rsc.org/images/entities/char_2009.gif) :
:![[thin space (1/6-em)]](https://www.rsc.org/images/entities/char_2009.gif) 1
1![[thin space (1/6-em)]](https://www.rsc.org/images/entities/char_2009.gif) :
:![[thin space (1/6-em)]](https://www.rsc.org/images/entities/char_2009.gif) 1 sintered at different temperatures all showed excellent activity for the HER, and porous Ni–Fe–Mo–C–LaNi5 with the composition of 70
1 sintered at different temperatures all showed excellent activity for the HER, and porous Ni–Fe–Mo–C–LaNi5 with the composition of 70![[thin space (1/6-em)]](https://www.rsc.org/images/entities/char_2009.gif) :
:![[thin space (1/6-em)]](https://www.rsc.org/images/entities/char_2009.gif) 25
25![[thin space (1/6-em)]](https://www.rsc.org/images/entities/char_2009.gif) :
:![[thin space (1/6-em)]](https://www.rsc.org/images/entities/char_2009.gif) 3
3![[thin space (1/6-em)]](https://www.rsc.org/images/entities/char_2009.gif) :
:![[thin space (1/6-em)]](https://www.rsc.org/images/entities/char_2009.gif) 1
1![[thin space (1/6-em)]](https://www.rsc.org/images/entities/char_2009.gif) :
:![[thin space (1/6-em)]](https://www.rsc.org/images/entities/char_2009.gif) 1 sintered under a temperature of 820 °C displayed the best activity for the HER. Without special version, all the figures and tables illustrate the performances of porous Ni–Fe–Mo–C–LaNi5 alloys with the composition of 70
1 sintered under a temperature of 820 °C displayed the best activity for the HER. Without special version, all the figures and tables illustrate the performances of porous Ni–Fe–Mo–C–LaNi5 alloys with the composition of 70![[thin space (1/6-em)]](https://www.rsc.org/images/entities/char_2009.gif) :
:![[thin space (1/6-em)]](https://www.rsc.org/images/entities/char_2009.gif) 25
25![[thin space (1/6-em)]](https://www.rsc.org/images/entities/char_2009.gif) :
:![[thin space (1/6-em)]](https://www.rsc.org/images/entities/char_2009.gif) 3
3![[thin space (1/6-em)]](https://www.rsc.org/images/entities/char_2009.gif) :
:![[thin space (1/6-em)]](https://www.rsc.org/images/entities/char_2009.gif) 1
1![[thin space (1/6-em)]](https://www.rsc.org/images/entities/char_2009.gif) :
:![[thin space (1/6-em)]](https://www.rsc.org/images/entities/char_2009.gif) 1 and under the sintering temperature of 820 °C.
1 and under the sintering temperature of 820 °C.
In order to investigate the catalytic activity of the prepared electrocatalysts, Tafel linear polarization measurements were preformed in 6 M KOH solution, and the corresponding electrochemical parameters (Tafel slope, exchange current density, transfer coefficient) were derived from the recorded curves. Fig. 7 shows a set of Tafel curves recorded at 323 K on the porous Ni–Fe–Mo–C–LaNi5 electrode. A curve performed on porous Ni electrode was also included to compare the obtained results. The curves were corrected with respect to the reversible HER potential at the given conditions and for the jR-drop. The Tafel curves obtained for porous Ni–Fe–Mo–C–LaNi5 electrocatalysts show a classical Tafe behavior, indicating that the HER on these electrodes is purely kinetically controlled reaction described by the Tafel equation:43,44
η = a + b![[thin space (1/6-em)]](https://www.rsc.org/images/entities/char_2009.gif) log log![[thin space (1/6-em)]](https://www.rsc.org/images/entities/char_2009.gif) j j
| (1) |
a = (2.3RT)/(nβF)log![[thin space (1/6-em)]](https://www.rsc.org/images/entities/char_2009.gif) j0 j0
| (2) |
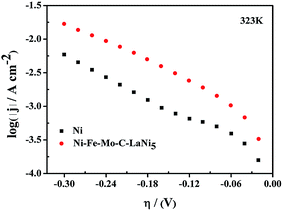 | ||
| Fig. 7 Linear Tafel polarization curves recorded on smooth Ni, Ni–Fe–Mo–C–LaNi5 electrocatalysts in 6 M KOH solution at 323 K. | ||
The other parameter of interest is β, the symmetry factor, which can be calculated from the Tafel slope as
| b = −(2.3RT)/(nβF) | (3) |
![[thin space (1/6-em)]](https://www.rsc.org/images/entities/char_2009.gif) 485 C mol−1) is the Faraday constant, and R (=8.314 J mol−1 K−1) is the gas constant. Since curve for porous Ni–Fe–Mo–C–LaNi5 electrocatalyst in Fig. 7 does not show any significant change in the Tafel slope, the same HER reaction mechanism should be valid through the entire overpotential region investigated. The values of the kinetic parameters are reported in Table 2. The mechanism of HER in alkaline solution involves the formation of an adsorbed hydrogen atom intermediate, MHads (Volmer reaction, eqn (4)), the electrodic desorption of hydrogen into solution (Heyrovsky reaction, eqn (5)) and/or a chemical desorption by combination of two adatoms (Tafel reaction, eqn (6)):
485 C mol−1) is the Faraday constant, and R (=8.314 J mol−1 K−1) is the gas constant. Since curve for porous Ni–Fe–Mo–C–LaNi5 electrocatalyst in Fig. 7 does not show any significant change in the Tafel slope, the same HER reaction mechanism should be valid through the entire overpotential region investigated. The values of the kinetic parameters are reported in Table 2. The mechanism of HER in alkaline solution involves the formation of an adsorbed hydrogen atom intermediate, MHads (Volmer reaction, eqn (4)), the electrodic desorption of hydrogen into solution (Heyrovsky reaction, eqn (5)) and/or a chemical desorption by combination of two adatoms (Tafel reaction, eqn (6)):| H2O + M + e− → MHads + OH− | (4) |
| H2O + MHads → H2 + M + OH− | (5) |
| MHads + MHads → H2 + 2M | (6) |
| Catalyst | Temperature (K) | |||||
|---|---|---|---|---|---|---|
| 303 | 313 | 323 | 333 | 343 | 353 | |
| Ni–Fe–Mo–C–LaNi5 | ||||||
| b (mV dec−1) | 102.63 | 109.71 | 117.48 | 121.8 | 134.61 | 143.67 |
| j0 (A cm−2) | 2.82 × 10⁻⁴ | 4.46 × 10⁻⁴ | 6.06 × 10⁻⁴ | 7.07 × 10⁻⁴ | 8.23 × 10⁻⁴ | 9.91 × 10⁻⁴ |
| β | 0.59 | 0.57 | 0.55 | 0.55 | 0.51 | 0.49 |
| η100 (100 mv) | 262 | 258 | 259 | 260 | 280 | 289 |
| Smooth Ni | ||||||
| b (mV dec−1) | 94.40 | 98.23 | 102.11 | 128.61 | 139.18 | 171.7 |
| j0 (A cm−2) | 3.45 × 10⁻⁵ | 4.61 × 10⁻⁵ | 5.72 × 10⁻⁵ | 1.08 × 10⁻⁴ | 1.20 × 10⁻⁴ | 3.27 × 10⁻⁴ |
| β | 0.64 | 0.65 | 0.63 | 0.52 | 0.49 | 0.41 |
| η100 (100 mv) | 327.8 | 326.3 | 332.5 | 380.0 | 408.9 | 428.0 |
In Table 2 it is also reported the overpotential values at a fixed current density of −100 mA cm−2, η100. This parameter gives an indication on the amount of energy (overpotential) that has to be invested to produce a fixed amount of hydrogen. The current efficiency of the process, determined from the hydrogen volume measured with the aid of the electrochemical cell,57 is about 99.9%. The porous Ni–Fe–Mo–C–LaNi5 electrode is characterized by higher exchange current density, j0, and lower hydrogen overpotential, η100, compared to the porous Ni, thereby indicating an improvement of eletrocatalytic activity. Porous Ni–Fe–Mo–C–LaNi5 electrode has the higher exchange current density (j0 = 9.9 × 10⁻⁴ A cm−2, T = 353 K) compared to porous Ni–Mo–Fe58 alloy electrode, porous Ni–Fe–C59 electrode and porous Ni–Co–LaNi5 (ref. 60) electrode, etc. This manifests that porous Ni–Fe–Mo–C–LaNi5 electrode has the better electrocatalytic activity.
However, since the Tafel curves are normalized to the geometric area of the catalysts and not to the real electrochemical area, the results discussed above cannot offer a definite conclusion if the observed electrocatalytic activity is a result of only an increased surface area of the catalysts, or if an improvement in the intrinsic electrocatalytic properties of the catalyst materials is also a contributing factor. Therefore, in order to obtain information on the intrinsic activity of the investigated materials in the HER, the curves presented in Fig. 7 should be normalized to the real electrochemically active surface area. In this work, an EIS technique has been proposed as the most appropriated to determine the real surface area in electrochemical systems. Thus, the following section of the paper will discuss the EIS results obtained in the catalytic materials developed.
3.3. Electrochemical impedance spectroscopy measurements
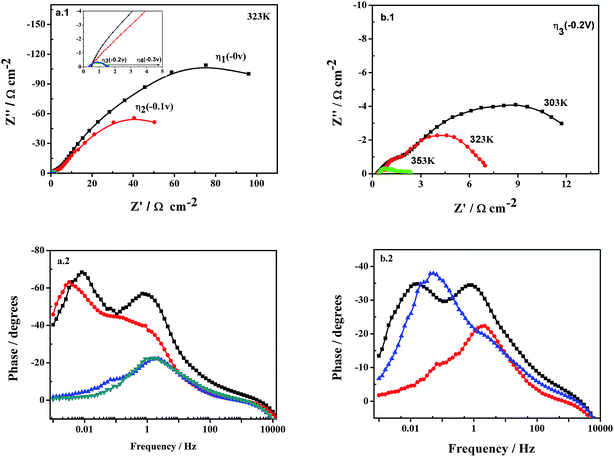
To ensure a complete characterization of the electrode/electrolyte interface and corresponding processes, EIS measurements were made at different selected overpotentials of the previously obtained polarization curves: η1, corresponding to the equilibrium potential, 0 mV; η2, a cathodic overpotential at which it is not manifested the hydrogen evolution; η3, a overpotential at which the hydrogen production takes place at a very low rate; and η4, at which hydrogen is vigorously generated. Fig. 8 shows EIS spectra of examples recorded on the Ni–Fe–Mo–C–LaNi5 electrocatalysts. The impedance spectra of the Ni–Fe–Mo–C–LaNi5 electrocatalysts present two clearly differentiated semicircles in the complex plane plot (Fig. 8(a.1)), i.e. two maximums in the phase angle Bode representation (Fig. 8(a.2)), being the high frequency semicircle diameter practically constant with the overpotential (see Fig. 8(b.1)). The EIS spectra reveal the presence of two differentiated semicircles (i.e. two different time constants), the first one at high frequencies (HF), and the second one, at low frequencies (LF). From Fig. 8 it is clear that the diameter of the LF semicircles diminishes considerably with both the cathodic overpotential and the temperature, whereas the diameter of the HF semicircle remains almost unchanged.In order to derive a physical picture of the electrode/electrolyte interface and the processes occurring at the electrode surface, a electric equivalent circuit model has been used to fit the EIS response of the catalysis investigated (Fig. 9): a two-time constant serial model. This model, proposed by Chen and Lasia,61 reflects the response of a HER system characterized by two semicircles, but only the LF semicircle is related to the kinetics of the HER. The time constant associated to this semicircle, τ2(CPE2 − R2), changes with overpotential. The HF semicircles is associated to the porosity of the electrode surface,62–65 and the time constant related to this semicircles, τ1(CPE1 − R1), does not significantly change with the cathodic overpotential. According to the discussion presented above, the suitability of a specific electric equivalent circuit (EEC) to model the experimental data can be considered as a criterion to prescribe parameters to the specific processes (i.e. charge transfer kinetics, surface porosity or hydrogen adsorption).
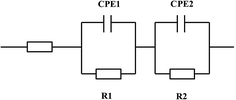 | ||
| Fig. 9 EEC models used to explain the EIS response of the HER on the Ni–Fe–Mo–C–LaNi5:two-time constant serial model (2 TS). | ||
Fig. 9 shows that the EEC used properly model the alternating current response of the investigated materials, manifesting an excellent agreement between the experimental (symbols) and CNLS fitting (lines) data. Table 3 reports the EEC parameters values obtained from the experimental impedance data fitting on porous Ni–Fe–Mo–C–LaNi5 electrocatalyst at different temperatures and overpotentials. The equation proposed by Brug et al.66 was employed to average double layer capacitances, Ci, calculations:
| Ci = [Qi/(Rs−1 + Ri−1)(1−n)]1/ni | (7) |
| Catalyst | Temperature (K) | ||||||||
|---|---|---|---|---|---|---|---|---|---|
| Ni–Fe–Mo–C–LaNi5 | 2 TS EEC | ||||||||
| 303 K | 323 K | 353 K | |||||||
| 0 V | −0.1 V | −0.2 V | 0 V | −0.1 V | −0.2 V | 0 V | −0.1 V | −0.2 V | |
| χ2 | 2.1 × 10⁻³ | 3.5 × 10⁻³ | 6.7 × 10⁻³ | 5.4 × 10⁻³ | 8.2 × 10⁻³ | 6.3 × 10⁻³ | 9.8 × 10⁻³ | 4.9 × 10⁻³ | 6.4 × 10⁻³ |
| Rs (Ω cm2) | 0.41 | 0.41 | 0.37 | 0.36 | 0.33 | 0.34 | 0.35 | 0.34 | 0.32 |
| R1 (Ω cm2) | 4.4 | 5.3 | 4.5 | 4.1 | 3.12 | 2.19 | 2.98 | 2.52 | 1.78 |
| R2 (Ω cm2) | 778.1 | 358.3 | 13.82 | 522.7 | 308 | 19.78 | 285.5 | 41.03 | 6.17 |
| Q1 (Ω cm2) | 0.08 | 0.11 | 0.16 | 0.15 | 0.20 | 0.23 | 0.19 | 0.22 | 0.26 |
| N1 | 0.83 | 0.82 | 0.83 | 0.82 | 0.82 | 0.83 | 0.85 | 0.84 | 0.83 |
| C1 (mF cm−2) | 39.7 | 55.7 | 89.6 | 79.0 | 110.1 | 136.5 | 117.7 | 134.3 | 156.2 |
| Q2 (Ω cm2) | 0.12 | 0.19 | 0.23 | 0.18 | 0.24 | 0.31 | 0.25 | 0.33 | 0.37 |
| N2 | 0.85 | 0.86 | 0.87 | 0.88 | 0.87 | 0.88 | 0.89 | 0.87 | 0.87 |
| C2 (mF cm−2) | 70.5 | 125.4 | 159.2 | 123.9 | 164.3 | 228.1 | 185.0 | 238.0 | 269.0 |
| τ1 | 0.17 | 0.30 | 0.7 | 0.32 | 0.34 | 0.30 | 0.35 | 0.34 | 0.28 |
| τ2 | 54.9 | 44.9 | 2.2 | 64.7 | 50.6 | 4.5 | 52.8 | 9.76 | 1.66 |
With respect to the porous Ni–Fe–Mo–C–LaNi5 electrode, from Table 3 it is clear that HF time constant, τ1 changes very slightly with both overpotential and temperature, maintaining nearly this parameter in the same order of magnitude, which is usually reported for HF studies on porous electrodes.67 For the LF semicircle, R2 decreases with the overpotential and τ2 decreasing, and that τ2 varies until two orders of magnitude with overpotential. This behaviour is consistent with the charge transfer phenomenon.
The dependence of Cdl as a function of the applied overpotential for the investigated electrodes is presented in Fig. 10. A slow increase of Cdl with increasing the applied overpotential is observed in different temperature, indicating that the formation of gaseous hydrogen in the pores does not decrease the real surface area.68,69 Thence, the increase of Cdl values with increasing the overpotential can be correlated with the onset of the faradaic reactions of hydrogen evolution.70,71 It therefore reflects the electrocatalytic activity of the electrode material, which is in agreement with the polarization curves in Fig. 7. Accordingly, the lowest Cdl values were found on the porous Ni–Fe–Mo–C–LaNi5 electrode in 303 K, while the highest values were obtained on the porous Ni–Fe–Mo–C–LaNi5 electrode in 353 K, indicating that this catalyst yields the best catalytic efficiency towards H2 evolution in high temperature.
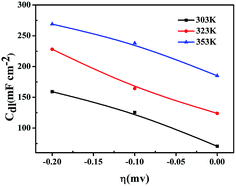 | ||
| Fig. 10 Trend of the double layer capacitance, Cdl, as a function of the HER overpotential for porous Ni–Fe–Mo–C–LaNi5 electrode in 6 M KOH solution at: 303 K, 333 K and 353 K. | ||
Besides the information on the kinetics of the HER, EIS results can be also used to estimate the real surface area of electrocatalytic materials. This is important since by knowing the real electrochemically active area of the catalyst, therefore, it is possible to differentiate the HER intrinsic activity of the materials, by subtracting for the surface area effect. Considering a value of 20 μF cm−2 for the double layer capacitance, Cdl, of a smooth nickel surface area, in term of surface roughness factor (Rf), may be estimated by comparing the Cdl related to the HER charge-transfer kinetics of porous/rough and smooth electrodes.72,73 The plots of the electrode surface roughness factors as function of the HER overpotential are displayed in Table 4.
| Electrode | Cdl,ave (mF cm−2) | Rf |
|---|---|---|
| Ni–Fe–Mo–C–LaNi5 | ||
| 303 K | 118 | 5900 |
| 323 K | 172 | 8600 |
| 353 K | 231 | 11![[thin space (1/6-em)]](https://www.rsc.org/images/entities/char_2009.gif) 550 550 |
| Ni | 85 | 4250 |
The Rf values of the latter are in agreement with the small porosity shown in Fig. 2. According to Fig. 11, it can be concluded that porous Ni–Fe–Mo–C–LaNi5 electrode, with an intermediate Rf value, manifests the higher apparent and intrinsic catalytic activities (the low Ea and |η100| values) as a result of the synergism between the properties of Ni, Fe, Mo, C and LaNi5 in this composition range and the synthesis conditions.
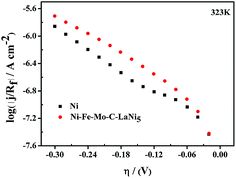 | ||
| Fig. 11 Linear Tafel polarization curves recorded on Ni–Fe–Mo–C–LaNi5 and Ni electrocatalytic in 6 M KOH solution at 323 K, corrected considering the surface roughness factor, Rf. | ||
The increased intrinsic activity of porous Ni–Fe–Mo–C–LaNi5 electrode in comparison to pure Ni is higher. It is well known that the HER electrocatalytic activity of Ni can be improved by the addition of other metals into the alloy. A general conclusion found in the literature is that the intrinsic catalytic activity for the HER is related to the electronic structure of metals, although any explicit and comprehensive explanation has not yet been given.
3.4. Mechanism of hydrogen evolution activity of porous Ni–Fe–Mo–C–LaNi5 electrode
The strength of the H2O–M and H–M interactions seems to be very important in discussions about surface electrocatalytic effect. In the HER mechanism, the H2O–M interaction should be strong enough to favor the splitting of the water molecule; conversely, the H–M interaction should not be so strong as to favor hydrogen desorption. In fact, it can be seen from the well-known electrocatalytic “volcano plots” for the HER on the transitional metal, that Fe and Mo exhibit higher electrocatalytic activity because of their intermediate M–H bonding strength. With this assumption, it can be accepted that the Volmer step should be the RDS due to its high-energy requirement in the adsorption and splitting of the water molecule.As the above discussion, the HER of the porous Ni–Fe–Mo–C–LaNi5 electrode consists on the Volmer reaction and subsequently Tafel reaction. So the porous Ni–Fe–Mo–C–LaNi5 electrode has an intermediate M–H bonding strength and results in the improved electrocatalytic activity for HER. For HER, the Volmer step (the discharge of water molecules) needs paired d-orbital electrons, for instance, Ni d-orbital, to facilitate electron transfer to the water molecule and subsequent cleavage of the O–H bond. For the next step to succeed, semi-empty d-orbitals must be available, for instance, Mo d-orbitals and Fe d-orbitals, to facilitate the M–H desorption. From this point of view, the electrocatalytic effect observed for HER on porous Ni–Fe–Mo–C–LaNi5 surfaces should be enhanced by the appropriate combination of d8-orbitals of Ni with d6-orbitals of Fe and d5 s1-orbitals of Mo. Volmer step was improved pronouncedly due to the availability of Mo and Fe semi-empty d-orbitals, which facilitates splitting of the water molecule and MHads formation. LaNi5 enhances the H adsorption on the electrode surface and mainly plays a role of hydrogen storage for hydrogen evolution reaction. Besides, the Ni–Fe–C electrodes with optimum catalytic activity for the HER between carbon content and intrinsic activity are that carbon content plays an important role in intrinsic activity of Ni–Fe–C electrodes discussed by L. J. Song.74 It was found that Ni–Fe–C cathodes prepared by electrodeposition had high catalytic activity and stability for the HER in sodium hydroxide solution, in which the observed activity was mainly due to the intrinsic activity induced by carbon embedded into Ni–Fe matrix.37–39 Therefore, this is due to an improved intrinsic activity of the material, which was explained on the basis of the synergism among the catalytic properties of Ni and of Fe, Mo, and induced by C embedded into Ni–Fe matrix and Ni–Fe–Mo matrix. LaNi5 enhances the H adsorption on the electrode surface and mainly plays a role of hydrogen storage for hydrogen evolution reaction.
4. Conclusions
The electrocatalytic efficiency of a porous Ni–Fe–Mo–C–LaNi5 electrode material obtained by reactive synthesis of Ni, Fe, Mo, C and LaNi5 elemental powders in 6 M KOH has been investigated using cathodic polarization and impedance spectroscopy techniques. The Tafel slope of best-performing porous Ni–Fe–Mo–C–LaNi5 alloy is 140 mV dec−1, implying that the RDS for the HER is the proton discharge electrosorption (Volmer reaction). The value for the exchange current density is 9.9 × 10⁻⁴ A cm−2 at elevated temperature. The roughness factor is 8600, which is obtained for the HER on studied electrodes in 6 M KOH solution at 323 K temperature using the EIS data and CNLS approximation method. Porous Ni–Fe–Mo–C–LaNi5 electrode yields the higher overall electrocatalytic activity in the HER, mainly attributed to the increased surface area. Avoiding the surface roughness factor effect, porous Ni–Fe–Mo–C–LaNi5 electrode manifestes an intrinsic electrocatalytic activity similar to that reported for the pure Ni electrode. This phenomenon can be explained by a proper synergism among the catalytic properties of nickel and of Fe, Mo, and induced by C embedded into Ni–Fe matrix and Ni–Fe–Mo matrix. LaNi5 enhances the H adsorption on the electrode surface and mainly plays a role of hydrogen storage for hydrogen evolution reaction.Acknowledgements
The authors are grateful for the financial support from the NSF of China (51504213, 51401175, 51271158) and the Project of Hunan province (2015WK3021, 2015JJ3123, 17B250).References
- H. B. Gray, Nat. Chem., 2009, 1, 7 CrossRef CAS PubMed.
- M. Dresselhaus and I. Thomas, Nature, 2001, 414, 332–337 CrossRef CAS PubMed.
- J. A. Turner, Science, 2004, 305, 972–974 CrossRef CAS PubMed.
- K. Zeng and D. Zhang, Prog. Energy Combust. Sci., 2010, 36, 307–326 CrossRef CAS.
- M. G. Walter, E. L. Warren, J. R. McKone, S. W. Boettcher, Q. Mi, E. A. Santori and N. S. Lewis, Chem. Rev., 2010, 110, 6446–6473 CrossRef CAS PubMed.
- Y. Miao, L. Ouyang, S. Zhou, L. Xu, Z. Yang, M. Xiao and R. Ouyang, Biosens. Bioelectron., 2014, 53, 428–439 CrossRef CAS PubMed.
- P. M. Quaino, M. R. Gennero de Chialvo and A. C. Chialvo, Electrochim. Acta, 2007, 52, 7396–7403 CrossRef CAS.
- Y. Petrov, J.-P. Schosger, Z. Stoynov and F. de Bruijn, Int. J. Hydrogen Energy, 2011, 36, 12715–12724 CrossRef CAS.
- U. C. Lacnjevac, B. M. Jovic, V. D. Jovic and N. V. Krstajic, J. Electroanal. Chem., 2012, 31, 677–680 Search PubMed.
- L. Bai, D. A. Harrington and B. E. Conway, Electrochim. Acta, 1987, 32, 1713–1731 CrossRef CAS.
- D. E. Hall, J. Electrochem. Soc., 1982, 129, 310–315 CrossRef CAS.
- C. Graves, S. D. Ebbesen, M. Mogensen and K. S. Lackner, Renewable Sustainable Energy Rev., 2011, 15, 1–23 CrossRef CAS.
- G. Gahleitner, Int. J. Hydrogen Energy, 2013, 38, 2039–2061 CrossRef CAS.
- B. Conway and B. Tilak, Electrochim. Acta, 2002, 47, 3571–3594 CrossRef CAS.
- W. Sheng, H. A. Gasteiger and Y. Shao-Horn, J. Electrochem. Soc., 2010, 157, B1529–B1536 CrossRef CAS.
- M. Gong, D.-Y. Wang, C.-C. Chen, B.-J. Hwang and H. Dai, Nano Res., 2016, 9, 28–46 CrossRef CAS.
- P. Los, A. Rami and A. Lasia, J. Appl. Electrochem., 1993, 23, 135–140 CrossRef CAS.
- N. Krstajić, V. Jović, L. Gajić-Krstajić, B. Jović, A. Antozzi and G. Martelli, Int. J. Hydrogen Energy, 2008, 33, 3676–3687 CrossRef.
- C. Lupi, A. Dell'Era and M. Pasquali, Int. J. Hydrogen Energy, 2009, 34, 2101–2106 CrossRef CAS.
- S. H. Hong, S. H. Ahn, J. Choi, J. Y. Kim, H. Y. Kim, H.-J. Kim, J. H. Jang, H. Kim and S.-K. Kim, Appl. Surf. Sci., 2015, 349, 629–635 CrossRef CAS.
- Y. Zhu, X. Zhang, J. Song, W. Wang, F. Yue and Q. Ma, Appl. Catal., A, 2015, 500, 51–57 CrossRef CAS.
- I. Paseka, Electrochim. Acta, 2001, 47, 921–931 CrossRef CAS.
- Q. Han, K. Liu, J. Chen and X. Wei, Int. J. Hydrogen Energy, 2003, 28, 1207–1212 CrossRef CAS.
- T. V. Vineesh, S. Mubarak, M. G. Hahm, V. Prabu, S. Alwarappan and T. N. Narayanan, Sci. Rep., 2016, 6, 31202 CrossRef CAS PubMed.
- N. Krstajić, U. Lačnjevac, B. Jović, S. Mora and V. Jović, Int. J. Hydrogen Energy, 2011, 36, 6450–6461 CrossRef.
- L. Vázquez-Gómez, S. Cattarin, P. Guerriero and M. Musiani, Electrochim. Acta, 2007, 52, 8055–8063 CrossRef.
- D. A. Dalla Corte, C. Torres, P. dos Santos Correa, E. S. Rieder and C. de Fraga Malfatti, Int. J. Hydrogen Energy, 2012, 37, 3025–3032 CrossRef CAS.
- Z. Chen, Z. Ma, J. Song, L. Wang and G. Shao, RSC Adv., 2016, 6, 60806–60814 RSC.
- Z. Zheng, N. Li, C.-Q. Wang, D.-Y. Li, F.-Y. Meng and Y.-M. Zhu, J. Power Sources, 2013, 222, 88–91 CrossRef CAS.
- Z. Chen, Z. Ma, J. Song, L. Wang and G. Shao, J. Power Sources, 2016, 324, 86–96 CrossRef CAS.
- D. Ansovini, C. J. J. Lee and C. S. Chua, et al., J. Mater. Chem. A, 2016, 4, 25 Search PubMed.
- L. Yu, T. Lei and B. Nan, et al., RSC Adv., 2015, 5(100), 82078–82086 RSC.
- I. Arul Raj, Int. J. Hydrogen Energy, 1992, 17, 413 CrossRef.
- I. Arul Raj, Appl. Surf. Sci., 1992, 59, 245 CrossRef.
- I. Arul Raj, J. Appl. Electrochem., 1992, 22, 471 CrossRef.
- W. Hu, Y. Zhang, D. Song, Z. Zhou and Y. Wang, Mater. Chem. Phys., 1995, 41, 141 CrossRef CAS.
- S. Meguro, T. Sasaki, H. Katagiri, H. Habazaki, A. Kawashimac and T. Sakaki, et al., J. Electrochem. Soc., 2000, 147, 3–9 CrossRef.
- K. Hashimoto, M. Yamasaki, S. Meguro, H. Habazaki, A. Kawashima and T. Sasaki, et al., Corros. Sci., 2002, 44, 71–86 CrossRef.
- R. K. Shervedani and A. R. Madram, Electrochim. Acta, 2007, 53, 26–33 CrossRef.
- K. Machida and M. Enyo, Electrochim. Acta, 1984, 29, 1723 CrossRef.
- Y. Xiao, Y. Liu, Z. Tang, L. Wu, Y. Zeng and Y. Xu, et al., RSC Adv., 2016, 6, 51096–51105 RSC.
- Y. Jiang, Y. H. He, N. P. Xu, J. Zou, B. Y. Huang and C. T. Liu, Intermetallics, 2008, 16, 27–32 CrossRef.
- P. Los, A. Rami and A. Lasia, J. Appl. Electrochem., 1993, 23, 35–40 CrossRef.
- L. L. Chen and A. Lasia, J. Electrochem. Soc., 1991, 138, 1–8 CrossRef.
- L. L. Chen and A. Lasia, J. Electrochem. Soc., 1992, 139, 58–64 CrossRef.
- J. O. Bockris and A. K. N. Reddy, Modern electrochem, Kluwer/Plenum Press, New York, 2nd edn, 2000 Search PubMed.
- L. L. Chen and A. Lasia, J. Electrochem. Soc., 1992, 139, 4–9 Search PubMed.
- P. Los, A. Rami and A. Lasia, J. Appl. Electrochem., 1993, 23, 35–40 CrossRef.
- L. L. Chen and A. Lasia, J. Electrochem. Soc., 1991, 138, 1–8 CrossRef.
- A. Rami and A. Lasia, J. Appl. Electrochem., 1992, 22, 76–82 CrossRef.
- A. C. D. Angelo and A. Lasia, J. Electrochem. Soc., 1995, 142, 3–9 CrossRef.
- Southampton Electrochemistry Group, Instrumental methods in electrochemistry, Wiley, New York, 1985 Search PubMed.
- J. G. Highfield, E. Claude and K. Oguro, Electrochim. Acta, 1999, 44, 5–14 CrossRef.
- M. P. M. Kaninski, V. M. Nikolic, T. N. Potkonjak, B. R. Simonovic and N. I. Potkonjak, Appl. Catal., A, 2007, 321, 3–9 Search PubMed.
- A. Metikos-Hukovic, Z. Grubac, N. Radic and A. Tonejc, J. Mol. Catal. A: Chem., 2006, 249, 72–80 CrossRef.
- F. Rosalbino, S. Delsante, G. Borzone and E. Angelini, Int. J. Hydrogen Energy, 2008, 33, 696–703 Search PubMed.
- J. García-Antón, E. Blasco-Tamarit, D. M. García-García, V. Guiñón-Pina, R. Leiva-García and V. Pérez-Herranz, ESP. Pat., 03389, 2008.
- M. Wang, Hunan university (HNU), 2014.
- R. K. Shervedani and A. R. Madram, Electrochim. Acta, 2007, 53, 426–433 CrossRef CAS.
- G. Wu, N. Li and C. S. Dai, et al., Mater. Chem. Phys., 2004, 83, 307–314 CrossRef CAS.
- L. L. Chen and A. Lasia, J. Electrochem. Soc., 1991, 138, 1–8 CrossRef.
- B. Losiewicz, A. Budniok, E. Rowinski and A. Lasia, Int. J. Hydrogen Energy, 2004, 29, 45–57 CrossRef.
- L. Birry and A. Lasia, J. Appl. Electrochem., 2004, 34, 35–49 CrossRef.
- B. Borresen, G. Hagen and R. Tunold, Electrochim. Acta, 1997, 42, 1–9 CrossRef.
- J. Kubisztal, A. Budniok and A. Lasia, Int. J. Hydrogen Energy, 2007, 32, 1211–1218 CrossRef CAS.
- G. J. Brug, A. L. G. Vandeneeden, M. Sluytersrehbach and J. H. Sluyters, J. Electroanal. Chem., 1984, 176, 72–95 Search PubMed.
- L. Vazquez-Gomez, S. Cattarin, P. Guerriero and M. Musiani, J. Electroanal. Chem., 2009, 634, 2–8 CrossRef.
- J. R. MacDonald, J. Schooman and A. P. Lehner, J. Electroanal. Chem., 1982, 131, 77 CrossRef CAS.
- J. Divisek, J. Electroanal. Chem., 1986, 214, 615 CrossRef CAS.
- L. Chen and A. Lasia, J. Electrochem. Soc., 1992, 139, 3458 CrossRef CAS.
- H. Alemu and K. Jüttner, Electrochim. Acta, 1988, 33, 1101 CrossRef CAS.
- A. Kellenberger, N. Vaszilcsin, W. Brandl and N. Duteanu, Int. J. Hydrogen Energy, 2007, 32, 58–65 CrossRef.
- J. Kubisztal, A. Budniok and A. Lasia, Int. J. Hydrogen Energy, 2007, 32, 1–8 CrossRef.
- L. J. Song and H. M. Meng, Int. J. Hydrogen Energy, 2010, 35, 10060–10066 CrossRef CAS.
| This journal is © The Royal Society of Chemistry 2017 |

