 Open Access Article
Creative Commons Attribution 3.0 Unported Licence
Surface-engineered mesoporous silica particles with luminescent, cytocompatible and targeting properties for cancer cell imaging†
Motohiro Tagaya *a,
Shigeaki Abe‡
b,
Satoshi Motozuka‡c,
Kota Shibad,
Taro Takemurae,
Ikuo Hayashif and
Yoshimitsu Sakaguchif
aDepartment of Materials Science and Technology, Nagaoka University of Technology, 1603-1 Kamitomioka, Nagaoka, Niigata 940-2188, Japan. E-mail: tagaya@mst.nagaokaut.ac.jp
bGraduate School of Dental Medicine, Hokkaido University, Sapporo 060-8586, Japan
cDepartment of Mechanical Engineering, Gifu National College of Technology, 2236-2 Kamimakuwa, Motosu, Gifu 501-0495, Japan
dWorld Premier International Research Center Initiative (WPI), International Center for Materials Nanoarchitectonics (MANA), National Institute for Materials Science (NIMS), 1-1 Namiki, Tsukuba, Ibaraki 305-0044, Japan
eNanotechnology Innovation Station, National Institute for Materials Science (NIMS), 1-2-1 Sengen, Tsukuba, Ibaraki 305-0047, Japan
fGraduate School of Engineering, Nagoya University, Furocho, Chikusa-ku, Nagoya 464-8603, Japan
First published on 1st March 2017
Abstract
To develop a novel cancer cell imaging approach, we fabricated surface-engineered mesoporous silica (MPS) particles with multi-functionalities. Specifically, mechanochemically-treated europium(III)-doped MPS (Eu:MPS) particles were prepared, and a folate N-hydroxysuccinimidyl ester (FA-NHS) molecule was immobilized on the particle surface as a targeting ligand for specific types of cells. With the mechanochemical treatment, the siloxane bonds were changed to show better luminescence quantum efficiency as revealed by 29Si-NMR and photoluminescence spectroscopy, suggesting interaction changes between the silica framework structures and the doped Eu ions. Furthermore, the mechanochemically-treated particles immobilized with FA-NHS specifically bind to the cancer cells and the subsequent uptake by the cells was in situ observed using time-lapse optical microscopy. The particles did not exhibit any toxicity in the cellular proliferation stages. The particles after the binding and uptake also showed intense luminescence from the cells at a culture time of 24 h, demonstrating a clear imaging ability along with all the cellular shapes. Therefore, the present surface-engineered luminescent particles will be used for specific cancer targeting and imaging purposes.
Introduction
The preparation of superior particles for specific cancer cell imaging is important in biomedical fields. Targeting to the cells through specific ligands or utilizing antibodies depends on the ability of the targeting reagents to selectively bind to the cell surfaces and to subsequently trigger receptor-mediated endocytosis.1 Thus studies combining targeting and imaging in one system are desired using a synthetic particle system.The particles derived from silica sources have been synthesized and structurally designed for developing cytocompatible platforms in cell culture systems.2,3 After the discovery of mesostructured silicate, mesoporous silicas (MPSs) prepared by a supramolecular templating method possess attractive features such as well-defined and controllable pore size, large surface area, and reactive surface.4–6 The immobilization capacity of the mesopores for various functional molecules is one of the attractive features, accompanied by controlling the structural properties on a nanometer scale such as the pore and particle sizes as well as framework structures.7–17 The MPS particles also lead to the immobilization of biofunctional molecules in the mesopore, and the surface modification for controlling the silica-molecule56 as well as silica-cell interactions has been attractive for biomedical applications.18–21
The preparation of the silica-based hybrids22,23 and the MPS particles having imaging properties for bio-functions24–27 has been reported. Because of the suitable properties for such applications, highly-luminescent species of quantum dot in the mesopores have emerged for investigating the reactivity with cells as well as the incorporated heterogeneous states;28–30 however, heteroelements (Cd2+, Hg2+, Se2+, etc.) or guest species for the luminescence in the most cases cause often toxic effects on the cell viability. For in vivo applications, some issues of rapid color degradation, excitation by phototoxic light, and use of cytotoxic elements should be solved. As a further strategy, the external surface and silica frameworks of MPS should be functionalized as the targeting and imaging, respectively. In our previous reports, luminescent europium(III) (Eu3+)-doped mesoporous silica (Eu:MPS) was synthesized,31,32 and the Eu3+-doped silica frameworks enabled the accommodation of various functional molecules on the internal pore as well as the immobilization with targeting ligands only on the external surfaces,33–35 suggesting the possibility of specific cellular binding and uptake systems. The enhanced photofunctions in the particle with mesoporous structures for biomedical applications and effective immobilization on the surfaces have not yet been investigated.
To improve the environmental sites of doped luminescent species such as Eu3+ ions, the activated silica surfaces of the mesopores can be mechanochemically prepared; the near-surface silica structure produces the densely O-rich states. We have reported the preparation of functionalized metal oxides by means of a mechanochemical surface treatment,36–38 which is a very powerful tool to modify the solid state functions (e.g., reactivity with heteroatoms). The goal to investigate the mechanochemical reactions is to find the major factors that determine the favorable photo-excited states of the doped luminescent species as well as to reveal the possibilities of regulating the silica framework in the mesostructures.39,40 For these reasons, we have focused on the controllable silica framework structures which can be interpreted as the formation changes of the siloxane and silanol groups with unpaired electrons generated,41,42 and they are expected to provide novel activation properties by the O atoms to effectively improve the doped luminescent heteroatoms in the inner silica and subsequent functional molecular immobilization on the outer silica surfaces.
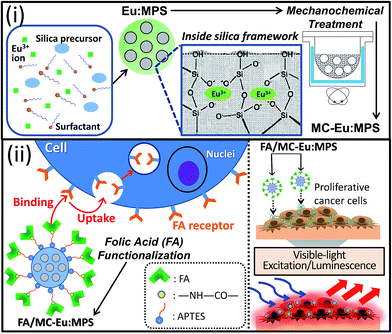
In this study, the luminescent Eu:MPS particles were synthesized in a sol–gel process, which enables Eu3+ ions to be homogeneously dissolved to prevent aggregation in the silica frameworks. The Eu:MPS particles were mechanochemically activated to control the photoluminescence properties through the modification of silica framework structures as shown in Scheme 1. Then, a folic acid (FA) molecule, which has been known as a targeting reagent for cancer cells,43 was covalently immobilized on the particles by a mediation of 3-aminopropyltriethoxysilane (APTES). Furthermore, in vitro cytotoxicity and imaging ability of the FA-functionalized particles for MG-63 and HeLa cancer cells were investigated. The effective targeting to the cells based on the surface-engineered luminescent particles was demonstrated under the visible-light excitation/luminescence system.
Experimental
Synthesis of the Eu:MPS particles
Eu3+-doped MPS particles were synthesized according to our previous reports.31,32 Briefly, 1.0 g (2.75 mmol) of cetyltrimethylammoniumbromide (CTAB: Wako Co., Ltd.), 225 g of ultrapure water and 3.5 mL of 2.0 M sodium hydroxide (NaOH: Wako Co., Ltd.) solution were stirred at 80 °C for 30 min. Then, 5.515 mL (24.7 mmol) of tetraethoxysilane (TEOS: Tokyo Kasei Industries Co., Ltd.) and 15 mL of an Eu3+ aqueous solution containing 0.452 g of EuCl3·6H2O (Kanto Chemical Co., Ltd.) at the initial molar concentration of Eu3+ to Si of 5.0 mol% were added under stirring at 80 °C for 2 h. The resultant turbid solution was filtered, and the solid product was washed with ultrapure water and ethanol, followed by drying in vacuum for 4 h. The CTAB template was completely removed by the calcination at 550 °C for 6 h. The final product was abbreviated as Eu:MPS. The amount of doped Eu3+ was measured by an inductively coupled plasma optical emission spectrometer (ICP-OES: Leeman Labs, INC U.S.A., Prodigy ICP), suggesting that the molar concentration of Eu to Si was 5.4 ± 2.1 mol%.Mechanochemical milling treatment of the Eu:MPS particles
A stainless steel vessel mounted on a centrifugal equipment (Nisshin Giken Co., Ltd., NEV-MA-8) was swung at the rate of 40.2 rad s−1 for 2 h as shown in the Fig. S1(a and b), ESI.†39 Twenty bearing steel balls (SUJ-2) with the different diameters of 4.0, 6.4 and 9.8 mm were used as the milling media for 0.1 g of the Eu:MPS particles. The balls move in a circular path against the inside wall of the vessel pressed against the wall by the centrifugal force. When the balls compress the trapped samples, the kinetic energy transfer from the medium ball to the particles occurs. The induced forces by the mechanochemical reaction was 10, 45 and 153 mN, and the resultant particles were abbreviated as MC1-Eu:MPS, MC2-Eu:MPS, and MC3-Eu:MPS, respectively. In this case, the centrifugal force exerted on the medium is classified into two forces in the Fig. S1(c), ESI;† i.e., a compression force exerted on the particles and a shear force exerted between the particles. The compression force is exerted into the depth of the particle, whereas the shear force acts only on the particle surface.Synthesis of folate N-hydroxysuccinimidyl ester (FA-NHS)
FA-NHS was prepared according to our previous reports.35,44 Briefly, 1.0 g of FA (FA: Wako Chemical Co., Ltd.) was dissolved in 40 mL of dimethyl sulfoxide (DMSO: Wako Chemical Co., Ltd.) containing 0.5 mL of triethylamine (Wako Chemical Co., Ltd.). A 0.52 g (2.2 equiv.) of N-hydroxysuccinimide (NHS: Wako Chemical Co., Ltd.) and 0.50 g (1.1 equiv.) of dicyclohexylcarbodiimide (DCC: Wako Chemical Co., Ltd.) were added to the solution under stirring in the dark for 18 h. The turbid solution was filtered to remove the precipitated by-products. The colature was evaporated in vacuum to remove triethylamine. The resultant solution clearly contains FA-NHS, which was confirmed by a 1H-NMR analysis.Immobilizations of APTES and FA-NHS on the particles
According to our primary report,33 the APTES immobilization was conducted by stirring the Eu:MPS (250 mg) dispersed into 12 mL of an HCl aqueous solution with the mixed solution of APTES (0.78 mL) and ethanol (5 mL) at 37 °C for 1 h. The suspension was filtered, and the solid product was washed by ethanol, followed by drying in vacuum to obtain the APTES-immobilized Eu:MPS (APTES/MC-Eu:MPS). Then, FA-NHS immobilization was conducted by stirring the APTES-Eu:MPS (150 mg) dispersed in 25 mL of a phosphate buffer (PB: pH = 7.0, phosphate ion concentration of 50 mM) and 12 mL of a DMSO solution containing the FA-NHS at 37 °C. The solid product was collected by filtration, washed with ultrapure water and dried in vacuum. The immobilization amount of FA-NHS was controlled by three different initial concentrations; the equilibrium concentrations in the solution were 0.257, 1.24 and 2.99 mM. The ideal amount of the FA-NHS immobilized on each product was 39, 61 and 83 μmol (g of APTES-Eu:MPS)−1, which were abbreviated as FA1/, FA2/ and FA3/MC-Eu:MPS, respectively. The actual amount was photospectroscopically estimated to be 38.9 μmol g−1 for FA1-Eu:MPS, 60.8 μmol g−1 for FA2-Eu:MPS and 83.0 μmol g−1 for FA3-Eu:MPS. Taking account of the monomeric molecular area of 2.6 nm2, the surface occupation rate of FA molecule is less than 100%, indicating the dispersion states among the FA molecular interactions without forming the aggregation.Characterization of the particles
The infrared spectra were recorded on a Fourier transform infrared spectrometer (FT-IR: JASCO Co., Ltd., FT/IR-4600ST). All the FT-IR spectra were measured with a KBr pellet containing a small amount of sample powder. The weight ratio of sample to KBr was 10. All the spectra were recorded after subtracting a background spectrum of pristine KBr. The measurement range, sampling time and resolution were 4000–500 cm−1, 100 and 2.0 cm−1, respectively. The X-ray diffraction (XRD) patterns were recorded by a Smart Lab (RIGAKU Co., Ltd.) using monochromatized CuKα radiation. The solid-state 29Si DD/MAS NMR (solid-state) spectra, which directly excite the Si atoms to exhibit the high reliability of the spectra, were recorded on a Bruker Avance 300wbs spectrometer with a 7 mm rotor (5k rpm) at the resonance frequency of 59.62 MHz., 4.5 ms pulse and 60 s delay time. The chemical shifts for the signals were determined by that of hexamethylcyclotrisiloxane as an external standard at −9.55 ppm. The ratios of the detected peak areas in the spectra were calculated. The ordered nanostructures of the particles were observed using a transmission electron microscope (TEM: JEOL Co., Ltd., JEM-1400). The samples were drop-cast on a carbon-coated Cu grid and the grid was fully dried before the measurements. The nitrogen adsorption and desorption isotherms were measured at −196 °C by a BELSORP-mini II instrument (Microtrac/BEL Co., Ltd.). Prior to the measurement, the samples were degassed under vacuum at 120 °C for 4 h. The surface area was evaluated by the Brunauer–Emmett–Teller (BET) method.51 The APTES and FA molecular surface occupations were calculated on the basis of the molecular areas of 0.38 nm2 and 1.65 nm2, respectively, which were verified by a molecular drawing software (CS Chem3D Pro). Taking into account the APTES and FA molecular sizes, the pore size of Eu:MPS (approx. 2.4–2.7 nm) is large enough to accommodate the APTES into the mesopores; the internal mesopore size becomes approx. 0.5 nm after the immobilization of monolayer APTES. Then, the FA can no longer be incorporated into the mesopores, indicating the FA functionalization only on the external surfaces as shown in the Scheme S1, ESI.†35The photoluminescence properties were evaluated by a photoluminescence spectroscopy and microscopy. The excitation and luminescence spectra were also recorded by a FP-8500 spectrophotometer (JASCO Co., Ltd.) with the monitored luminescence at 611 nm and excitation wavelength at 464 nm, respectively, at room temperature (atmosphere: air, excitation-slit/detection-slit: 2 nm/2 nm, measure time: 0.1 s, step width: 1.0 nm, light cut filter on the detection side: λcut < 515 nm). The luminescence intensities centered at the top of 591 and 611 nm, which are abbreviated as I591 and I611, were calculated by the integrated intensity areas in the range of 580–600 nm (assigned to 5D0 → 7F1 of Eu3+) and 600–640 nm (assigned to 5D0 → 7F1 of Eu3+) based on the Voigt-function fitting at the peak tops, and the ratios of I611 to I550 (I611/I550) were calculated. The internal quantum efficiency (ηint) was measured by the above spectrophotometer using an integrating sphere (internal diameter: 60 mm). The incident, scattering, and luminescence light intensity spectra were measured. Their integrated peak intensities were calculated and abbreviated as I0, I1 and I2, respectively, as shown in the Scheme S2, ESI.† Thus, ηint was calculated by the following eqn (1).
| ηint = I2/(I0 − I1) × 100 | (1) |
The decay kinetics was also recorded by the above spectrophotometer with the same excitation and luminescence wavelength, which can be explained with an exponential function. From a Xe flash lamp (150 W), the decay of the luminescence intensity was detected. The decay plot time was 0.05 ms using a successive rotation chopper. The decay time was calculated by a numerical fitting to an exponential function based on the eqn (2).
I(t) = I(0)![[thin space (1/6-em)]](https://www.rsc.org/images/entities/char_2009.gif) exp(−t/τ) exp(−t/τ)
| (2) |
Cell culture
Human Osteosarcoma MG-63 cells (300441-SF) and Human (HeLa) cervical carcinoma cells (RCB0007) as the cell lines, which were provided by Cell Lines Service and Riken BioResource Center, respectively, were separately cultured in a plastic cell culture flask with the area of 75 cm2 (BD Bioscience, USA.). The flask contained 15 mL of fetal bovine serum (FBS: product no. 12603C, lot no. 6D0975, SAFC Bioscience Co., Ltd.) dispersed into alpha minimum essential medium (αMEM: Invitrogen Co., Ltd.) for MG-63 cells and Dulbecco's minimum essential medium (DMEM: Invitrogen Co., Ltd.) for HeLa cells at the concentration of 10 vol% of FBS (10% FBS/MEM). The two types of cells were used as the cervical cancer model in this study. The cells are known to express the folate receptor-α(FR-α),45 which can effectively bind with FA molecules. The cells were incubated at 37 °C in a humidified atmosphere of CO2 (5%), and subcultured using 1 mL of 0.05 w/v% trypsin-0.053 M-ethylenediaminetetraacetate (trypsin-EDTA: No. 204-16935, Wako Co., Ltd.). After being washed with 15 mL of PBS and treated with 1 mL of the trypsin-EDTA for 5 min at 37 °C, the cells were homogeneously dispersed in 15 mL of PBS, separated by centrifugation (2000 rpm, 2 min), and dispersed in 15 mL of 10% FBS/MEM again. The number of cells in the suspension was counted and adjusted at the desired seeding densities in the following procedure.Evaluation of cytocompatibility and uptake properties by adding FA/MC-Eu:MPS particles
The cell suspensions were added and cultured at the seeding area density of 8000 cells per cm2 on a poly(styrene) culture well plate (TCPS: BD Falcon™ Co., Ltd.) for evaluating the cell viability, and then cultured. According to the established procedures,35,46,47 the cell viability was evaluated using the CellTiter-Glo® luminescent cell viability assay (CellTiter-Glo assay kit, Promega Co., Ltd., U.S.A.) for MG-63 cells46 and MTT assay method by 3-(4,5-dimethylthiazol-2-yl)-2,5-diphenyltetrazolium bromide (Cayman Chemical Co., Ltd., MTT reagent) for HeLa cells.35,47 At the culture time of 4 h, the MC-Eu:MPS or FA/MC-Eu:MPS particles dispersed into 10% FBS/MEM was added to the adhered cell surfaces. The final particle concentrations were adjusted to 0, 0.01, 0.1, 1.0, 5.0 and 10 mg mL−1 of MC3-EuMPS, FA1/MC3-Eu:MPS, FA2/MC3-Eu:MPS and FA3/MC3-Eu:MPS for evaluating the MG-63 cells and 50, 100 and 200 mg mL−1 of MC3-EuMPS, FA2/MC3-Eu:MPS and FA3/MC3-Eu:MPS particles for the HeLa cells. Then, an additional cell culture was performed. For the culture times of 24 h for MG-63 and 48 h for HeLa cells, the cell viability in the well plate was measured and compared. Before the measurements by photospectrometer, all the cell surfaces were washed with PBS twice. Then, the viability was evaluated by the absorbance of the resulting solution using a microplate spectrophotometer (Power Scan®HT, DS Pharma Biomedical Co., Ltd.), and the absorbance of 1 mL of only 10% FBS/DMEM without adding the particles was subtracted as the blank value. The average value between ten samples was used, and the maximum absorbance in all the samples was set at 100%.At the culture times of 4, 12 and 24 h for the MG-63 cells, i.e. particle-reaction times of 0, 8 and 20 h after adding the FA2/MC3-EuMPS and FA3/MC3-Eu:MPS particles at the concentration of 10 mg mL−1, the particle uptake states by the cultured MG-63 cells were in situ observed at the same position by a time-lapse approach, which was done every 3 min for 24 h at the Nikon imaging center at Hokkaido university. The results of the time-lapse observation were treated using the digital image analyzing software, MetaMorph (Molecular Devices, U. S. A.).
The detailed uptake states of the cultured cells with/without FA2/MC3-Eu:MPS particles were observed by a scanning electron microscopy (SEM: Hitachi S-4800, Japan). Before the SEM observation for the cellular morphologies, the cultured cells were fixed with 3.7 vol% formaldehyde in PBS for 10 min at room temperature. Then, the cells were washed twice with 1 mL of PBS before and after formaldehyde fixation. After the fixation, the cultured cells were soaked in a series of baths comprising 1 mL of EtOH/ultrapure water mixtures at the concentration of 50, 60, 70, 80, 90 and 100 vol% with a soaking time of 5 min in each bath. The supernatant was then exchanged three times with t-butyl alcohol at 37 °C for 30 min per time, kept at 4 °C for 30 min, and finally freeze dried for 5 h.
Evaluation of cancer cell imaging ability
The HeLa cell suspensions were added and cultured at the seeding area density of 8000 cells per cm2 on a TCPS with glass bottom for observing the cellular reactions. At the culture time of 4 h, the MC3-EuMPS and FA2/MC3-Eu:MPS particles dispersed into 10% FBS/DMEM were added to the adhered cell surfaces to adjust the final particle concentration (i.e., 50, 100 and 200 mg mL−1), and then cultured. The cultured cells were observed by a differential interference and fluorescent confocal laser scanning microscopy (Leica Co., Ltd.). Both images at the same position were merged into one image. The excitation and observation wavelengths were 465 nm and 550–650 nm. At the culture time of 24 h, the cells were clearly adhered on the TCPS and luminescence behavior was investigated. Note that the TCPS did not show any significant luminescence.Results and discussion
Preparation of MC-Eu:MPS particles
The size of the Eu:MPS particles ranged from approx. 300–500 nm, which is consistent with that reported in our previous study,32 and the sizes were almost same in the case with/without the mechanochemical treatments. The Eu3+ ions were located inside the structure to electrostatically interact with the environmental O atoms, which would prevent aggregation among the Eu3+ ions.32 In this study, the mechanochemical treatment would induce the changes in the flexible siloxane skeleton with preserving the particles sizes.Fig. 1(a) shows the XRD patterns of the Eu:MPS and MC-Eu:MPS particles, and the inset figure displays the TEM image of a Eu:NPS particle. The TEM image clearly exhibited the highly-ordered mesopore arrangements. The cylindrical pores were homogeneously formed on the particle surfaces; the pore diameter was estimated to be 2.4–2.7 nm and the thickness of the pore silica wall was 0.6–1.0 nm. No guest substances in the pores were observed (also confirmed in Fig. S2(a), ESI†). The MC1-Eu:MPS particles preserved the ordered nanostructures (Fig. S2(b), ESI†), whereas the nanostructures of the MC2-Eu:MPS and MC3-Eu:MPS particles exhibited the deteriorated arrangements and the fusion and aggregation among the particles (Fig. S2(c and d), ESI†). The diffractions in the Eu:MPS are indexed as the 100, 110, 200 and 220 planes of a hexagonal structure, suggesting the ordered pore arrangements. The MC1-Eu:MPS preserved the ordered structures based on the d100 value, although the diffractions in the MC2-Eu:MPS and MC3-Eu:MPS particles exhibited the deteriorated arrangements (i.e., worm-like mesopore structures). Thus, the mechanochemical treatment was successfully applied to the Eu:MPS particles without serious damages to the pores by carefully setting the treatment condition.
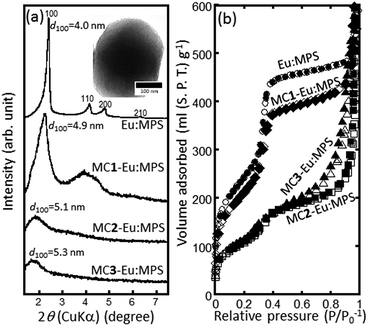 | ||
| Fig. 1 (a) XRD patterns and (b) N2 adsorption (closed marks) and desorption (open marks) isotherms of the Eu:MPS and MC-Eu:MPS particles. Inset: TEM image of the Eu:MPS particle. | ||
Fig. 1(b) shows the N2 adsorption and desorption isotherms of the Eu:MPS and MC-Eu:MPS particles. A hysteresis between the adsorption and desorption at the relative pressure of around 0.5 was observed in the Eu:MPS and MC1-Eu:MPS particles. These isotherms were categorized into typical type IV according to the IUPAC classification, indicating the existence of mesopores that were not destroyed during the mechanochemical treatment. In the MC2-Eu:MPS and MC3-Eu:MPS particles, the isotherm shapes were different as compared with those of the other particles. The Barrett–Joyner–Halenda (BJH) pore size distributions57 indicated the dilatation of pore diameter by the milling treatment and the distribution width was broadening (Fig. S3, ESI†). It is thought that the multiple N2 adsorption steps would occur on the surfaces, suggesting the formation of the hierarchical surface energy structures by the fusion and aggregation between the particles.
In addition to the nanostructural changes mentioned above, the interaction changes between the particles occurred. As shown in the Fig. S1(c),† a medium ball is pressed against the vessel wall surface to produce a centrifugal force on a group of particles. The centrifugal force exerted on the medium is classified into two forces; i.e., a compression force exerted on the particles and a shear force exerted between the particles. The compression force is exerted into the depth of the particle, whereas the shear force acts only on the particle surface. As described elsewhere in detail,41 the particles were repeatedly welded and then fractured by the milling force to be an equilibrium milling state. Thus, the particle size is changed due to the welding and fracturing, respectively. Consequently, it is suggested that a higher specific surface area of the MC3-Eu:MPS particles as compared with that of MC2-Eu:MPS would be attributed to the difference between the particle interactions.
As shown in Table 1, the BET surface area decreased with the mechanochemical treatment, suggesting the environmental siloxane skeleton changes for Eu3+ ions by the mechanochemical treatments.
| SBET (m2 (g of silica)−1) | ηint (%) | τ (ms) | |
|---|---|---|---|
| Eu:MPS | 894 | 6.5 | 1.234 ± 0.012 |
| MC1-Eu:MPS | 793 | 6.3 | 1.052 ± 0.016 |
| MC2-Eu:MPS | 401 | 8.2 | 0.926 ± 0.004 |
| MC3-Eu:MPS | 437 | 10.1 | 0.811 ± 0.001 |
According to our previous reports,41,42 the metal oxide surfaces have the active O atoms with rich dangling bonds in the disordered SiOx. The surfaces significantly affect the attractive adsorption force and rearrange the oxide structures, suggesting the strong molecular orbital interactions between the Si–O bonds, Eu3+ ions and FA-NHS molecules. Therefore, the mechanochemical force on the near-surface Eu:MPS would affect the luminescence properties as well as the immobilization states in the present case.
Luminescence properties of the MC-Eu:MPS particles
Fig. 2 shows the excitation and photoluminescence spectra of the MC-Eu:MPS particles. The fluorescent microscope image indicates the orange luminescence from the particles. The peaks of the MC-Eu:MPS particles are attributed to the transitions from the metastable orbital singlet state of 5D0 to the spin–orbital states of 7FJ (J = 1, 2, 3, 4),49 which specifically indicates the transitions from the 5D0 to 7F0 at 577 nm, 7F1 at 591 nm, 7F2 at 611 nm, 7F3 at 654 nm and 7F4 at 700 nm. Irrespective of the condition of the mechanochemical treatments, the spectral shapes are almost same. The luminescence of the Eu3+ doped in the silica framework was predominantly attributed to 5D0 → 7F1 and 5D0 → 7F2, and the 5D0 → 7F2 intensity depended on the site environment of Eu3+.32,50 The ratio of the 5D0 → 7F2 to 5D0 → 7F1 luminescence intensities (I611/I590) was 5.0, 5.1 and 5.4 for MC1-Eu:MPS, MC2-Eu:MPS and MC3-Eu:MPS particles, respectively, indicating the slight symmetry changes for the doped Eu3+ ions.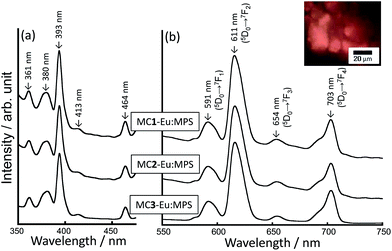 | ||
| Fig. 2 (a) Excitation and (b) photoluminescence spectra of the MC-Eu:MPS particles treated with the different milling forces. Inset: representative fluorescence image of the MC3-Eu:MPS particles. | ||
The stability of MPS in biological solution has been reported and the dependence of ionic-strength was pointed out.55 We have reported the stability of the Eu:MPS particles in PBS,33 suggesting the importance of the FA functionalization for dispersion stability. In this study, the MC3-Eu:MPS stably dispersed in PBS (Fig. S4(a), ESI†) and exhibited strong and stable photoluminescence (Fig. S4(b), ESI†). In the present case, such stability in the biological solution was due to the Eu3+ ions which are densely-confined by the silica frameworks.
Surprisingly, hint increased with increasing the mechanochemical force as shown in Table 1. The hint based on the luminescence from 5D0 → 7F2 is in the order of MC3-Eu:MPS > MC2-Eu:MPS > MC1-Eu:MPS. The stronger mechanochemical force would induce the complete disruption of the mesopores as well as the segregation of europium and/or silicon oxides on the particle surfaces. In the different Eu ion concentrations (2.5–10 mol%) to Si in the silica matrix, the hint value was 3.9–8.7% (ref. 35) and lower than that prepared by the mechanochemical treatment in this study. In the silica host systems, the cross relaxation among the neighboring Eu3+ ions would take place and quench the luminescence.52,53 Furthermore, the hydroxyl groups and adsorbed water molecules can also lower the luminescence efficiency of the Eu3+ through a non-radiative phonon quenching.54 These problems could be suppressed by the present mechanochemical treatment.
To understand the luminescence relaxation, the decay kinetics of the excited states was investigated as summarized in Table 1. With increasing the mechanochemical force, the Eu3+ ions could be juxtaposed to each other to enhance the cross relaxation among the neighboring Eu3+ ions to shorten t, even though only the silica framework exhibited the longer t of the Eu3+. The relationship between the mechanochemical force and the t reveals the favorable dispersion state of the Eu3+ ions in the silica frameworks. In the following experiment, the most luminescent MC3-Eu:MPS was used.
29Si-MAS NMR spectral changes by the surface-functionalization
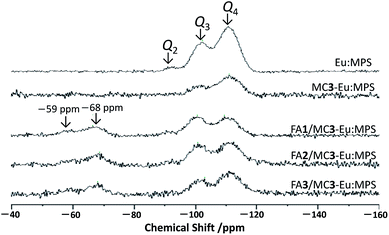
Fig. 3 shows the 29Si-MAS NMR spectra of the particles. A few significant signals were seen and were attributed to Q2 (![[double bond, length as m-dash]](https://www.rsc.org/images/entities/char_e001.gif) OSi(OSi)2), Q3 (–OSi(OSi)3) and Q4 (Si(OSi)4) at around –94, –101 and –110 ppm, respectively. The decrease in the Q2 signal by the mechanochemical treatment indicates the decrease in the structural Si–OH groups, implying the reaction among Si–OH groups to form O–Si–O. It is also supported by the FT-IR spectra (Fig. S5, ESI†) where the absorption bands originated from the Si–O–Si stretching mode were seen at around 1070 and 1225 cm−1. In addition, the other bands assigned to the Si–OH stretching mode were also observed at around 795 and 960 cm−1. The broad bands centered at around 1633 and 3450 cm−1 are attributed to the O–H stretching of the adsorbed H2O molecules. With the mechanochemical treatment, the slight increase in the bands at around 1633 and 3450 cm−1 and the disappearance of the band at 3740 cm−1 due to the structural Si–OH groups are indicative of the increase in the adsorbed H2O and decrease in the Si–OH. Judging from these results, the near-surface (e.g., structural Si–OH groups) changes by the mechanochemical treatment would affect the interaction states with the H2O molecules.
OSi(OSi)2), Q3 (–OSi(OSi)3) and Q4 (Si(OSi)4) at around –94, –101 and –110 ppm, respectively. The decrease in the Q2 signal by the mechanochemical treatment indicates the decrease in the structural Si–OH groups, implying the reaction among Si–OH groups to form O–Si–O. It is also supported by the FT-IR spectra (Fig. S5, ESI†) where the absorption bands originated from the Si–O–Si stretching mode were seen at around 1070 and 1225 cm−1. In addition, the other bands assigned to the Si–OH stretching mode were also observed at around 795 and 960 cm−1. The broad bands centered at around 1633 and 3450 cm−1 are attributed to the O–H stretching of the adsorbed H2O molecules. With the mechanochemical treatment, the slight increase in the bands at around 1633 and 3450 cm−1 and the disappearance of the band at 3740 cm−1 due to the structural Si–OH groups are indicative of the increase in the adsorbed H2O and decrease in the Si–OH. Judging from these results, the near-surface (e.g., structural Si–OH groups) changes by the mechanochemical treatment would affect the interaction states with the H2O molecules.
After the reaction with APTES, two signals appeared at around −59 and −68 ppm that are due to T2 (–C–Si(OSi)2(OH)) and T3 (–C–Si(OSi)3), indicating successful immobilization. The relative integral intensity ratio of Q3 to Q4 (Q3/Q4) of the FA/MC3-Eu:MPS particles shown in Table 2 was higher than that of the previous report on bare MCM-41 (0.62),48 suggesting the increase in the structural Si–OH groups by the FA immobilization process. In fact, the APTES immobilization induced the decrease in specific surface area with the reaction time. This would be due to the APTES molecules strongly interact with the silica frameworks in the mesopores to change the bonding states.35 Thus, the local structural changes from Q4 to Q3 would occur at the mesopores. The signal broadening with the mechanochemical treatment and subsequent FA immobilization are probably due to the changes in the structural Si–O bond distance and/or Si–O–Si angles.49 Therefore, these results clearly suggest that the silica framework structures are modified by the mechanochemical treatment and subsequent FA immobilization.
| Eu:MPS | MC3-Eu:MPS | FA1-Eu:MPS | FA2-Eu:MPS | FA3-Eu:MPS | |
|---|---|---|---|---|---|
| Q3/Q4 | 0.61 | 0.47 | 1.04 | 0.63 | 0.73 |
Cytotoxicity and uptake properties of the FA/MC-Eu:MPS particles
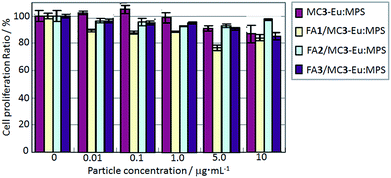
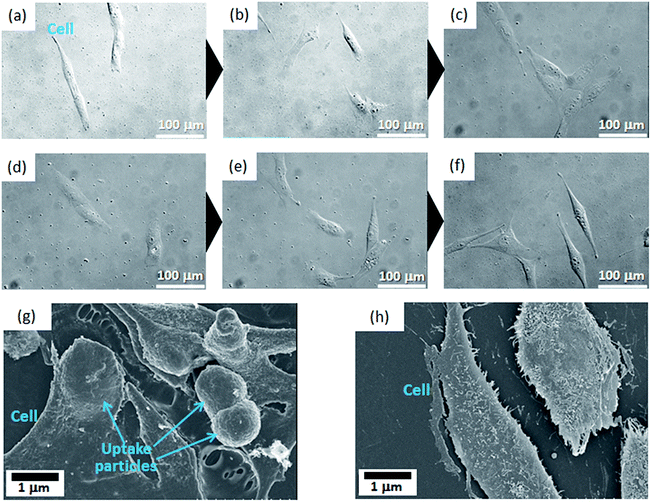
MG-63 cell proliferation ratios were investigated when they were exposed to the MC3-Eu:MPS, FA1/MC3-Eu:MPS, FA2/MC3-Eu:MPS and FA3/MC3-Eu:MPS particles with the different particle concentration at the culture time of 24 h (Fig. 4). At the present culture time and particle concentration ranges, we visually observed that the adhered cells proliferated and maintained with their normal morphologies in the presence of the particles. It seemed that the particles bind to cellular membranes or are uptaken by the cells. Although this result indicated no significant differences among the low particle concertation of 0–10 μg mL−1, the FA2/MC3-Eu:MPS and FA3/MC3-Eu:MPS particles caused low cytotoxicity at the concertation of 10 μg mL−1, and were used in the following experiment.To investigate the cellular uptake processes in more detail, the typical time-lapse observation images exposed to FA2/MC3-Eu:MPS and FA3/MC3-Eu:MPS at the same observation position (the particle concentration: 10 μg mL−1) were shown in Fig. 5(a–f). The MG-63 cells were going extend pseudopods to capture the particles actively at the time of 8 h (just 4 h after the addition of the particles) in Fig. 5(a and d). Then, the particles were aggregated on the cell membrane surfaces around the periphery at the time of 12 h (just 8 h after the addition of the particles) in Fig. 5(b and e). At the time of 24 h (just 20 h after the addition of the particles), the cells would endocytose the particles. In the observation of the cell activity by the MC3-Eu:MPS particles, the cells were also going extend pseudopods to capture some particles, indicating no significant differences between MC3-Eu:MPS and FA2/MC3-Eu:MPS particles. In other words, it is difficult to judge whether the cells interact with the particles in the case without washing the cell surfaces. Accordingly, we examined this point after washing the cell surfaces. As a result, the uptake was supported by the SEM observation (Fig. 5(g)). Although the cellular shapes and volumes were slightly reduced under the vacuum condition, it turns out that the cell membranes followed particle shapes to swell up by adding FA2/MC3-Eu:MPS particles. In contrast, there was no reflection by the particulate shapes inside the cellular bodies cultured on TCPS in Fig. 5(h). As the other control (addition of the MC3-Eu:MPS particles), the cell surface morphologies indicate that no evidence on the cell–particle interaction was recognized, implying the importance of the FA immobilization for the binding or uptake. Therefore, the FA/MC-Eu:MPS particles were effectively endocytosed by the cancer cells.
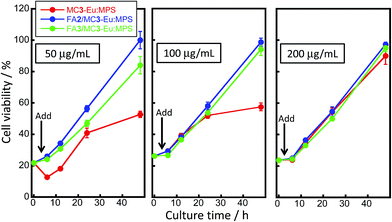
The cell viability changes with/without adding MC3-Eu:MPS, FA2/MC3-Eu:MPS and FA3/MC3-Eu:MPS particles at the different culture times and higher particle concentrations were shown in Fig. 6. The viability behaviors reached the confluent states at around the culture time of 50 h. In particular, the HeLa cancer cells drastically proliferated 6 h after adding the FA2/MC3-Eu:MPS and FA3/MC3-Eu:MPS particles. This behavior is same as that without adding the particles, indicating the reflection of the native proliferation rate and non-cytotoxicity of the FA-functionalized MC3-Eu:MPS particles. In contrast, the MC3-Eu:MPS particles exhibited the lower proliferation rate. Thus, the surface-activated MC3-Eu:MPS particles with radical species were deactivated with the FA-NHS functionalization to resultantly exhibit a good cytocompatibility. The FA2/MC3-Eu:MPS particles exhibited good cytocompatibility at all the concentration and were used for the imaging experiment described in the following section.
Imaging ability for cancer cells by the FA/MC-Eu:MPS particles
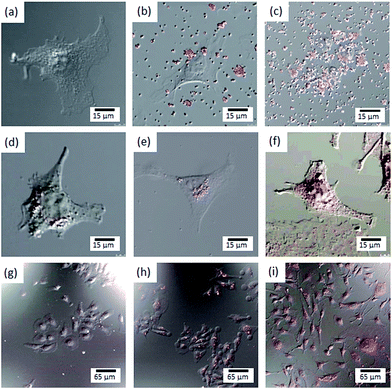
Fig. 7 shows the representative composite images of both the differential interference and fluorescence images of the HeLa cells reacted with MC3-Eu:MPS and FA2/MC3-Eu:MPS particles at the different concentrations. The luminescence was easily observed by fluorescent microscopy. The significant binding and uptake by the HeLa cells were clearly recognized. The MC3-Eu:MPS particles exhibited no uptake by the cells and were present outside of the cells (Fig. 7(a–c)). In contrast, the fluorescence images of the cells indicated the presence of luminescent particles located around the nuclei at the lower concentration (Fig. 7(d)). The cellular uptake would be fairly rapid and can be already observed through the cell membrane. With an increase in the particle concentration, the number of particles in the cells increased and the luminescence along with the cellular shapes were observed (Fig. 7(e and f)). It indicates that the targeted particle amount are suitable for imaging HeLa cells. Accordingly, the FA2/MC3-Eu:MPS particles were effectively taken up by the HeLa cells. Fig. 7(g–i) images were zoom out from the Fig. 7(d–f) images, indicating the clear imaging ability along with all the cellular shapes. Therefore, the FA2/MC3-Eu:MPS particles can be readily taken up by the HeLa cells at the particle concentration of 200 μg mL−1 and will be used as potential fluorescent labels in biomedical imaging. Therefore, based on host–guest interactions,56 the nanospaces of the particles in this study will lead to the immobilization of anticancer drug molecules in the mesopore for biomedical applications.Conclusions
For the imaging of cancer cells, we developed a novel surface-engineering method using the luminescent MPS particles as a model system. Specifically, the mechanochemically-treated particles were successfully prepared, and a folate N-hydroxysuccinimidyl ester (FA-NHS) molecule as a targeting ligand for the cells was immobilized on the particle surfaces. With the mechanochemical treatment to the particle surface, the siloxane bonding structures were changed to show better luminescence quantum efficiency as revealed by 29Si-NMR and photoluminescence spectroscopy, suggesting the interaction changes between the silica frameworks and the doped Eu3+ ions. We also confirmed that the mechanochemically-treated particles specifically bound to the cancer cells after immobilizing with FA-NHS and the particles did not show any toxicity in the cellular proliferation stages. The binding and uptake process by the cells were in situ observed by a time-lapse optical microscopy. The particles after the binding and uptake also showed the intense luminescence from the cells at the culture time of 24 h, demonstrating the clear imaging ability along with all the cellular shapes. Therefore, the present surface-engineered luminescent MPS particles will be used for specific targeting and imaging purposes for cancer cells. In future, the utilization of the drug-loaded mesostructures for theranostics will be reported by our laboratory.Acknowledgements
This study was partially supported by JSPS KAKENHI Grant Number 26709052.Notes and references
- L. Brandon-Peppas and J. O. Blanchette, Adv. Drug Delivery Rev., 2004, 56, 1649–1659 CrossRef PubMed.
- F. Caruso, Adv. Mater., 2001, 13, 11–22 CrossRef CAS.
- L. Hu, Z. W. Mao and C. Y. Gao, J. Mater. Chem., 2009, 19, 3108–3115 RSC.
- T. Yanagisawa, T. Shimizu, K. Kuroda and C. Kato, Bull. Chem. Soc. Jpn., 1990, 63, 988–992 CrossRef CAS.
- C. T. Kresge, M. E. Leonowicz, W. J. Roth, J. C. Vartuli and J. S. Beck, Nature, 1992, 359, 710–712 CrossRef CAS.
- J. S. Beck, J. C. Vartuli, W. J. Roth, M. E. Leonowicz, C. T. Kresge, K. D. Schmitt, C. T.-W. Chu, D. H. Olson, E. W. Sheppard, S. B. McCullen, J. B. Higgins and J. L. J. Schlenker, J. Am. Chem. Soc., 1992, 114, 10834–10843 CrossRef CAS.
- K. B. Yoon, Chem. Rev., 1993, 93, 321–339 CrossRef CAS.
- K. Moller and T. Bein, Chem. Mater., 1998, 10, 2950–2963 CrossRef CAS.
- M. Ogawa, Annu. Rep. Prog. Chem., Sect. C: Phys. Chem., 1998, 94, 209–257 RSC.
- A. Stein, B. J. Melde and R. C. Schroden, Adv. Mater., 2000, 12, 1403–1419 CrossRef CAS.
- B. J. Scott, G. Wirnsberger and G. D. Stucky, Chem. Mater., 2001, 13, 3140–3150 CrossRef CAS.
- H. Furukawa, T. Watanabe and K. Kuroda, Chem. Commun., 2001, 2002–2003 RSC.
- M. Ogawa, J. Photochem. Photobiol., C, 2002, 3, 129–146 CrossRef CAS.
- N. K. Mal, M. Fujiwara and Y. Tanaka, Nature, 2003, 421, 350–353 CrossRef CAS PubMed.
- M. Tagaya and M. Ogawa, Chem. Lett., 2006, 35, 108–109 CrossRef CAS.
- M. Tagaya and M. Ogawa, Phys. Chem. Chem. Phys., 2008, 10, 6849–6855 RSC.
- M. Tagaya, N. Hanagata and T. Kobayashi, ACS Appl. Mater. Interfaces, 2012, 4, 6169–6175 CAS.
- M. Vallet-Regi, F. Balas and D. Arcos, Angew. Chem., Int. Ed. Engl., 2007, 46, 7548–7558 CrossRef CAS PubMed.
- M. Manzano and M. Vallet-Regi, J. Mater. Chem., 2010, 20, 5593–5604 RSC.
- M. Tagaya, K. Kobayasi and M. Nishikawa, Mater. Lett., 2016, 164, 651–654 CrossRef CAS.
- M. Tagaya, RSC Adv., 2016, 6, 14452–14456 RSC.
- E. Ruiz-Hitzky, P. Aranda, M. Darder and M. Ogawa, Chem. Soc. Rev., 2011, 40, 801–828 RSC.
- N. Nassif and J. Livage, Chem. Soc. Rev., 2011, 40, 849–859 RSC.
- J. L. Vivero-Escoto, I. I. Slowing, C.-W. Wu and V. S. Y. Lin, J. Am. Chem. Soc., 2009, 131, 3462–3463 CrossRef CAS PubMed.
- M. Okuda, M. Takeguchi, Y. Zhu, A. Hashimoto, N. Ogawa, M. Tagaya, S. Chen, N. Hanagata and T. Ikoma, Surf. Interface Anal., 2011, 42, 1548–1551 CrossRef.
- J. M. Rosenholm, A. Meinander, E. Peuhu, R. Niemi, J. E. Eriksson, C. Sahlgren and M. Lindn, ACS Nano, 2009, 3, 197–206 CrossRef CAS PubMed.
- V. Sokolova and M. Epple, Nanoscale, 2011, 3, 1957–1962 RSC.
- G. Bardi, M. A. Malvindi, L. Gherardini, M. Costa, P. P. Pompa, R. Cingolani and T. Pizzorusso, Biomaterials, 2010, 31, 6555–6566 CrossRef CAS PubMed.
- J. Pan, D. Wan and J. L. Gong, Chem. Commun., 2011, 47, 3442–3444 RSC.
- Z. Y. Cheng, P. A. Ma, Z. Y. Hou, W. X. Wang, Y. L. Dai, X. F. Zhai and J. Lin, Dalton Trans., 2012, 41, 1481–1489 RSC.
- M. Tagaya, T. Ikoma, T. Yoshioka, F. Minami and J. Tanaka, Mater. Lett., 2011, 65, 2287–2290 CrossRef CAS.
- M. Tagaya, T. Ikoma, T. Yoshioka and J. Tanaka, J. Colloid Interface Sci., 2011, 363, 456–464 CrossRef CAS PubMed.
- M. Tagaya, T. Ikoma, T. Yoshioka and J. Tanaka, Chem. Commun., 2011, 47, 8430–8432 RSC.
- M. Tagaya, N. Hanagata, T. Ikoma, T. Kobayashi, K. Shiba, T. Yoshioka and J. Tanaka, Key Eng. Mater., 2013, 529–530 Search PubMed.
- M. Tagaya, T. Ikoma, Z. Xu and J. Tanaka, Inorg. Chem., 2014, 53, 6817–6827 CrossRef CAS PubMed.
- S. Motozuka, M. Tagaya, Y. Hotta, M. Morinaga, T. Ikoma, T. Honma, T. Daimon and J. Tanaka, Ind. Eng. Chem. Res., 2013, 52, 2182–2189 CrossRef CAS.
- S. Motozuka, M. Tagaya, K. Shiba, Z. Xu, N. Nishikawa, T. Yoshioka, T. Ikoma and J. Tanaka, Ind. Eng. Chem. Res., 2014, 53, 16736–16753 CrossRef CAS.
- S. Motozuka, M. Tagaya, N. Ogawa, K. Fukui, M. Nishikawa, K. Shiba, T. Uehara and T. Kobayashi, Solid State Commun., 2014, 190, 28–32 CrossRef CAS.
- M. Tagaya, S. Motozuka, T. Kobayashi, T. Ikoma and J. Tanaka, J. Mater. Chem., 2012, 22, 18741–18743 RSC.
- M. Tagaya, S. Motozuka, T. Kobayashi, T. Ikoma and J. Tanaka, Ind. Eng. Chem. Res., 2012, 51, 11294–11300 CrossRef CAS.
- S. Motozuka, M. Tagaya, H. Nishiyama, M. Nishikawa, T. Ikoma, T. Yoshioka, S. Samitsu and J. Tanaka, J. Phys. Chem. C, 2013, 117, 9908–9919 CAS.
- S. Motozuka, M. Tagaya, T. Ikoma, M. Morinaga, T. Yoshioka and J. Tanaka, J. Phys. Chem. C, 2013, 117, 16104–16118 CAS.
- J. F. Kukowska-Latallo, K. A. Candido, Z. Y. Cao, S. S. Nigavekar, I. J. Majoros, T. P. Thomas, L. P. Balogh, M. K. Khan and J. R. Baker, Cancer Res., 2005, 65, 5317–5324 CrossRef CAS PubMed.
- J. H. van Steenis, E. M. van Maarseveen, F. J. Verbaan, R. Verrijk, D. J. A. Crommelin, G. Storm and W. E. I. Hennink, J. Controlled Release, 2003, 87, 167–176 CrossRef CAS PubMed.
- S. Y. Chan, C. J. Empig, F. J. Welte, R. F. Speck, A. Schmaljohn, J. F. Kreisberg and M. A. Goldsmith, Cell, 2001, 106, 117–126 CrossRef CAS PubMed.
- N. Iwadera, Y. Yawaka and F. Watari, Nano Biomed., 2012, 4, 57–65 Search PubMed.
- T. Mosmann, J. Immunol. Methods, 1983, 65, 55–63 CrossRef CAS PubMed.
- W. Chen, R. Sammynaiken and Y. Huang, J. Appl. Phys., 2000, 88, 1424–1431 CrossRef CAS.
- N. Wan, J. Xu, T. Lin, X. Zhang and L. Xu, Appl. Phys. Lett., 2008, 92, 201109–201111 CrossRef.
- E. J. Nassar, K. J. Ciuffi, S. J. L. Ribeiro and Y. Messaddeq, Mater. Res., 2003, 6, 557–562 CrossRef CAS.
- S. Brunauer, P. H. Emmett and E. Teller, J. Am. Chem. Soc., 1938, 60, 309–319 CrossRef CAS.
- T. Ishizaka, R. Nozaki and Y. Kurokawa, J. Phys. Chem. Solids, 2002, 63, 613–617 CrossRef CAS.
- M. Yu, J. Lin, J. Fu, H. J. Zhang and Y. C. Han, J. Mater. Chem., 2003, 13, 1413–1419 RSC.
- A. J. Berry and T. A. King, J. Phys. D: Appl. Phys., 1989, 22, 1419–1422 CrossRef CAS.
- I. Izquierdo-Barba, M. Colilla, M. Manzano and M. Vallet-Regi, Microporous Mesoporous Mater., 2010, 132, 442–452 CrossRef CAS.
- E. Aznar, M. Oroval, L. Pascual, J. R. Murguía, R. Martínez-Máñez and F. Sancenón, Chem. Rev., 2016, 116, 561–718 CrossRef CAS PubMed.
- E. P. Barrett, L. G. Joyner and P. P. Halenda, J. Am. Chem. Soc., 1951, 73, 373–380 CrossRef CAS.
Footnotes |
| † Electronic supplementary information (ESI) available: Detailed set-up scheme for the mechanochemical reaction, additional scheme, and Fig. S1–S5. See DOI: 10.1039/c7ra00535k |
| ‡ These authors contributed equally to the work. |
| This journal is © The Royal Society of Chemistry 2017 |

