 Open Access Article
Influence of tungsten on the NH3-SCR activity of MnWOx/TiO2 catalysts†
Lu Peng ,
Li Huan,
Liu Huayan,
Chen Yinfei and
Zhang Zekai
 *
*
Department of Energy Chemical Engineering, Zhejiang University of Technology, Chaowang Road 18, Hangzhou 310014, China. E-mail: zzk@zjut.edu.cn; Tel: +86-571-88320767
First published on 4th April 2017
Abstract
A series of bulk MnWOx and supported MnWOx/TiO2 catalysts with MnWO4 structure were prepared via self-propagating high-temperature synthesis (SHS), co-precipitation and impregnation methods. The catalysts were characterized using X-ray diffraction (XRD), N2 adsorption/desorption, hydrogen-temperature programmed reduction (H2-TPR), X-ray photoelectron spectroscopy (XPS) and transmission electron microcopy (TEM). The performance of MnWOx and MnWOx/TiO2 and the relation between the tungsten and manganese oxide species in MnWOx and MnWOx/TiO2 catalysts were investigated. The supported MnWOx/TiO2 catalysts exhibited the activity improvement of the SCR reaction via the promotion of tungsten. The XRD pattern and the TEM images revealed that the presence of tungsten induces the formation of a MnWO4 oxide phase, thus weakening the interaction between MnO2 and TiO2, which is favorable for the specific surface area of MnWOx/TiO2. The MnWO4 phase also has a positive effect for the activity and N2 selectivity of MnWOx/TiO2 in the high temperature range. In a feed gas that contains 500 ppm NO, 500 ppm NH3, 5 vol% O2 and N2 as the balance gas, Mn2WOx/TiO2-SHS shows the best deNOx performance and the NOx conversion reaches 100% in the temperature range of 130–300 °C under the reaction condition of 30![[thin space (1/6-em)]](https://www.rsc.org/images/entities/char_2009.gif) 000 h−1.
000 h−1.
1. Introduction
NH3-SCR is a well-established technology for the removal of nitrogen oxides from stationary and mobile emission sources.1–3 V2O5 based catalysts have also been proven to be very suitable catalysts for the NH3-SCR process in the temperature window of 350–400 °C.4–7 Unfortunately, the temperature of exit flue gas is often lower than the work temperature range; this means there is a lot of excess energy cost when the V2O5 based catalysts are used. Finding another catalyst system that can work under the temperature of exit flue gas is thereby attractive for many researchers' interest. Many single and mixed transition oxides system have been developed, such as Mn-,8–10 Fe-11,12 and Ce-based catalysts.13,14 MnO2 based catalysts have been substantially investigated, which are famous for the high activity and poor poison resistance at low temperature range.15–17In the V2O5 and CeO2 based catalysts, tungsten is usually used as a promoter and stabilizer. WO3 can widen the work temperature window and raise the SO2 resistance by inhibiting the initial sintering of TiO2, increasing the amount of Lewis acid over catalyst, improving the electron transfer of the catalyst, facilitating the formation of reduced V2O5, and directly providing the active sites18–21 The promotion effect also have been adopted to improve the performance of MnO2 based catalysts.22–24 Casapu et al.25 screened the doped MnOx–CeO2 catalysts and found that an even stronger suppression of N2O formation was obtained with MnWCe system, but this catalyst also showed a very low ammonia oxidation activity. Xu et al.26 studied the tungsten modified MnOx–CeO2/ZrO2 monolith catalysts and found that MnOx–CeO2/10% WO3–ZrO2 had the best textural properties and the most adsorbed sites of NH3 or NO species. The NOx conversion was more than 80% in the temperature range of 150 to 380 °C at the gas hourly space velocity of 10![[thin space (1/6-em)]](https://www.rsc.org/images/entities/char_2009.gif) 000 h−1. Meanwhile, Peng et al.27 doped CeW catalyst with manganese and found MnCeW system exhibited more activity for NOx conversion than the CeW catalyst below 200 °C. The addition of tungsten to Mn/Ce/Ti resulting in the Mn/Ce/W/Ti catalyst also showed excellent NOx conversion in the 120–200 °C and SO2 resistance.28 These results illuminated the promoting effect of tungsten to the MnO2 based catalysts. Further, Liu et al. first considered the MnWOx as the main active phase and got high deNOx efficiency from 60 to 250 °C.29 Sun et al.30 then prepared a series of WαMn1−αOx Catalysts via coprecipitation method. W0.33Mn0.66Ox catalyst with amorphous or poorly crystalline Mn and W species showed the highest NH3-SCR activity within a broad temperature range of 230–470 °C. Our group also prepared a MnxW0.05Ti0.95−xO2−δ catalyst with self-propagating high-temperature synthesis method and obtained a high activity in the range of 200–400 °C. In different, an uncertain crystal phase was observed on the TEM image, which might be helpful for the activity of the MnWTi catalyst.31
000 h−1. Meanwhile, Peng et al.27 doped CeW catalyst with manganese and found MnCeW system exhibited more activity for NOx conversion than the CeW catalyst below 200 °C. The addition of tungsten to Mn/Ce/Ti resulting in the Mn/Ce/W/Ti catalyst also showed excellent NOx conversion in the 120–200 °C and SO2 resistance.28 These results illuminated the promoting effect of tungsten to the MnO2 based catalysts. Further, Liu et al. first considered the MnWOx as the main active phase and got high deNOx efficiency from 60 to 250 °C.29 Sun et al.30 then prepared a series of WαMn1−αOx Catalysts via coprecipitation method. W0.33Mn0.66Ox catalyst with amorphous or poorly crystalline Mn and W species showed the highest NH3-SCR activity within a broad temperature range of 230–470 °C. Our group also prepared a MnxW0.05Ti0.95−xO2−δ catalyst with self-propagating high-temperature synthesis method and obtained a high activity in the range of 200–400 °C. In different, an uncertain crystal phase was observed on the TEM image, which might be helpful for the activity of the MnWTi catalyst.31
In this paper, to discuss the promoting function of tungsten and MnWO4 phase on the properties of MnO2 based catalysts, a series of bulk and supported MnWOx catalysts were prepared by self-propagating high-temperature synthesis (SHS), co-precipitation (CP) and impregnation (IMP) methods, and their catalytic activity in NH3-SCR reaction were tested.
2. Experimental
2.1 Catalyst preparation
The MnWOx catalysts were mainly prepared by self-propagating high-temperature synthesis, co-precipitation and impregnation method. The general preparation steps are as follows: for the bulk MnWOx catalysts via self-propagating high-temperature synthesis, stoichiometric molar amount of manganous nitrate (Mn(NO3)2·4H2O) and ammonium tungstate hydrate ((NH4)10W12O41·xH2O) was dissolved in the de-ioned water respectively. The total amount of precursor metal-salts is 0.01 mol. 0.1 mol of glycine (CH2NH2COOH) was then added into the precursor solution as a fuel. Then, the mixed solution was stirred, heated and concentrated to form proper homogeneity till it burnt. Then, the solid was transferred into a clean crucible and moved into a muffle kept at the constant temperature for 2 h for the aging of the target catalyst. Under the same conditions, the mixed Mn–W oxides catalysts with different molar ratio of Mn to W (labeled as MnaWOx later) were dispersed on the surface of TiO2 (anatase, htnano Co., Ltd). The loading amount of active components is kept at 20 wt%. The Mn2WOx and Mn2WOx/TiO2 catalysts with typical MnWO4 phase were also prepared by co-precipitation and impregnation method. The detailed steps can be seen in elsewhere.32 As a reference, MnO2, WO3, WO3/TiO2 (20 wt% WO3), MnO2/TiO2 (20 wt% MnO2) samples were also prepared via self-propagating high-temperature synthesis.2.2 Catalyst characterization
N2 adsorption/desorption isotherms of the catalysts were measured at −196 °C using a physical adsorption apparatus (3Flex, Micromeritics) to calculate BET surface area of the catalysts. Prior to measurement, all samples were degassed at 280 °C for 10 h to remove the impurities in the porous structure.The XRD patterns of the samples were checked using an ARL SCINTAG X'TRA X-ray diffractometer (Shimadzu) equipped with CuKα radiation. XRD patterns were recorded in the 2θ range of 10° to 80° with a scan step size of 0.02°.
Transmission electron microscopy (TEM) images of the catalysts were taken on a Tecnai G2 F30 S-Twin electron microscope operating at an accelerating voltage of 300 kV. The dispersion of the elemental composition and the semiquantitative determination of the Ti, Mn, W, and O ratio were detected by the energy dispersive X-ray spectrometer (EDX) at the same time.
The hydrogen temperature programmed reduction (H2-TPR) profiles of the catalysts were recorded by a chemisorber (Chem2910, Finesorb). Each sample (ca. 100 mg) were pretreated at 200 °C for 2 h in Ar flow before reduction process. Subsequently, the sample was heated from 100 °C to 950 °C in 5 vol% H2/95 vol% Ar flow, at a rate of 30 ml min−1 with a heating rate of 10 °C min−1.
X-ray photoelectron spectroscopy (XPS) was used to analyze the surface atomic state and form of catalyst with Al target and Kα radiation, operating at 15 kV voltage and C 1s = 284.8 eV for calibration (Kratos AXIS Ultra DLD). The concentrations of Mn, W, Ti and O on catalyst surface were calculated from the peak areas ratios of the samples.
2.3 Catalytic tests
The activity evaluation of the catalysts was carried out in a fixed-bed quartz reactor with an inner diameter of 8 mm. The reaction conditions were as follows: 0.5 g of catalyst (20–60 mesh, 1 ml),500 ppm NO, 500 ppm NH3, 5 vol% O2, N2 as the balance gas, the total gas flow rate was 500 ml min−1, and the corresponding gas hourly space velocity (GHSV) was 30![[thin space (1/6-em)]](https://www.rsc.org/images/entities/char_2009.gif) 000 h−1. The catalyst bed temperature was increased gradually and kept at each reaction temperature for half an hour to ensure the stabilization of the reaction. The composition of the feed gases were monitored continuously online using Teledyne T200H/M chemiluminescent NOx analyzer and gas chromatograph (Thermo Trace 1300 equipped with Porapak Q column). NOx conversion and N2 selectivity are calculated as follows: NOx conversion (%) = ([NOx]in − [NOx]out)/[NOx]in, N2 selectivity (%) = (([NO]in + [NH3]in) − [NO2]out − 2[N2O]out)/([NO]in + [NH3]in).
000 h−1. The catalyst bed temperature was increased gradually and kept at each reaction temperature for half an hour to ensure the stabilization of the reaction. The composition of the feed gases were monitored continuously online using Teledyne T200H/M chemiluminescent NOx analyzer and gas chromatograph (Thermo Trace 1300 equipped with Porapak Q column). NOx conversion and N2 selectivity are calculated as follows: NOx conversion (%) = ([NOx]in − [NOx]out)/[NOx]in, N2 selectivity (%) = (([NO]in + [NH3]in) − [NO2]out − 2[N2O]out)/([NO]in + [NH3]in).
3. Results and discussions
3.1 Synthesis and characterization of the bulk and supported MnWOx catalysts
![[thin space (1/6-em)]](https://www.rsc.org/images/entities/char_2009.gif) :
:![[thin space (1/6-em)]](https://www.rsc.org/images/entities/char_2009.gif) W ratio, the surface area continually increases. MnO2 has the largest surface area of 30 m2 g−1. It seems that the existence of tungsten has a negative effect on the surface areas of the MnWOx catalysts by self-propagating high-temperature synthesis. The lower surface area of the MnWOx catalysts than the MnO2 partially explains their worse activities than MnO2 in low temperature range.
W ratio, the surface area continually increases. MnO2 has the largest surface area of 30 m2 g−1. It seems that the existence of tungsten has a negative effect on the surface areas of the MnWOx catalysts by self-propagating high-temperature synthesis. The lower surface area of the MnWOx catalysts than the MnO2 partially explains their worse activities than MnO2 in low temperature range.
| Samples | BET surface area (m2 g−1) | Pore volume (cm3 g−1) | Average pore diameter (nm) |
|---|---|---|---|
| WO3-SHS | 0 | — | — |
| MnWOx-SHS | 5 | — | — |
| Mn2WOx-SHS | 6 | 0.0421 | 28.7 |
| Mn5WOx-SHS | 15 | 0.0704 | 18.3 |
| Mn10WOx-SHS | 25 | 0.156 | 24.6 |
| MnO2-SHS | 30 | 0.178 | 23.5 |
Table 2 lists part of the textual properties of the TiO2 with supported MnWOx catalysts. Compared to the bulk MnWOx, the variation of surface area of these samples shows a different way. The Mn2WOx/TiO2-SHS keeps the largest surface area of 142 m2 g−1; while the MnO2/TiO2-SHS only has 85 m2 g−1 of BET surface area, which is even smaller than 109 m2 g−1 of WO3/TiO2-SHS. The results means that the existence of W can alleviate the decrement of TiO2 surface area, and increase the BET surface area of MnWOx/TiO2-SHS. Further, the decrement of average pore diameter of Mn2WOx/TiO2-SHS indicates that the Mn2WOx species are well dispersed in the pore structure of TiO2, which will be favorable for the activity.
| Samples | BET surface area (m2 g−1) | Pore volume (cm3 g−1) | Average pore diameter (nm) |
|---|---|---|---|
| WO3/TiO2-SHS | 109 | 0.212 | 7.8 |
| MnO2/TiO2-SHS | 85 | 0.194 | 9.0 |
| Mn2WOx/TiO2-SHS | 142 | 0.217 | 6.1 |
| TiO2 | 184 | 0.296 | 6.4 |
![[thin space (1/6-em)]](https://www.rsc.org/images/entities/char_2009.gif) :
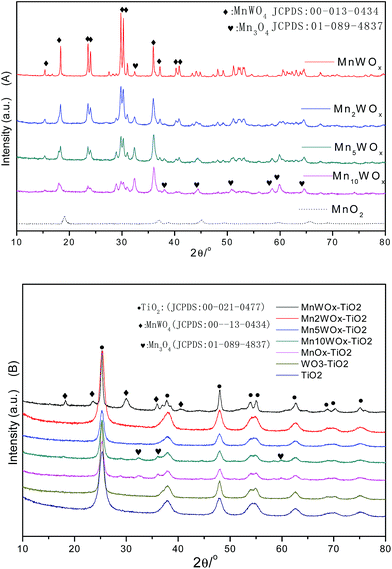
:![[thin space (1/6-em)]](https://www.rsc.org/images/entities/char_2009.gif) W ratio. It means that the main species were the MnWO4 and the Mn3O4 on the bulk MnWOx. The general valence of manganese in MnWOx catalysts has been suppressed to be about +2/+3. In Fig. 1B, the TiO2 with supported WO3 (WO3/TiO2) sample only presented the characteristic peaks of anatase TiO2. The MnO2/TiO2 and Mn10WOx/TiO2 presents the characteristic peaks of Mn3O4 and anatase TiO2. The MnWOx/TiO2 presents the characteristic peaks of MnWO4 and anatase TiO2. However, the characteristic peaks of MnWO4 and Mn3O4 disappeared together on the patterns of Mn2WOx/TiO2 and Mn5WOx/TiO2, which can be ensured that the active species were well dispersed on the TiO2. The above results suggested that the coexistence of MnWO4 and Mn3O4 weaken the intensity of characteristic peaks and caused the disappearances of MnWO4 and Mn3O4 on the patterns of Mn2WOx/TiO2 and Mn5WOx/TiO2. For the MnWOx catalysts, MnWO4 phase seemed to play an important role in NH3-SCR reaction.
W ratio. It means that the main species were the MnWO4 and the Mn3O4 on the bulk MnWOx. The general valence of manganese in MnWOx catalysts has been suppressed to be about +2/+3. In Fig. 1B, the TiO2 with supported WO3 (WO3/TiO2) sample only presented the characteristic peaks of anatase TiO2. The MnO2/TiO2 and Mn10WOx/TiO2 presents the characteristic peaks of Mn3O4 and anatase TiO2. The MnWOx/TiO2 presents the characteristic peaks of MnWO4 and anatase TiO2. However, the characteristic peaks of MnWO4 and Mn3O4 disappeared together on the patterns of Mn2WOx/TiO2 and Mn5WOx/TiO2, which can be ensured that the active species were well dispersed on the TiO2. The above results suggested that the coexistence of MnWO4 and Mn3O4 weaken the intensity of characteristic peaks and caused the disappearances of MnWO4 and Mn3O4 on the patterns of Mn2WOx/TiO2 and Mn5WOx/TiO2. For the MnWOx catalysts, MnWO4 phase seemed to play an important role in NH3-SCR reaction.
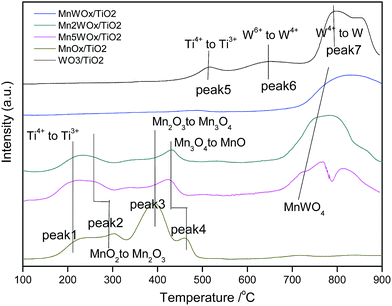 | ||
Fig. 2 H2-TPR profiles of different TiO2 with supported MnWOx samples with different Mn![[thin space (1/6-em)]](https://www.rsc.org/images/entities/char_2009.gif) : :![[thin space (1/6-em)]](https://www.rsc.org/images/entities/char_2009.gif) W ratio and preparation methods. W ratio and preparation methods. | ||
Another main reduction band distributed in 600–900 °C is probably from tungsten oxides, MnWO4 species and titanium oxides.36,37 For WO3/TiO2 sample, the reduction peaks at 520 °C, 650 °C and 800 °C are most probably from part of Ti4+ to Ti3+, W6+ to W4+ and W4+ to W0.38,39 When manganese is added, the two peaks at 520 °C and 650 °C diminished on the MnaWOx/TiO2-SHS profiles. The diminishing of peak at 520 °C might indicate the excellent dispersion of MnWO4 on the surface of TiO2 support; the diminishing of peak at 650 °C represents that there is no single WO3 species left. The only peak around 790 °C should be from MnWO4 structure, and it can be inferred that the Mn4+ and W6+ in MnWO4 structure needs a high temperature to be reduced. With the manganese content increases, the reduction temperature seems to be decreased.
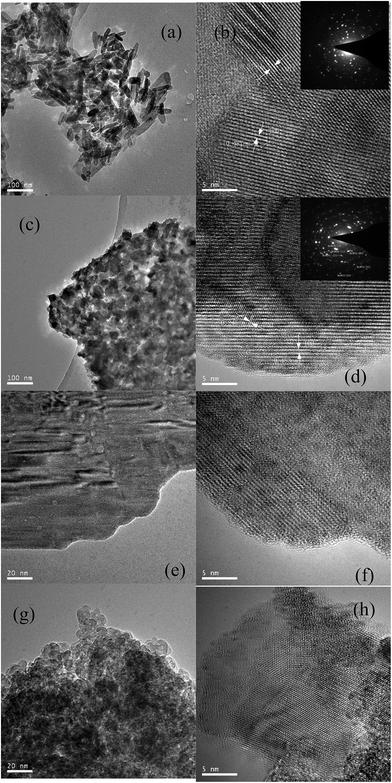 | ||
| Fig. 3 TEM images of the bulk and supported MnWOx catalysts with different preparation methods. (a), (b): Mn2WOx-CP; (c), (d): Mn2WOx-SHS; (e), (f): Mn2WOx/TiO2-IMP; (g), (h) Mn2WOx/TiO2-SHS. | ||
For the two supported samples, MnWOx species are uniformly distributed on the surfaces of the two samples in the shape of about 1 nm diameter nanoparticles, which are shown as the little black dots in Fig. 3f and h. Partly due to the little sizes of the nanoparticles, MnWO4 phase is hard to be distinguished on the images. The main change is come from the TiO2 support. It looks like that the TiO2 support has grown into large plates via impregnation method (Fig. 3e). The specific surface area of Mn2WOx/TiO2-IMP is thereby severely influenced and decreases from 184 m2 g−1 to 56 m2 g−1, which may cause the activity decreases. Meanwhile, the self-propagating high-temperature synthesis method keeps the structure of TiO2 support much better and more MnWOx species nanoparticles can be formed and seen on the surface.
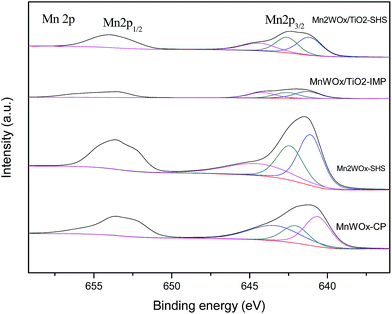
| Samples | Mn4+ | Mn3+ | Mn2+ | Average valence | |||
|---|---|---|---|---|---|---|---|
| BE (eV) | Per.% | BE (eV) | Per.% | BE (eV) | Per.% | ||
| MnWOx-CP | 642.0 | 22.32 | 640.6 | 38.85 | 643.4 | 38.83 | 2.8 |
| Mn2WOx-SHS | 642.4 | 31.08 | 641.1 | 42.38 | 644.5 | 26.54 | 3.0 |
| MnWOx/TiO2-IMP | 642.6 | 30.26 | 641.3 | 38.17 | 644.2 | 31.57 | 3.0 |
| Mn2WOx/TiO2-SHS | 642.6 | 33.26 | 641.1 | 42.37 | 644.4 | 24.37 | 3.1 |
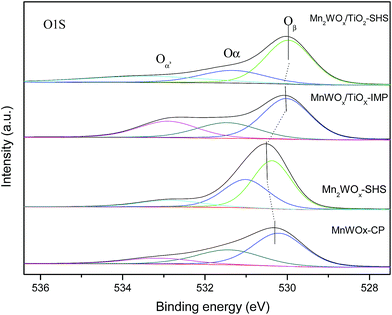
Oxygen species plays an important role in the NH3-SCR activity. The O 1s XPS of MnaWOx and MnaWOx/TiOx are thereby displayed in Fig. 5, and the characteristic peaks are deconvoluted by Gaussian fitting method. The sub-bands at 528.9–530.4 eV can be attributed to the lattice O2−(denoted as Oβ); the sub-bands with higher binding energy at 531.0–531.5 eV to surface absorbed oxygen (denoted as Oα) such as O22− and O− belonging to defect-oxide or hydroxyl-like group, and the binding energy at 532.3–533.2 eV can be assigned to chemisorbed water (denoted as Oα′).43–46 The surface absorbed Oα is usually regard as more reactive in oxidation reactions due to its higher mobility than lattice O2−, which is also beneficial to the NO oxidation to NO2 thus facilitating the “fast SCR” process. The ratios of Oα, Oβ and Oα′ on four catalysts are calculated and listed in Table 4. The bulk MnWOx and Mn2WOx catalysts have high Oα ratios of 31.78% and 34.72% respectively, which means that the MnaWOx mixed oxides may have a high response to the NH3-SCR reaction. The poor performance in Fig. 6 may be caused by the poor BET surface area. When the specific surface area is increased by TiO2 supporting, MnaWOx/TiO2 then shows the high activity in NH3-SCR reaction.
| Samples | Oβ | Oα | Oα′ | |||
|---|---|---|---|---|---|---|
| BE (eV) | Per.% | BE (eV) | Per.% | BE (eV) | Per.% | |
| MnWOx-CP | 530.2 | 55.20 | 531.4 | 31.78 | 533.1 | 13.02 |
| Mn2WOx-SHS | 530.4 | 41.06 | 531.0 | 34.72 | 532.8 | 24.22 |
| MnWOx/TiO2-IMP | 530.0 | 47.68 | 531.5 | 26.75 | 532.9 | 25.57 |
| Mn2WOx/TiO2-SHS | 528.9 | 57.67 | 531.2 | 24.65 | 532.3 | 17.68 |
3.2 Catalytic activity of the bulk and supported MnWOx catalysts
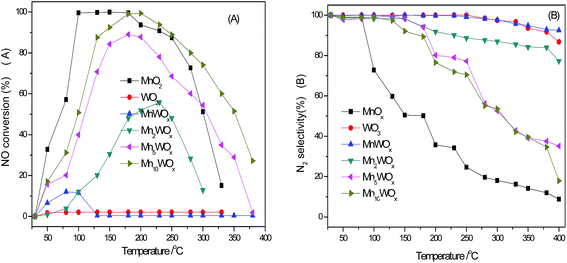
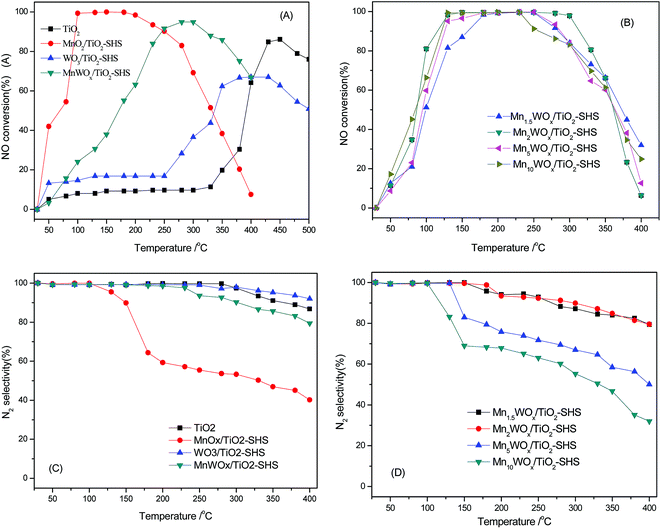
Fig. 6A displayed the activities of the bulk MnWOx catalysts with different Mn![[thin space (1/6-em)]](https://www.rsc.org/images/entities/char_2009.gif) :
:![[thin space (1/6-em)]](https://www.rsc.org/images/entities/char_2009.gif) W ratio by self-propagating high-temperature synthesis. Due to the poor specific surface area, the bulk WO3 did not show the NH3-SCR activity obviously; while the bulk MnO2 with the largest specific surface area among all the bulk samples showed the best performance in the lower temperature range. 100% NOx conversion had been achieved in the range of 100–180 °C. When the W and Mn coexist and form the series of MnaWOx catalysts, the activity catalysts undergone a series of change. Mn1WOx only showed poor activity in the range of 50–120 °C. Mn2WOx displayed higher activity in the temperature range of 100–300 °C. With the continuous increment of Mn content, the activity of MnaWOx did not surpass the bulk MnO2 in the low temperature, some of MnaWOx samples with high Mn
W ratio by self-propagating high-temperature synthesis. Due to the poor specific surface area, the bulk WO3 did not show the NH3-SCR activity obviously; while the bulk MnO2 with the largest specific surface area among all the bulk samples showed the best performance in the lower temperature range. 100% NOx conversion had been achieved in the range of 100–180 °C. When the W and Mn coexist and form the series of MnaWOx catalysts, the activity catalysts undergone a series of change. Mn1WOx only showed poor activity in the range of 50–120 °C. Mn2WOx displayed higher activity in the temperature range of 100–300 °C. With the continuous increment of Mn content, the activity of MnaWOx did not surpass the bulk MnO2 in the low temperature, some of MnaWOx samples with high Mn![[thin space (1/6-em)]](https://www.rsc.org/images/entities/char_2009.gif) :
:![[thin space (1/6-em)]](https://www.rsc.org/images/entities/char_2009.gif) W ratio behaved better performance in the high temperature range. The Mn10WOx exhibited the higher activity than the bulk MnO2 when the reaction temperature is above 200 °C.
W ratio behaved better performance in the high temperature range. The Mn10WOx exhibited the higher activity than the bulk MnO2 when the reaction temperature is above 200 °C.
The N2 selectivities of bulk MnWOx catalysts with different Mn![[thin space (1/6-em)]](https://www.rsc.org/images/entities/char_2009.gif) :
:![[thin space (1/6-em)]](https://www.rsc.org/images/entities/char_2009.gif) W ratio are presented in Fig. 6B. It can be seen that tungsten has a clearly effect of MnWOx on the N2 selectivity, especially in the high temperature range. The N2 selectivity of bulk MnO2 decreases to be about 20% when the temperature rise to 200 °C. While with the decrease of Mn
W ratio are presented in Fig. 6B. It can be seen that tungsten has a clearly effect of MnWOx on the N2 selectivity, especially in the high temperature range. The N2 selectivity of bulk MnO2 decreases to be about 20% when the temperature rise to 200 °C. While with the decrease of Mn![[thin space (1/6-em)]](https://www.rsc.org/images/entities/char_2009.gif) :
:![[thin space (1/6-em)]](https://www.rsc.org/images/entities/char_2009.gif) W ratio, i.e., the increases of W content, the N2 selectivity of MnaWOx is more and more improved. On the MnWOx with 1
W ratio, i.e., the increases of W content, the N2 selectivity of MnaWOx is more and more improved. On the MnWOx with 1![[thin space (1/6-em)]](https://www.rsc.org/images/entities/char_2009.gif) :
:![[thin space (1/6-em)]](https://www.rsc.org/images/entities/char_2009.gif) 1 ratio, the N2 selectivity of has almost reached 100%, the insertion of tungsten into MnaWOx favours the increase in the activity and N2 selectivity. Supported MnWOx/TiO2 catalysts with high specific surface area were then prepared and the activities were tested under the same reaction conditions. As shown in Fig. 7A and B, the supporting of MnO2 did not improve the activity of MnO2/TiO2. The 100% NOx conversion window (working window) was still in the range of 100–180 °C. Meanwhile, the MnaWOx/TiO2 catalysts showed much better performance than the bulk MnaWOx samples and single MnO2 catalysts. Except Mn1WOx/TiO2, all the other MnaWOx/TiO2 catalysts presented the 100% NOx conversion temperature window. The temperature window of the Mn1.5WOx/TiO2 was 180–240 °C; The Mn2WOx/TiO2 was 130–300 °C, and the window of Mn5WOx/TiO2 and Mn10WOx/TiO2 was in the same range of 130–240 °C.
1 ratio, the N2 selectivity of has almost reached 100%, the insertion of tungsten into MnaWOx favours the increase in the activity and N2 selectivity. Supported MnWOx/TiO2 catalysts with high specific surface area were then prepared and the activities were tested under the same reaction conditions. As shown in Fig. 7A and B, the supporting of MnO2 did not improve the activity of MnO2/TiO2. The 100% NOx conversion window (working window) was still in the range of 100–180 °C. Meanwhile, the MnaWOx/TiO2 catalysts showed much better performance than the bulk MnaWOx samples and single MnO2 catalysts. Except Mn1WOx/TiO2, all the other MnaWOx/TiO2 catalysts presented the 100% NOx conversion temperature window. The temperature window of the Mn1.5WOx/TiO2 was 180–240 °C; The Mn2WOx/TiO2 was 130–300 °C, and the window of Mn5WOx/TiO2 and Mn10WOx/TiO2 was in the same range of 130–240 °C.
N2 selectivity of the supported MnWOx catalysts are also been improved from Fig. 7C and D. The appearance of N2 selectivity decrease is retarded to high temperature attitude, and the decrease degree is alleviated with the Mn![[thin space (1/6-em)]](https://www.rsc.org/images/entities/char_2009.gif) :
:![[thin space (1/6-em)]](https://www.rsc.org/images/entities/char_2009.gif) W ratio decreasing. On the MnaWOx/TiO2 with Mn
W ratio decreasing. On the MnaWOx/TiO2 with Mn![[thin space (1/6-em)]](https://www.rsc.org/images/entities/char_2009.gif) :
:![[thin space (1/6-em)]](https://www.rsc.org/images/entities/char_2009.gif) W ratio of 1 and 2, N2O is only formed above 200 °C and the N2 selectivity of Mn1–2WOx/TiO2 catalysts keep above 80% during the course.
W ratio of 1 and 2, N2O is only formed above 200 °C and the N2 selectivity of Mn1–2WOx/TiO2 catalysts keep above 80% during the course.
The results show that the addition of tungsten can improve the activity and N2 selectivity of supported MnO2 based catalysts, especially in the higher temperature range. Though the Mn1WOx/TiO2 does not achieve the 100% NOx conversion, it shows much better activity than the MnO2/TiO2 when the temperature is above 250 °C. When the Mn![[thin space (1/6-em)]](https://www.rsc.org/images/entities/char_2009.gif) :
:![[thin space (1/6-em)]](https://www.rsc.org/images/entities/char_2009.gif) W ratio increases to 2
W ratio increases to 2![[thin space (1/6-em)]](https://www.rsc.org/images/entities/char_2009.gif) :
:![[thin space (1/6-em)]](https://www.rsc.org/images/entities/char_2009.gif) 1, the performance of MnaWOx/TiO2 will be better than MnO2/TiO2. It is the Mn2WOx/TiO2 that fetches the best performance among all the MnaWOx/TiO2 samples. Considering the XRD pattern and BET surface areas, the existence of tungsten have shown two effects on the TiO2 supported MnaWOx catalysts. The first is that the tungsten can alleviate the specific surface area loss of TiO2 support. The BET surface area of Mn2WOx/TiO2-SHS is clearly bigger than WO3/TiO2 and MnO2/TiO2, which is favorable for the catalytic activity in NH3-SCR reaction. The second effect may be that the tungsten can interact with manganese oxide and form the MnWO4 phase with manganese oxides, which is even favorable for the catalytic activity.
1, the performance of MnaWOx/TiO2 will be better than MnO2/TiO2. It is the Mn2WOx/TiO2 that fetches the best performance among all the MnaWOx/TiO2 samples. Considering the XRD pattern and BET surface areas, the existence of tungsten have shown two effects on the TiO2 supported MnaWOx catalysts. The first is that the tungsten can alleviate the specific surface area loss of TiO2 support. The BET surface area of Mn2WOx/TiO2-SHS is clearly bigger than WO3/TiO2 and MnO2/TiO2, which is favorable for the catalytic activity in NH3-SCR reaction. The second effect may be that the tungsten can interact with manganese oxide and form the MnWO4 phase with manganese oxides, which is even favorable for the catalytic activity.
3.3 Activity of Mn2WOx-CP, Mn1WOx/TiO2-IMP and Mn2WOx/TiO2-IMP catalysts
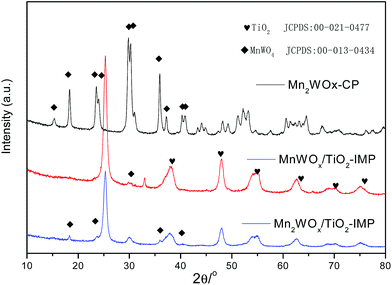
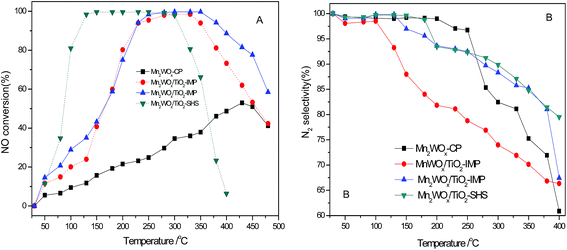
The above results show that tungsten addition can improve NH3-SCR activities of MnWOx catalysts. To discuss the mechanism of the addition of tungsten, especially the MnWO4 phase on the catalytic activity. Co-precipitation and impregnation method, which have been reported to be able to get MnWOx catalysts with typical MnWO4 phase,32 were used to prepare a bulk Mn2WOx (labeled as Mn2WOx-CP) and the TiO2 supported MnWOx and Mn2WOx (labeled as MnWOx/TiO2-IMP and Mn2WOx/TiO2-IMP). The BET surface areas of Mn2WOx-CP, MnWOx/TiO2-IMP and Mn2WOx/TiO2-IMP are 26, 52 and 56 m2 g−1 respectively. The XRD patterns in Fig. 8 show that both Mn2WOx-CP and Mn2WOx/TiO2-IMP both have typical characteristic peaks of MnWO4 without other impurity phase observed. Otherwise, MnWOx/TiO2-IMP also have MnWO4 structure.As shown in Fig. 9A, the above three samples exhibit distinctive catalytic performances, compared to the samples with self-propagating high-temperature synthesis method, the main function temperature range of Mn2WOx-CP, MnWOx/TiO2-IMP and Mn2WOx/TiO2-IMP seemed to move to the high temperature attitude clearly. The NOx conversion over Mn2WOx-CP continually increased till 430 °C, where it reached the maximum of 52.9%. For the two supported samples, the active temperature window of MnWOx/TiO2-IMP was in the range of 230–350 °C, where it can convert more than 94% NO. The deNOx performance of MnWOx/TiO2-IMP was better than MnWOx/TiO2-SHS. The activity window of Mn2WOx/TiO2-IMP is similar to MnWOx/TiO2-IMP, which the NOx conversion can reach 100% in the range of 250–350 °C. But the window width was some narrower than that of Mn2WOx/TiO2-SHS, and moved about 50 °C towards high attitude. Considering the working windows of the two samples, it seems that the working window of MnWOx/TiO2 catalysts can be broadened as wide as 130–350 °C (or even high31) by fine tuning or combing of different preparation methods. It also can be inferred that the MnWO4 should have some positive effect on the activity of MnWOx catalysts, especially for the activity of MnWOx/TiO2-IMP in the high temperature range.
The plot of N2 product selectivity over above three catalysts as a function of temperature is shown in Fig. 9B. Mn2WOx-CP showed an excellent N2 selectivity than MnWOx/TiO2-IMP and Mn2WOx/TiO2-SHS under the range of 250 °C. In contrast, Mn2WOx/TiO2-IMP and Mn2WOx/TiO2-SHS show a better N2 selectivity than Mn2WOx-CP when the temperature is high than 280 °C. It confirms that the improvement of N2 selectivity is associated with existence of MnWO4 and dispersion on the surface of carrier.
4. Conclusions
A series of bulk MnWOx and supported MnWOx/TiO2 catalysts have been prepared by self-propagating high-temperature synthesis, impregnation and co-precipitation method to discuss the effect and mechanism of tungsten on the manganese oxide based catalysts. The tungsten can interact with manganese oxide, thus weaken the interaction between tungsten and titanium or manganese and titanium, alleviate the specific surface area loss of TiO2 support, and improve the NH3-SCR activity of MnWOx/TiO2 catalysts. The tungsten and manganese also can form a MnWO4 crystal structure, which might be favorable for the activity and N2 selectivity in the high temperature range (above 260 °C). How the MnWO4 works needs to be further investigated. Both self-propagating high-temperature synthesis and impregnation can get uniformly distributed MnWOx nanoparticles, while the TiO2 support structure is more influenced by impregnation.Notes and references
- M. Fu, C. Li, P. Lu, L. Qu, M. Zhang, Y. Zhou, M. Yu and Y. Fang, Catal. Sci. Technol., 2014, 4, 14–25 CAS.
- F. Can, X. Courtois, S. Royer, G. Blanchard, S. Rousseau and D. Duprez, Catal. Today, 2012, 197, 144–157 CrossRef CAS.
- Z. Liu, J. Li and J. Hao, Chem. Eng. J., 2010, 165, 420–425 CrossRef CAS.
- G. Coudurier and J. C. Védrine, Catal. Today, 2000, 56, 415–430 CrossRef CAS.
- L. J. Alemany, F. Berti, G. Busca, G. Ramis, D. Robba, G. P. Toledo and M. Trombetta, Appl. Catal., B, 1996, 10, 299–311 CrossRef CAS.
- L. Lietti, I. Nova, G. Ramis, L. Dall'Acqua, G. Busca, E. Giamello, P. Forzatti and F. Bregani, J. Catal., 1999, 187, 419–435 CrossRef CAS.
- D. Ye, R. Qu, H. Song, X. Gao, Z. Luo, M. Ni and K. Cen, Chem. Eng. J., 2016, 283, 846–854 CrossRef CAS.
- S. Andreoli, F. A. Deorsola, C. Galletti and R. Pirone, Chem. Eng. J., 2015, 278, 174–182 CrossRef CAS.
- J. Xiang, L. Wang, F. Cao, K. Qian, S. Su, S. Hu, Y. Wang and L. Liu, Chem. Eng. J., 2016, 302, 570–676 CrossRef CAS.
- C. Liu, J. Shi, C. Gao and C. Niu, Appl. Catal., A, 2016, 25, 54–69 CrossRef.
- X. Xiong, C. Wu, Q. Hu, Y. Wang, J. Jin, C. Lu and D. Guo, Chem. Eng. J., 2016, 286, 459–466 CrossRef.
- R. Foo, T. Vazhnova, D. B. Lukyanov, P. Millington, J. Collier, R. Rajaram and S. Golunski, Appl. Catal., B, 2015, 162, 174–179 CrossRef CAS.
- D. W. Kwon, K. B. Nam and S. C. Hong, Appl. Catal., B, 2015, 166–167, 37–44 CrossRef CAS.
- Y. Peng, K. Li and J. Li, Appl. Catal., B, 2015, 140–141, 483–492 Search PubMed.
- D. K. Pappas, T. Boningari, P. Boolchand and P. G. Smirniotis, J. Catal., 2016, 334, 1–13 CrossRef CAS.
- Y. J. Kim, H. J. Kwon, I.-S. Nam, J. W. Choung, J. K. Kil, H. J. Kim, M. S. Cha and G. K. Yeo, Catal. Today, 2010, 151, 244–250 CrossRef CAS.
- S. M. Lee, K. H. Park and S. C. Hong, Chem. Eng. J., 2012, 195–196, 323–331 CrossRef CAS.
- S. Zhang and Q. Zhong, J. Mol. Catal. A: Chem., 2013, 373, 108–113 CrossRef CAS.
- Y. He, M. E. Ford, M. Zhu, Q. Liu, Z. Wu and I. E. Wachs, Appl. Catal., B, 2016, 188, 123–133 CrossRef CAS.
- Z. Li, J. Li, S. Liu, X. Ren, J. Ma, W. Su and Y. Peng, Catal. Today, 2015, 258, 11–16 CrossRef CAS.
- W. Shan, F. Liu, H. He, X. Shi and C. Zhang, Appl. Catal., B, 2012, 115–116, 100–106 CrossRef CAS.
- Z. Ma, X. Wu, Y. Feng, Z. Si and D. Weng, Catal. Commun., 2015, 69, 188–192 CrossRef CAS.
- Z. Liu, Y. Liu, Y. Li, H. Su and L. Ma, Chem. Eng. J., 2016, 283, 1044–1050 CrossRef CAS.
- X. Wang, X. Li, Q. Zhao, W. Sun, M. Tade and S. Liu, Chem. Eng. J., 2016, 288, 216–222 CrossRef CAS.
- M. Casapu, O. Kröcher and M. Elsener, Appl. Catal., B, 2009, 88, 413–419 CrossRef CAS.
- H. Xu, Q. Zhang, C. Qiu, T. Lin, M. Gong and Y. Chen, Chem. Eng. Sci., 2012, 76, 120–128 CrossRef CAS.
- Y. Peng, Z. Liu, X. Niu, L. Zhou, C. Fu, H. Zhang, J. Li and W. Han, Catal. Commun., 2012, 19, 127–131 CrossRef CAS.
- D. W. Kwon, K. B. Nam and S. C. Hong, Appl. Catal., A, 2015, 497, 160–166 CrossRef CAS.
- F. Liu, W. Shan, Z. Lian, L. Xie, W. Yang and H. He, Catal. Sci. Technol., 2013, 3, 2699–2707 CAS.
- W. Sun, X. Li, Q. Zhao, M. Tade and S. Liu, Energy Fuels, 2016, 30, 1810–1814 CrossRef CAS.
- Z. Kong, C. Wang, Z. Ding, Y. Chen and Z. Zhang, Catal. Commun., 2015, 64, 27–31 CrossRef CAS.
- J. Tang, J. Shen, N. Li and M. Ye, J. Alloys Compd., 2016, 666, 15–22 CrossRef CAS.
- P. R. Ettireddy, N. Ettireddy, S. Mamedov, P. Boolchand and P. G. Smirniotis, Appl. Catal., B, 2007, 76, 123–134 CrossRef CAS.
- D. Fang, J. Xie, H. Hu, H. Yang, F. He and Z. Fu, Chem. Eng. J., 2015, 271, 23–30 CrossRef CAS.
- P. G. W. A. Kompio, A. Brückner, F. Hipler, G. Auer, E. Löffler and W. Grünert, J. Catal., 2012, 286, 237–247 CrossRef CAS.
- D. W. Kwon and S. C. Hong, Appl. Surf. Sci., 2015, 356, 181–190 CrossRef CAS.
- L. Chen, J. Li and M. Ge, J. Phys. Chem. C, 2009, 113, 21177–21184 CAS.
- C. Wang, S. Yang, H. Chang, Y. Peng and J. Li, Chem. Eng. J., 2013, 225, 520–527 CrossRef CAS.
- S. S. R. Putluru, L. Schill, A. Godiksen, R. Poreddy, S. Mossin, A. D. Jensen and R. Fehrmann, Appl. Catal., B, 2016, 183, 282–290 CrossRef CAS.
- M. Mączka, M. Ptak, M. Kurnatowska, L. Kępiński, P. Tomaszewski and J. Hanuza, J. Solid State Chem., 2011, 184, 2446–2457 CrossRef.
- Y. Wan, W. Zhao, Y. Tang, L. Li, H. Wang, Y. Cui, J. Gou, Y. Li and J. Shi, Appl. Catal., B, 2014, 148–149, 2114–2122 Search PubMed.
- Z. Lian, F. Liu, H. He, X. Shi, J. Mo and Z. Wu, Chem. Eng. J., 2014, 250, 390–398 CrossRef CAS.
- M. Kang, E. D. Park, J. M. Kim and J. E. Yie, Appl. Catal., A, 2007, 327, 261–269 CrossRef CAS.
- J. Fang, X. Bi, D. Si, Z. Jiang and W. Huang, Appl. Surf. Sci., 2007, 253, 8952–8961 CrossRef CAS.
- W. Shan, F. Liu, H. He, X. Shi and C. Zhang, Appl. Catal., B, 2012, 115–116, 100–106 CrossRef CAS.
- Z. Kong, C. Wang, Z. Ding, Y. Chen and Z. Zhang, J. Fuel Chem. Technol., 2014, 42, 1447–1454 CrossRef CAS.
Footnote |
| † Electronic supplementary information (ESI) available. See DOI: 10.1039/c7ra00427c |
| This journal is © The Royal Society of Chemistry 2017 |

