 Open Access Article
Creative Commons Attribution 3.0 Unported Licence
Rational use and reuse of Nafion 212 membrane in vanadium flow batteries†
Ying Zhouab,
Lihong Yu*c,
Jianshe Wangd,
Le Liub,
Feng Liang *a and
Jingyu Xi
 *b
*b
aThe State Key Laboratory for Refractories and Metallurgy, School of Chemistry and Chemical Engineering, Wuhan University of Science and Technology, Wuhan 430081, China. E-mail: feng_liang@wust.edu.cn
bInstitute of Green Chemistry and Energy, Graduate School at Shenzhen, Tsinghua University, Shenzhen 518055, China. E-mail: xijy@tsinghua.edu.cn
cSchool of Applied Chemistry and Biological Technology, Shenzhen Polytechnic, Shenzhen 518055, China. E-mail: yulihong@szptu.edu.cn
dSchool of Chemical Engineering and Energy, Zhengzhou University, Zhengzhou 450000, China
First published on 31st March 2017
Abstract
Nafion series membranes are widely applied in vanadium flow batteries (VFB) as benchmark separators because of their extremely high chemical/mechanical stability. However, the serious vanadium ions crossover and comparably high price still hinder the large-scale application of Nafion membranes in VFB. Rational use and reuse of Nafion membranes is expected to overcome these two critical issues, which would greatly enhance the cycling performances and reduce the cost of VFB. In this study, we chose the relatively thin (50 μm) and cheap Nafion 212 membrane to investigate the rational use (for fresh membranes) and reuse (for used membranes) protocols in VFB. The structure-property relationship of various pretreated (as-received, water wetted, and acid boiled) Nafion 212 membranes is studied comprehensively. The results demonstrate that the wet Nafion 212 membrane can achieve superior VFB performances including 96% of coulombic efficiency, 77% of energy efficiency, and 0.11% per cycle of capacity fading at a higher current density of 120 mA cm−2. Our attempt also reveals that the characters of the reused Nafion 212 membranes, such as micro and macro morphologies, mechanical properties, rate and cycling performances, have been well maintained, even after the strict testing procedures which including frequent assembly/disassembly (12 times) of battery and super long period of operation (1500 h), demonstrating that Nafion 212 membrane can be used repeatedly in VFB.
1. Introduction
The vanadium flow battery (VFB) is regarded as one of the most promising large-scale energy storage technologies due to its advantages such as long cycle life, little impact on the environment, high energy efficiency and without geographical constraints.1–6 The VFB system is mainly made of electrolyte, electrode and membrane.7,8 Membrane (separator) as the core material of VFB, which is used to separate the negative and positive half-cells, determines not only the cell performance (i.e., capacity, efficiency and stability), but also the stack cost.9–12At present, the perfluorinated sulfonic acid Nafion series membranes are widely applied in VFB as benchmark membranes because of its excellent proton conductivity and extremely high chemical stability.13–16 However, the serious vanadium ions crossover issue and expensive price still hinder the large-scale application of Nafion membranes in VFB.17–20 To improve the efficiency and decrease the cost of VFB, modification of Nafion membranes21–23 and development of novel nonfluoride membranes24–28 have become the two main directions over the past decade.10–12 Although the low-cost hydrocarbon skeleton structure membranes, such as sulfonated poly (ether ether ketone) (SPEEK) membrane,24,25 sulfonated polyimide (SPI) membrane,26 polybenzimidazole (PBI) membrane,27 and porous poly (ether sulfone) (PES) membrane,28 would exhibit better single cell performance than commercial Nafion membranes, they still suffer from the degradation by the vanadium electrolyte29,30 and the damages by the external forces (i.e., uneven pressure from sealing gasket and exotic piercing force from graphite felt fiber)31,32 during long-term VFB operation. Therefore, the extremely chemical and mechanical stable Nafion series membranes33,34 are still the best choice for most large-scale and long-life VFB energy storage systems.
Reducing the thickness of the Nafion membrane could reduce the cost of the VFB stack.16,18–20 Actually, the thin Nafion 212 membrane (50 μm)15,35 has shown great potential to replace the thick Nafion 115 (125 μm)16,28 and Nafion 117 (175 μm)14,21 membranes for VFB application. In addition, the commercial Nafion 212 membrane was produced by solution casting method,36 which is beneficial for the large-scale production to further reduce costs. According to the economic analysis in some recent literatures, the estimate price of Nafion 212 would decrease from the current $225 m−2 to the future $90 m−2.18–20,37 This will greatly promote the practical application of Nafion 212 membrane in VFB. Accordingly, the rational use and reuse of Nafion 212 membrane have become two critical issues, which directly affect the performance and cost of VFB. In previous work,38 we have demonstrated that the pretreatment method of Nafion 115 membrane would have a significant impact on the efficiency and cycling performance of VFB. The acid boiled Nafion 115 membrane has the lowest area resistance, and can serve as a benchmark in VFB to evaluate other materials including novel membranes, electrodes and electrolytes. However, considering the practical application of VFB, the water wetted Nafion 115 membrane may be the best choice because of its comprehensive merits, such as easy of operation, relatively low cost, excellent cell efficiency and outstanding cycling stability. These results will be used to guide the rational use of the Nafion 212 membrane in VFB. Reuse of Nafion membranes still remains great challenges for VFB, whether in basic research or in practical application. Unfortunately, until now, a comprehensive evaluation of reuse or the repeated using method of Nafion membranes in VFB has not been reported.
In this study, we chose the commercial Nafion 212 membrane to investigate the rational use (for fresh membranes, see Table 1) and reuse (for used membranes, see Table 2) protocols for VFB application. Firstly, the relationship between nanostructure and transport properties of various pretreated Nafion 212 membranes is elucidated by small-angle X-ray scattering (SAXS) technique. The self-discharge process, battery efficiencies, and long-term cycling stability of VFBs with different Nafion 212 membranes are presented comprehensively. Subsequently, the wet Nafion 212 membrane (see Table 1) is selected to further study the impact of processing method (see Table 2) for repeated using. Ten rounds of repeated using of three membranes in VFBs are evaluated in terms of the variation of rate performance (@ 80–240 mA cm−2) and cycling stability (@ 120 mA cm−2). Finally, the three membranes after ten times of reusing are subjected to long-term cycling test (500 cycles @ 120 mA cm−2) to compare with the fresh membrane. Furthermore, the desirable pretreatment method for fresh Nafion 212 membrane and the recovering method for used Nafion 212 membrane are discussed and suggested.
| Nomenclature | Pretreatment process | Thickness (μm) | VO2+ permeability (10−7 cm2 min−1) |
|---|---|---|---|
| As-received | Used without any treatment | 52 | 2.2 |
| Wet | Soaked in deionized (DI) water for 24 h | 61 | 6.0 |
| Boiled | Boiled in 3 wt% H2O2, DI water, 1 M H2SO4 and DI water for 1 h, respectively | 65 | 38.2 |
| Nomenclature | Processing method for repeated using |
|---|---|
| Water | Soaked in DI water for 24 h |
| Acid | Soaked in 1 M H2SO4 for 24 h |
| Acid & water | Soaked in 1 M H2SO4 and DI water for 24 h, respectively |
2. Experimental
2.1. Materials
Nafion 212 and Nafion 115 membranes, denoted as N212 and N115, were purchased from DuPont Co. Other chemicals were of analytical grade and used without further purification.2.2. Membrane treatment process
Nomenclature and pretreatment process of fresh N212 is listed in Table 1. The used wet N212 was selected to evaluate its reuse feasibility. Nomenclature and processing method for used wet N212 is described in Table 2.2.3. Membrane characterization
In this study, two methods were adopted to obtain the area resistance (AR) of various membranes. For method a, the resistance of a VFB single cell (see Section 2.4) with membrane (R1) and without membrane (R2) was determined by electrochemical impedance spectroscopy (EIS) on a PARSTAT 2273 electrochemical workstation. For method b, a homemade conductivity cell was used.35 The membrane with effective area (S) of 2 cm2 was sandwiched between two chambers filled with 1.5 M VO2+/V3+ (1![[thin space (1/6-em)]](https://www.rsc.org/images/entities/char_2009.gif) :
:![[thin space (1/6-em)]](https://www.rsc.org/images/entities/char_2009.gif) 1) + 2 M free H2SO4 solution (the same electrolyte with VFB single cell test). R1 and R2, i.e. the resistance of the cell with and without membrane, respectively, were measured by EIS. For both methods, AR of the membrane was calculated by the equation: AR = (R1 − R2) × S.
1) + 2 M free H2SO4 solution (the same electrolyte with VFB single cell test). R1 and R2, i.e. the resistance of the cell with and without membrane, respectively, were measured by EIS. For both methods, AR of the membrane was calculated by the equation: AR = (R1 − R2) × S.
The VO2+ permeability was measured on a membrane separated diffusion cell.39 The SAXS spectra was recorded by using a Rigaku D/max2500v/Pc instrument (CuK 40 kV, 200 mV) at a rate of 0.01° cm−1.40,41 The cross-section of the membranes was observed by scanning electron microscopy (SEM, ZEISS SUPRA® 55). Mechanical property of the membranes was conducted on a CMT6104 (MTS-SANS) instrument with a tensile speed of 5 mm min−1.
2.4. Single cell test
The configuration of a VFB single cell was the same as in our previous work.42,43 A N212 membrane, two graphite felt electrodes (Gansu Haoshi, 50 × 50 × 5 mm, thermal activated at 420 °C for 10 h), and two 50 mL of electrolytes (1.5 M V3.5+ in 2 M free H2SO4) were used. The electrolytes were cyclically pumped through the half-cells by peristaltic pumps with a flow rate of 60 mL min−1. Both electrolyte tanks were purged with nitrogen gas for 10 min and then sealed prior to the single cell tests. The charge–discharge of the cell was controlled by a battery testing system (BTS, CT-3008-5V6A, Neware) in a voltage window of 0.8–1.65 V. The single cell was charged to the 50% state of charge (SOC) at a current density of 60 mA cm−2 to conduct the self-discharge test.3. Results and discussion
3.1. Rational use of Nafion 212 membrane in VFB
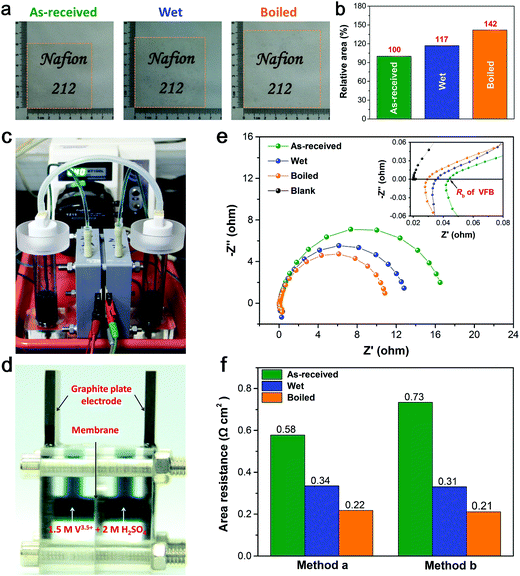
Digital photos of various pretreated N212 are shown in Fig. 1(a). All membranes have the same initial dimensions of 60 × 60 mm before pretreatment, and they are smooth and transparent. Both the through-plane (thickness) and in-plane (area) size of N212 are significantly changed after pretreatment. The thickness of N212 increases from 52 μm (as-received N212) to 61 μm (wet N212) and 65 μm (boiled N212), respectively (see Table 1). As shown in Fig. 1(a), the size of wet and boiled N212 is enlarged to 65 × 65 and 71 × 72 mm, which brings about 17% and 42% expansion of the area, respectively (see Fig. 1(b)). The increasing of thickness and area of N212 is ascribed to the swelling of the ionic micelle nanostructure during the wet and boiled pretreatment processes.33,38,44 Obviously, the enlarged area of wet and boiled N212 can reduce the cost of membrane for a particular VFB stack. However, the pretreatment will also affect the nanostructure and transport properties of N212, which will be discussed below.Area resistance is a crucial parameter of ion exchange membrane (IEM) which mainly determines the voltage efficiency (VE) of a VFB.45 Both single cell and conductivity cell are used to test the area resistance of various N212, as shown in Fig. 1(c) and (d), respectively. For single cell method, the EIS measurement was conducted after the electrolyte had been pumped into the cell for 30 min.38 Nyquist plots of single cells with and without N212 are presented in Fig. 1(e). All batteries show a similar impedance response, and the high-frequency intercept in the Nyquist plot can be assigned to the ohmic resistance (Rb) of the single cell,46 as shown in the inset of Fig. 1(e). The variation of single cell's Rb is due to the difference in the N212's area resistance, since all single cells have the same configuration except for the membrane. Therefore, the resistance of various N212 is calculated by subtracting the blank resistance (the single cell without membrane) from Rb. It can be seen that the order of Rb is as follows: as-received > wet ≫ boiled. Subsequently, the values of area resistance measured by single cell method are compared with that obtained from traditional conductivity cell method. As shown in Fig. 1(f), two methods get similar results for wet and boiled N212. For as-received N212, the area resistance obtained from single cell (flow electrolyte) is much lower than that of conductivity cell (static electrolyte), which can be attributed to that the swelling of the membrane in the flow electrolyte condition would decrease the area resistance.
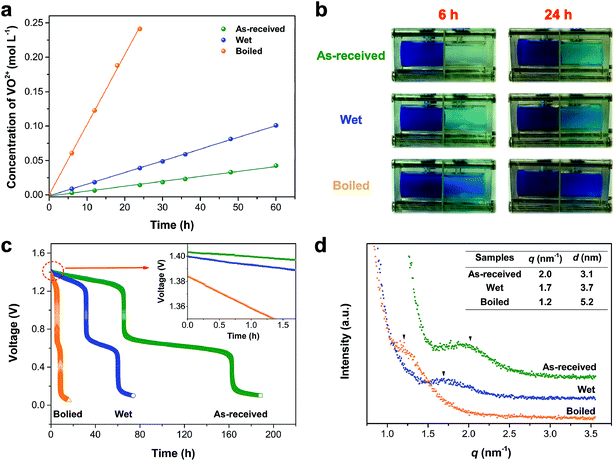
In order to further investigate pretreatment impact on the transport properties of N212, we carried out the VO2+ crossover and self-discharge experiments. The VO2+ permeability plots and the corresponding photographs of diffusion cell of various pretreated N212 are shown in Fig. 2(a) and (b), respectively. The VO2+ permeability follows the order of boiled > wet > as-received (see Table 1), which can be directly observed from the color change in Fig. 2(b). The same vanadium crossover trend is also observed from the self-discharge curves of various N212. As shown in the inset of Fig. 2(c), the initial open circuit voltage (OCV) follows the order of as-received > wet > boiled, which is due to the different crossover rate of vanadium ions in the charging process, as confirmed by the VO2+ permeability test in Fig. 2(a). The two sharp voltage drops in self-discharge curves are due to the disappearance of VO2+ in positive electrolyte and V2+ in negative electrolyte, respectively.47 The times to reach 0.8(0.2) V are 5.6(8.6) h, 31.8(60.9) h and 65.8(164.2) h for boiled, wet and as-received N212, respectively. The self-discharge rate of various pretreated N212 is in accordance with the VO2+ crossover results. To reveal how pretreatment methods affect the ion cluster (nanostructure) and transport properties of N212, various pretreated N212 were probed by SAXS. As shown in Fig. 2(d), a broad scattering peak is observed for various pretreated N212. Via calculation from the position of this peak (q), the distances (d) between the hydrophilic and hydrophobic domains41 of as-received, wet and boiled N212 are 3.1, 3.7 and 5.2 nm, respectively. This demonstrates that the ionic cluster in N212 can be expanded when the membrane is immersed in water or boiled in sulfuric acid solution. The enhanced water channel for wet and boiled N212 will lead to a higher swelling ratio, a lower area resistance, and faster vanadium ions crossover, as discussed above.
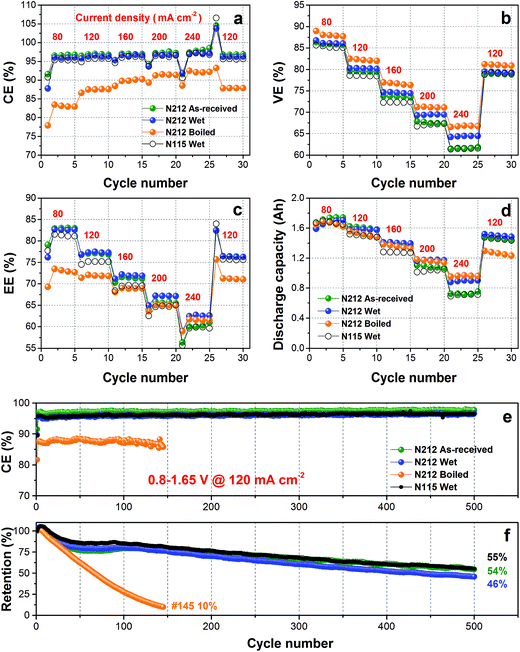
The various N212 were then assembled into single cells to evaluate its VFB performance in a broad current density range (80–240 mA cm−2). The benchmark Nafion 115 membrane (wet N115)38 was also tested at the same experimental conditions for comparison. As shown in Fig. 3(a)–(d), all VFBs exhibit the typical change trend with the increase of current density.10–12 Briefly, coulombic efficiency (CE) increases with current density, while voltage efficiency (VE), energy efficiency (EE) and discharge capacity present the opposite trend. The CE of a VFB is mainly affected by vanadium crossover.5 Therefore, as expected from the VO2+ crossover and self-discharge results, the CE follows the order of as-received > wet ≫ boiled. Specifically, the CE of as-received and wet N212 is higher than 95% even at the moderate current density of 80 mA cm−2. As shown in Fig. 3(b), the order of VE is boiled > wet > as-received, agreeing well with the N212's area resistance results in Fig. 1(f). For the key parameter of EE, the wet N212 demonstrates the highest value at 120–240 mA cm−2 owing to the combined impact of CE and VE, as shown in Fig. 3(c). At all test current densities, the wet N212 shows a slightly higher CE, much higher VE, EE, and discharge capacity compared to those of wet N115, indicating that the cheap/thin N212 can successfully replace the expensive/thick N115 for using in VFB.
To further assess the cycling stability of various membranes in VFB, 500 cycles of continuous charging/discharging test were conducted at 120 mA cm−2. The cycling performances including CE and discharge capacity retention are shown in Fig. 3(e) and (f). The CE of these membranes is consistent with the rate performance test in Fig. 3(a), which follows the order of as-received N212 > wet N212 ≈ wet N115 ≫ boiled N212. All membranes remain nearly stable CE during the whole lifespan test, indicating the superior micro (ion cluster nanostructure) and macro (chemical and mechanical) stability of Nafion membranes. The boiled N212 shows very fast capacity fading (10% retention @ 145 cycles) because of the serious vanadium ion crossover. After 500 cycles, the discharge capacity retention of as-received and wet N212 is 54% and 46% respectively, which is comparable with the 55% of wet N115. These results demonstrate that a rational use of N212 can achieve a promising efficiency (96% of CE and 77% of EE at 120 mA cm−2) and a slow capacity fading rate (0.11% per cycle). Based on the comprehensive consideration of the cost (Fig. 1), efficiencies, and cycling performances, the wet N212 was chosen for the subsequent reuse evaluation.
3.2. Reuse of Nafion 212 membrane in VFB
Fig. 4 illustrates the detailed experimental procedure for the reuse assessment of N212 in VFB. The VFB testing conditions for each step are as follows: (1) rate performance test, 5 cycles for 80, 120, 160, 200, and 240 mA cm−2 respectively, and then 5 cycles at 120 mA cm−2; (2) rate and cycling performances test, 5 cycles for 80, 120, 160, 200, and 240 mA cm−2 respectively, and then 100 cycles at 120 mA cm−2; (3) long-term life test, 500 cycles at 120 mA cm−2.Firstly, three fresh wet N212 membranes were used as the start membranes for the three groups of reuse experiments (see Table 2). The VFBs were tested under the same conditions as Fig. 3(a)–(d), and the results are shown in Fig. S1.† It can be seen that all VFBs show almost the same rate performances (CE, VE, EE, and discharge capacity) under the current density of 80–200 mA cm−2, indicating the excellent reproducibility of our experiments. The variation of rate performances at very higher current density (240 mA cm−2) may be ascribed to the increased polarization in VFBs. Then, the three VFBs were disassembled and the used N212 membranes were washed with DI water to carry out the subsequent reuse experiments.
As described in Table 2, three recovering methods (i.e., water, acid, and acid & water) were applied to treat the three used membranes respectively, after each round of testing. Three groups of independent experiments were simultaneously carried out for ten rounds to evaluate which method is the most suitable one for the reusing of N212 in VFB, and the results are present in Fig. 5(a)–(c), respectively. For comparison, a fresh wet N212 was also tested at the same conditions. In aspect of the simplest water recover method, as shown in Fig. 5(a), the used N212 exhibits slightly lower CE compared with the fresh N212 at all current densities (80–240 mA cm−2), resulting from the inevitable swelling of N212 during the former rate performances testing (see Fig. S1†). The decreasing in CE is smaller than 1% in the whole 10 rounds of repeated using, revealing that the nanostructure of the used N212 has reached a steady state after the first round of reusing. As the result of membrane swelling, the VE of used N212 is higher than that of fresh N212 owing to improved ion transport properties. With the combined impact of CE and VE, the EE of used and fresh N212 is about the same at all current densities. The small variation of used N212's efficiency (CE, VE and EE) in 10 rounds of testing should be attributed to the reasons such as changes in ambient temperature and difference in graphite felt electrode. Although the discharge capacity gap between used N212 and fresh N212 is larger than that of efficiency, all membranes can reach to a very close final discharge capacity after 35 cycles of rate performances test and 100 cycles of life test. For the recovering methods of acid and acid & water, the used N212 shows the same performance change trends in 10 rounds of repeated using, as shown in Fig. 5(b) and (c). The above results strongly demonstrate that the N212 can be used repeatedly in VFB with relatively stable efficiencies and cycling performances.
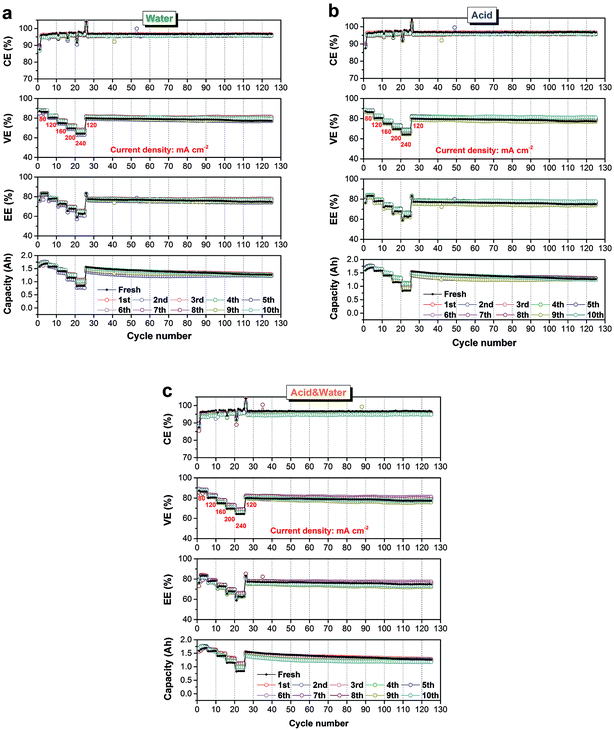 | ||
| Fig. 5 Rate and cycling performances of used N212 in ten rounds of testing. Recovering method for repeated using: (a) water, (b) acid, and (c) acid & water. | ||
Digital photos of the used N212 before (i.e. the membrane after recovery) and after (i.e. the membrane to be recovered) each round of testing displayed the dimensional stability of N212. As shown in Fig. S2,† no matter what kind of method is used, all the recovery N212 exhibit a smooth and transparent morphology. In addition, the blue color in the middle effective area (50 × 50 mm)43 of the used N212 disappeared after being treated by acid or acid & water protocol, resulting from the ion exchange between proton and residual vanadium ions in the membrane. In contrast, the water treatment method does not show this phenomenon. Nevertheless, the removal of vanadium ions has no significant effect on the performance of the membrane, as confirmed in Fig. 5. To fully describe the impact of reusing round and recover method on the dimensional stability of N212, the normalized area of N212 after each round of testing are compared in Fig. S3.† All the three N212 can reach a relative stable size after the second round of testing, resulting in the stable cycling performances during the repeated using. Throughout 10 rounds of reusing, the largest expanding ratio in area is only 6.2%, revealing the outstanding stability of N212 for VFB application. Duration of the reused N212 in ten rounds of testing is summarized in Fig. S4.† The three recover methods can make the running time of used N212 kept at about 110 h. The variation (<5%) is ascribed to the changes in ambient temperature and differences in graphite felt electrode (e.g., thickness and activity) in 10 rounds of testing.
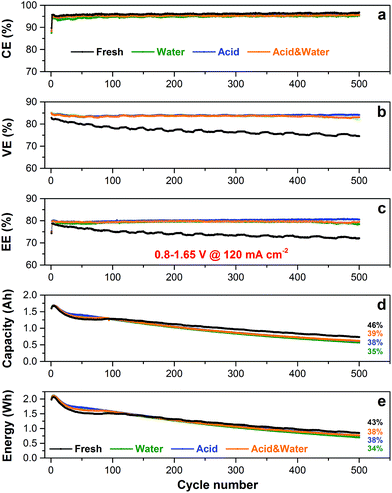
According to the above results, we have proved that N212 can be reused in VFB with relatively stable cycling performances. Therefore, a long-term life test was conducted to further investigate the impact of repeated using on the lifespan of N212 (see step 3 in Fig. 4). As shown in Fig. 6(a), both the fresh wet N212 and the used N212 exhibit very stable CE in the whole 500 cycles. All the used N212 show a slightly lower CE compared to fresh N212 because of the swelling of used N212 during 10 rounds of reusing (see step 2 in Fig. 4), as have discussed in Fig. 5. As a result, the initial VE of the used N212 is higher than that of fresh N212, as shown in Fig. 6(b). However, the VE of fresh N212 gradually decays, while the VE of three used N212 membranes keep stable during 500 cycles test. The same change trends of EE are observed in Fig. 6(c), since all N212 have a stable CE. The super stable VE and EE of used N212 may be caused by the fully developed proton transporting pathways (nano micelle structures) during the repeated using process. After 500 cycles, the discharge capacity retention of fresh N212, water recover N212, acid recover N212, and acid & water recover N212 is 46%, 35%, 38%, and 39%, respectively, as shown in Fig. 6(d). Although the fresh N212 shows the lowest capacity fading rate owing to the smallest electrolyte crossover, the gap of capacity retention between the fresh N212 and the used N212 is relatively small for such a long-term life test. We also compared the discharge energy of these membranes, as shown in Fig. 6(e). The discharge energy retention of fresh N212, water recover N212, acid recover N212, and acid & water recover N212 is 43%, 34%, 38%, and 38%, respectively. The gap of energy retention is smaller than that of capacity retention which can be ascribed to the high EE of the used N212. Obviously, there are no significant differences among the three recover methods for reusing of N212 in VFB.
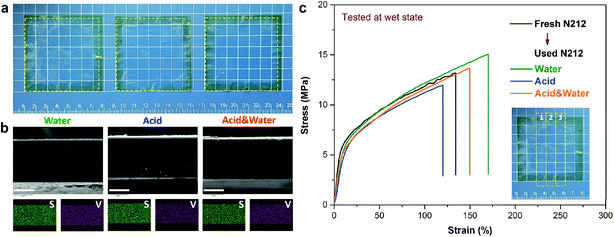
After completing all of the test procedures in Fig. 4, the resultant N212 membranes (denoted as final N212) were washed with DI water to evaluate its morphology and mechanical properties. As shown in Fig. 7(a), the size expanding of the final N212 is smaller than 5% in length (width) compared to the fresh wet N212, implying that the used N212 have already reached a relative stable swelling state during the repeated using process (see Fig. S2†). Fig. 7(b) shows the cross-section SEM images and the corresponding elements mapping (S and V) of the final N212. All the final N212 membranes exhibit dense structure in the cross-section. The uniform distribution of S element (corresponding to –SO3−) also confirms the extremely structural stability of N212. For all the final N212, the uniform distributed of V element is also detected due to the vanadium ions permeation during the process of battery test.
To clarify the impact of repeated using on the mechanical properties of N212, the final N212 membranes and the fresh wet N212 were subjected to the tensile test. The inset of Fig. 7(c) illustrates the positions of the membrane used for tensile test. Three parallel tests were carried out, and the results were basically consistent. Stress–strain curves of all membranes are compared in Fig. 7(c). The tensile curve of fresh N212 is consistent with recent study.48 It is clear that all the final N212 show tensile curves very similar to that of the fresh N212, indicating that long-term and repeated using would not significantly affect the mechanical properties of N212. The difference in the final stress–strain value of various membranes may be due to the volatilization of the water adsorbed by the membrane during the testing process.
In summary, both the morphologies and the mechanical properties of the three final N212 membranes have been well maintained, even in such a long period of testing (1500 h) and frequent battery assembly/disassembly (12 times) conditions (see Fig. 4), demonstrating the superior durability of N212 for VFB application. Considering the cost, efficiency, ease to operate, and cycling stability, the water recovering method is the most appropriate strategy for reusing of N212 in VFB.
4. Conclusions
The rational use (pretreatment such as as-received, wet, and boiled) and reuse (recovery such as water, acid, and acid & water) of N212 membranes are investigated towards low-cost, highly efficient and long-lifespan VFB application. Our work demonstrates that: (1) a rational use (wet pretreatment) of N212 can achieve a promising efficiency (96% of CE and 77% of EE) and a slow capacity fading rate (0.11% per cycle during 500 cycles) at 120 mA cm−2; (2) there are no significant differences among the three recovering methods for reusing of N212 in VFB. Considering the convenience and cycling stability, the water recovering method is the most appropriate strategy; (3) the characters of the reused N212, such as morphologies, mechanical properties, rate and cycling performances, have been well maintained, even after 12 rounds of VFB assembly/disassembly and 1500 h of operation. Owing to the superior durability, we believe that the reuse of N212 membranes will have a bright future in fundamental research and practical application of VFB.Acknowledgements
This work was supported by the Guangdong Provincial Natural Science Foundation (2015A030313894) and Shenzhen Basic Research Project (JCYJ20150331151358143).Notes and references
- B. Dunn, H. Kamath and J. M. Tarascon, Science, 2011, 334, 928 CrossRef CAS PubMed
.
- Z. Yang, J. Zhang, M. C. Kintner-Meyer, X. Lu, D. Choi, J. P. Lemmon and J. Liu, Chem. Rev., 2011, 111, 3577 CrossRef CAS PubMed
.
- M. Skyllas-Kazacos, M. H. Chakrabarti, S. A. Hajimolana, F. S. Mjalli and M. Saleem, J. Electrochem. Soc., 2011, 158, R55 CrossRef CAS
.
- P. Leung, X. Li, C. P. De León, L. Berlouis, C. J. Low and F. C. Walsh, RSC Adv., 2012, 2, 10125 RSC
.
- S. Xiao, L. Yu, L. Wu, L. Liu, X. Qiu and J. Xi, Electrochim. Acta, 2016, 187, 525 CrossRef CAS
.
- W. Wang, Q. Luo, B. Li, X. Wei, L. Li and Z. Yang, Adv. Funct. Mater., 2013, 23, 970 CrossRef CAS
.
- M. Ulaganathan, V. Aravindan, Q. Yan, S. Madhavi, M. Skyllas-Kazacos and T. M. Lim, Adv. Mater. Interfaces, 2016, 3, 1500309 CrossRef
.
- L. Wu, Y. Shen, L. Yu, J. Xi and X. Qiu, Nano Energy, 2016, 28, 19 CrossRef CAS
.
- H. Prifti, A. Parasuraman, S. Winardi, T. M. Lim and M. Skyllas-Kazacos, Membranes, 2012, 2, 275 CrossRef CAS PubMed
.
- Z. Li, W. Dai, L. Yu, J. Xi, X. Qiu and L. Chen, J. Power Sources, 2014, 257, 221 CrossRef CAS
.
- B. Schwenzer, J. Zhang, S. Kim, L. Li, J. Liu and Z. Yang, ChemSusChem, 2011, 4, 1388 CrossRef CAS PubMed
.
- T. K. Hoang and P. Chen, RSC Adv., 2015, 5, 72805 RSC
.
- P. Zhao, H. Zhang, H. Zhou, J. Chen, S. Gao and B. Yi, J. Power Sources, 2006, 162, 1416 CrossRef CAS
.
- J. Xi, Z. Wu, X. Qiu and L. Chen, J. Power Sources, 2007, 166, 531 CrossRef CAS
.
- D. Reed, E. Thomsen, W. Wang, Z. Nie, B. Li, X. Wei, B. Koeppel and V. Sprenkle, J. Power Sources, 2015, 285, 425 CrossRef CAS
.
- B. Jiang, L. Wu, L. Yu, X. Qiu and J. Xi, J. Membr. Sci., 2016, 510, 18 CrossRef CAS
.
- B. R. Chalamala, T. Soundappan, G. R. Fisher, M. R. Anstey, V. V. Viswanathan and M. L. Perry, Proc. IEEE, 2014, 102, 976 CrossRef CAS
.
- V. Viswanathan, A. Crawford, D. Stephenson, S. Kim, W. Wang, B. Li, G. Coffey, E. Thomsen, G. Graff, P. Balducci, M. Kintner-Meyer and V. Sprenkle, J. Power Sources, 2014, 247, 1040 CrossRef CAS
.
- A. Crawford, V. Viswanathan, D. Stephenson, W. Wang, E. Thomsen, D. Reed, B. Li, P. Balducci, M. Kintner-Meyer and V. Sprenkle, J. Power Sources, 2015, 293, 388 CrossRef CAS
.
- C. Minke and T. Turek, J. Power Sources, 2015, 286, 247 CrossRef CAS
.
- J. Xi, Z. Wu, X. Teng, Y. Zhao, L. Chen and X. Qiu, J. Mater. Chem., 2008, 18, 1232 RSC
.
- X. Teng, J. Dai, J. Su, Y. Zhu, H. Liu and Z. Song, J. Power Sources, 2013, 240, 131 CrossRef CAS
.
- X. Teng, J. Dai, J. Su and G. Yin, J. Membr. Sci., 2015, 476, 20 CrossRef CAS
.
- S. Winardi, S. C. Raghu, M. O. Oo, Q. Yan, N. Wai, T. M. Lim and M. Skyllas-Kazacos, J. Membr. Sci., 2014, 450, 313 CrossRef CAS
.
- J. Xi, Z. Li, L. Yu, B. Yin, L. Wang, L. Liu, X. Qiu and L. Chen, J. Power Sources, 2015, 285, 195 CrossRef CAS
.
- Y. Zhang, S. Zhang, X. Huang, Y. Zhou, Y. Pu and H. Zhang, Electrochim. Acta, 2016, 210, 308 CrossRef CAS
.
- X. Zhou, T. Zhao, L. An, L. Wei and C. Zhang, Electrochim. Acta, 2015, 153, 492 CrossRef CAS
.
- Y. Li, H. Zhang, X. Li, H. Zhang and W. Wei, J. Power Sources, 2013, 233, 202 CrossRef CAS
.
- D. Chen and M. A. Hickner, Phys. Chem. Chem. Phys., 2013, 15, 11299 RSC
.
- Z. Yuan, X. Li, Y. Duan, Y. Zhao and H. Zhang, J. Membr. Sci., 2015, 488, 194 CrossRef CAS
.
- S. Kim, T. B. Tighe, B. Schwenzer, J. Yan, J. Zhang, J. Liu, Z. Yang and M. A. Hickner, J. Appl. Electrochem., 2011, 41, 1201 CrossRef CAS
.
- L. Yu and J. Xi, ACS Appl. Mater. Interfaces, 2016, 8, 23425 CAS
.
- K. A. Mauritz and R. B. Moore, Chem. Rev., 2004, 104, 4535 CrossRef CAS PubMed
.
- M. A. Hickner, H. Ghassemi, Y. S. Kim, B. R. Einsla and J. E. McGrath, Chem. Rev., 2004, 104, 4587 CrossRef CAS PubMed
.
- J. Xi, B. Jiang, L. Yu and L. Liu, J. Membr. Sci., 2017, 522, 45 CrossRef CAS
.
- S. Naudy, F. Collette, F. Thominette, G. Gebel and E. Espuche, J. Membr. Sci., 2014, 451, 293 CrossRef CAS
.
- L. Zeng, T. Zhao, L. Wei, Y. Zeng and Z. Zhang, J. Power Sources, 2016, 327, 374 CrossRef CAS
.
- B. Jiang, L. Yu, L. Wu, D. Mu, L. Liu, J. Xi and X. Qiu, ACS Appl. Mater. Interfaces, 2016, 8, 12228 CAS
.
- X. Luo, Z. Lu, J. Xi, Z. Wu, W. Zhu, L. Chen and X. Qiu, J. Phys. Chem. B, 2005, 109, 20310 CrossRef CAS PubMed
.
- Y. He, H. Zhang, Y. Li, J. Wang, L. Ma, W. Zhang and J. Liu, J. Mater. Chem. A, 2015, 3, 21832 CAS
.
- G. Gebel and O. Diat, Fuel
Cells, 2005, 5, 261 CrossRef CAS
.
- W. Dai, Y. Shen, Z. Li, L. Yu, J. Xi and X. Qiu, J. Mater. Chem. A, 2014, 2, 12423 CAS
.
- Z. Li, W. Dai, L. Yu, L. Liu, J. Xi, X. Qiu and L. Chen, ACS Appl. Mater. Interfaces, 2014, 6, 18885 CAS
.
- G. Gebel, Polymer, 2000, 41, 5829 CrossRef CAS
.
- X. Wu, J. Hu, J. Liu, Q. Zhou, W. Zhou, H. Li and Y. Wu, Pure Appl. Chem., 2014, 86, 633 CAS
.
- J. Xi, S. Xiao, L. Yu, L. Wu, L. Liu and X. Qiu, Electrochim. Acta, 2016, 191, 695 CrossRef CAS
.
- J. Sun, D. Shi, H. Zhong, X. Li and H. Zhang, J. Power Sources, 2015, 294, 562 CrossRef CAS
.
- J. Dai, X. Teng, Y. Song and J. Ren, J. Membr. Sci., 2017, 522, 56 CrossRef CAS
.
Footnote |
| † Electronic supplementary information (ESI) available. See DOI: 10.1039/c7ra00294g |
| This journal is © The Royal Society of Chemistry 2017 |

