DOI:
10.1039/C7RA00287D
(Paper)
RSC Adv., 2017,
7, 14395-14405
Copper loaded on activated carbon as an efficient adsorbent for removal of methylene blue
Received
8th January 2017
, Accepted 23rd February 2017
First published on 3rd March 2017
Abstract
Copper loaded activated carbon (Cu-AC) was prepared by impregnating it with cupric nitrate followed by microwave heating and then used for removing dyes in wastewater. The Cu-AC was thoroughly characterized by N2 adsorption and desorption isotherms, SEM, EDS, XRD, XPS, FT-IR, and Raman. It was proven that cupric nitrate was successfully loaded onto activated carbon with the resulting formation of copper, copper oxide, and cuprous oxide. The Cu-AC was used to treat five kinds of dyes in wastewaters (Rhodamine B, MB, Amaranth, Congo red, and Eosin-Y). Comparing the adsorption capacity of these five dye wastewaters, it was proven that copper and copper oxides have photocatalytic degradation ability that can improve dye removal efficiency. Experimental adsorption data of MB were fit using several kinetic and isotherm models. Kinetic studies indicated that a pseudo-second order is the most suitable model for the adsorption process with a correlation coefficient of R2 > 0.999. The equilibrium adsorption data of MB showed that it followed the Langmuir isotherm; the Langmuir maximum adsorption capacity was 373 mg g−1. Compared with ordinary activated carbon, the maximum adsorption capacity of Cu-AC increased by 37.8%. Additionally, through thermodynamic calculations the negative value of ΔG and positive value of ΔH showed that the adsorption was a spontaneous and endothermic process. All the above results reveal that Cu-AC can be an effective absorbent for removing dyes from wastewater.
1. Introduction
Industrial effluents with extensive amounts of organic pollutants occur in textile, plastics, paper, pulp, and other industries.1,2 When dyes are the main organic pollutants that arrive in aquatic systems without proper treatment, then they can cause harmful impacts such as hindering light penetration, carcinogenic and/or mutagenic effects, and increasing COD and BOD in a water system.3 Additionally, they have acute and chronic effects on aquatic organisms which depend upon their concentration and duration of exposure.4 Therefore, large concentrations of dyes in wastewater discharging into the environment causes many significant environmental problems.5–8 Providing an environmentally friendly and low-cost method to control and govern wastewater is thus a highly essential concern.
Various physical and chemical methods like coagulation,9 reverse osmosis,10 photo-degradation,11 chemical oxidation,12 membrane filtration,13,14 biosorption,15 and adsorption treatment16,17 have been used to treat wastewater. However, they are limited due to problems like high costs and long treatment times. Therefore, it is imperative to explore new methods that have low capital investments and environmental risks.18 Adsorption treatment is one of the most studied dye removal methods due to its high efficiency, green (nontoxic) components, low cost, and easy removal.19 Many adsorbents used in adsorption treatments including bio-sorbents, zeolites, nano-perfluorooctyl alumina, multiwalled carbon nanotubes, and cellulose-based wastes have been reported to decolorize wastewater.19,20 Many efforts have been devoted to designing different adsorbents for removing colored dyes and wastewater treatment; using a small amount of an adsorbent should be able to remove a large amount of dye.17,21 However, the adsorbents described above have some shortcomings such as low adsorption capacities or separating powers.19,22 Since activated carbon is one of the most used adsorbents with a porous structure, a huge specific surface area, and strong adsorption capacity, it is widely used for removal of organic dyes and pollutants from industrial wastewater.23–27 Activated carbon can adsorb many dyes with a high adsorption capacity, but its adsorption efficiency is low. To overcome these disadvantages, Cu-AC as a potential high efficiency adsorbent was studied for treating wastewater with organic dyes in this paper. Because of the effect of photocatalytic degradation of copper, Cu-AC can effectively improve the removal capacity for dyes. Ahmed M. Mansour et al.28 reported that CuO nanoparticles exhibited good photo-catalytic activity in degrading the industrial pollutant, methylene-blue.
Both conventional and microwave heating methods are commonly used to prepare activated carbon.29 Conventional methods are of limited used due to their slow heating rate and low energy efficiency. However, using microwave heating to prepare Cu-AC can speed up the reaction rate and shorten reaction time because microwaves directly penetrate activated carbon, using the material inside to heat objects; thus, it is an internal molecular heating process which results in the temperature rising evenly both inside and outside of the material.30,31 Also, microwave heating leads to chemical bonds being vigorously vibrated and ruptured, which can result in copper being deposited on activated carbon. So, compared with traditional heating methods, microwave heating has a high efficiency. Shuheng Yao et al.30 examined the effect of nitric acid modified activated carbon on removing Pb(II) in water under microwave heating and their results showed that modified activated carbon had a significant effect on the removal of Pb(II) from water.
The aim of the present work was to prepare Cu-AC materials impregnated by cupric nitrate using microwave heating, and then test them for removing dyes in wastewater. Our method does not require costly and toxic precursors or a complicated procedure. Five kinds of dye wastewaters were adsorbed by Cu-AC and MB was selected as a model organic pollutant used to assess adsorption with Cu-AC samples under different preparation parameters to obtain the optimal parameters. In addition, this work also thoroughly studied the equilibrium, kinetics, and thermodynamics of the MB adsorption process. Thermodynamic parameters, such as ΔS, ΔH, and ΔG, were calculated at the same time.
2. Experimental
2.1. Experimental materials
The material used for preparing Cu-AC was powdered commercial activated carbon (CAC) purchased from a factory in Chengdu, China. All chemical reagents (HCl, Cu(NO3)2, etc.) used were analytical reagent grade purchased from a company in China. Rhodamine B, MB, Amaranth, Congo red and Eosin-Y molecular formulas are C28H31ClN2O3, C16H18ClN3S, C20H11N2Na3O10S3, C32H22N6Na2O6S2, and C20H6Br4Na2O; respective molar weights are 479.01 g mol−1, 319.85 g mol−1, 604.47 g mol−1, 696.68 g mol−1, and 691.85 g mol−1.
2.2. Preparation of copper loaded activated carbon
The carbon was washed with distilled water repeatedly until the effluent color was clear. The washed carbon was soaked in distilled water for 24 h and then filtered, after which it was soaked in aqueous 5% HCl solution with constant shaking for another 24 h to further remove other impurities and dust particles. The acidic solution was then removed by filtration and the carbon further washed with distilled water. After being dried under vacuum at ambient temperature (20 °C), 10 g CAC aliquots were placed in 50 mL copper nitrate solutions with different concentrations to load copper ions on the activated carbon. Then, the suspensions were filtered and the samples were dried at 120 °C until a constant weight was obtained. Finally, the material was heated in a microwave furnace in the absence of any gas. The optimal preparation conditions of Cu-AC were: microwave temperature 800 °C, microwave time 20 min, microwave power 300 W, and impregnation time 120 min. The optimum conditions for adsorption of MB were established as: 150 min contact time, pH of 7, and adsorbent dosage of 0.25 g. As shown in Fig. 1, a continuous controllable microwave power was used for the experiments.
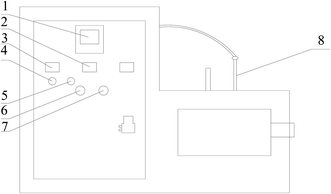 |
| | Fig. 1 Schematic of microwave heating equipment. (1) Temperature indicator, (2) current indicator, (3) voltage indicator, (4) hand regulator, (5) automatic regulator, (6) start button, (7) force close button, (8) thermocouple. | |
2.3. Characterization of activated carbon
The standard testing method of PR China (GB/T12496.10-1999) was used for measuring maximum adsorption capacity of MB with Cu-AC. The N2 adsorption and desorption isotherms of CAC and Cu-AC were carried out at 77 K using an automatic adsorption apparatus (Autosorb-1-C, USA) with a relative pressure (P/P0) range from 0 to 1. Scanning electron microscopy (SEM, Philips XL30ESEM-TMP) analysis was used to observe surface morphology and surface texture of the materials. EDS (Philips XL30ESEM-TMP) analysis was used to determine substance composition and element content. To study the changes of microstructures on activated carbon, an analysis was performed using a high-resolution X-ray diffraction (XRD) system (Philips PW1825). X-ray photoelectron spectroscopy (XPS) was performed with a PHI 5500 electron spectrometer (Physical Electronics, Inc., Chanhassen, MN, USA) using 200 W Mg radiation. Fourier transform infrared spectroscopy (FTIR) was applied to qualitatively identify important chemical functional groups of Cu-AC and CAC. FTIR spectra were obtained in the range 4000–400 cm−1 using an AVATAR 330 spectrophotometer (Thermo Fisher Scientific, USA). Raman analysis was recorded by a Ramascope System 1000 (Renishhwa, UK) spectroscopy.
2.4. Adsorption experiments
First, we chose five different dyes to test the adsorption performance of Cu-AC: Rhodamine B, MB, Amaranth, Congo red, and Eosin-Y, respectively. MB and Rhodamine B showed a positive charge in solution as they are cationic dyes; Amaranth, Congo red, and Eosin-Y showed a negative charge in solution as they are anionic dyes. The concentration of all five dyes in this experiment was 400 mg L−1, and the pH values of them were: Rhodamine B (pH = 1–2), MB (pH = 7–8), Amaranth (pH = 3–4), Congo red (pH = 4–5) and Eosin-Y (pH = 5–6). In a series of typical experiments, 40 mg of Cu-AC was dispersed into 20 mL each of five dyes with a concentration of 400 mg L−1. From adsorption efficiency and characteristics, we choose MB to study adsorption kinetics, isotherms, and thermodynamics. Batch adsorption experiments were carried out using MB to test the adsorption potential capacity of Cu-AC. The experiments were conducted in a series of 250 mL volumetric flasks; we mixed 0.1 g of adsorbent with a 100 mL aliquot of the MB solution at various initial concentrations (400, 500, 600, and 800 mg L−1). The volumetric flasks were shaken in a gas bath thermostatic oscillator with a shaking speed of 300 rpm until equilibrium was reached at three different temperatures (303 K, 313 K, and 323 K). When the adsorption equilibrium was reached, the amount of residual dye concentration was determined at 668 nm32 using a UV-vis spectrophotometer. The amounts of MB on an adsorbent (qe (mg g−1)) and removal efficiency (R) were calculated at the equilibrium conditions from the following eqn (1) and (2),33 respectively:| | |
Removal rate (%) = [(C0 − Ct)/C0] × 100%
| (2) |
where C0 (mg L−1), Ce (mg L−1), and Ct are the initial, equilibrium, and time t concentrations of MB, respectively. V is the volume of the solution (L) and M is the weight of the adsorbent (g).
Kinetic models were used to determine the rate of the adsorption process besides providing valuable information about reaction pathways. In this context, the kinetic models of pseudo-first order and pseudo-second order were investigated to understand the adsorption dynamics of MB on Cu-AC.
Adsorption isotherms were considered essential while determining the type of adsorption and the capacity of the adsorbent, since they provided information about the distribution of adsorbate between the liquid and solid phases at various equilibrium concentrations. Thus, the isotherm models of Freundlich, Langmuir, and Temkin were employed to assess the adsorption equilibrium characteristics of MB on Cu-AC.
All kinetic and isotherm models were fit to experimental data using their non-linear equations which are shown in Table 1.
Table 1 The equations of kinetic and isotherm models
| |
Equation |
| Kinetic models |
| Pseudo-first order |
 |
| Pseudo-first order |
 |
![[thin space (1/6-em)]](https://www.rsc.org/images/entities/char_2009.gif) |
| Isotherm models |
| Freundlich |
 |
| Langmuir |
 |
| Temkin |
 |
3. Results and discussion
3.1. Characterization of CAC and Cu-AC
3.1.1. Pore structure analysis. The N2 adsorption–desorption isotherms, as well as the pore size distribution plots of CAC and Cu-AC, are shown in Fig. 2 and 3, respectively. According to the International Union of Pure and Applied Chemistry (IUPAC) classification, the isotherms of CAC and Cu-AC may be assigned as type IV; there is a hysteresis loop, which is a notable characteristic of a four type isotherm, and it will occur in a way similar to the adsorption of micropores (the isotherms will rise rapidly). The pore size distributions of CAC and Cu-AC were analyzed by a DFT method and the specific surface areas of CAC and Cu-AC were calculated by a BET mathematical model8 with the results presented in Table 2. The diameter of copper molecules is 0.257 nm, and the average pore diameter of the CAC is 5.7322 nm, so copper molecules can easily enter into the pores of the activated carbon. As the copper loaded onto activated carbon, it improved the performance of it. For example, CAC showed a SBET of 1346 m2 g−1 and total pore volume of 0.847 mL g−1, while the SBET of Cu-AC increased by 13.97% and total pore volume of Cu-AC increased by 10.8%. It is obvious that the adsorption capacity of the adsorbent is not only related to surface properties, but also to pore structure. As shown in Fig. 3, most of the pores fall into a mesoporous (2–50 nm) category. Kasaoka et al.34 reported that adsorption occurred when the pore diameter of an adsorbent was at least 1.7 times as much as that of the adsorbate. The diameter of MB is about 0.8 nm, while the average pore size of Cu-AC is 5.7412 nm; thus, it can effectively adsorb methylene blue molecules.35
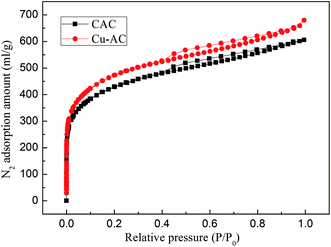 |
| | Fig. 2 N2 adsorption–desorption isotherms of the CAC and Cu-AC. | |
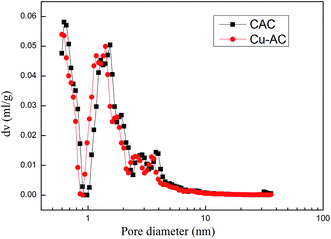 |
| | Fig. 3 Pore size distribution plots of CAC and Cu-AC. | |
Table 2 Surface physical characteristics of the CAC and Cu-AC
| Characteristic |
CAC |
Cu-AC |
| Specific surface area (m2 g−1) |
1346 |
1534 |
| Total pore volume (mL g−1) |
0.8470 |
0.9385 |
| Average pore size (nm) |
5.7322 |
5.7412 |
3.1.2. XRD diffraction and XPS analysis. In order to study changes in the microstructures of Cu-AC, X-ray diffraction (XRD) analysis was carried out to analyze CAC and Cu-AC. As shown in Fig. 4A, CAC mainly contains carbon and calcium carbonate (a part of the impurity not marked in Fig. 4A). As shown in Fig. 4B, XRD analysis of Cu-AC shows four broad diffraction peaks corresponding to four substances (C, CuO, Cu, and Cu2O, respectively).
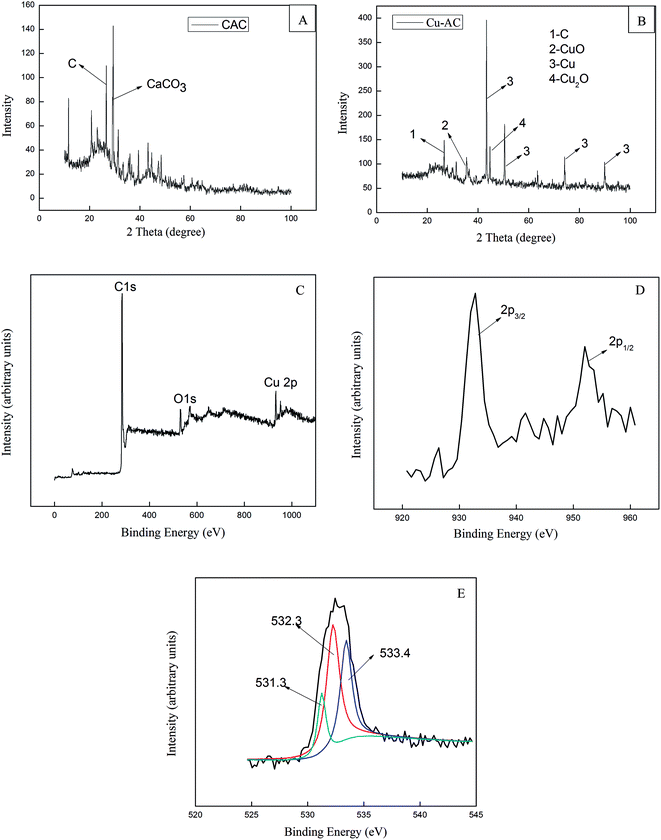 |
| | Fig. 4 XRD spectra of CAC (A), Cu-AC (B), the wide scan XPS spectrum of the Cu-AC (C), XPS of Cu-AC (D), and the peaks O 1s of Cu-AC (E). | |
Through analysis, the surface of activated carbon was determined to be mainly loaded with copper. Only a very small amount of copper oxides was formed on the surface of it; therefore, copper plays a main role in the adsorption process. Besides, compared with CAC, significant diffraction peaks of Cu or copper oxides were detected on the surface of Cu-AC, proving that cupric nitrate was successfully installed onto activated carbon and subsequently decomposed to copper oxides.
XPS is a technique widely used to determine the composition and structure of substances. The wide scan XPS spectrum of Cu-AC is shown in Fig. 4C, and it proves the existence of Cu, C, and O. Fig. 4D shows the Cu 2p3/2 and the Cu 2p1/2 spectrum region of Cu at peaks 932.8 eV and 952 eV, respectively. Jinhyeong Kwon et al.36 reported the peak at 932.8 eV indicates Cu 2p3/2 and the peak at 952.7 eV indicates Cu 2p1/2. In most cases, the Cu 2p3/2 found indicated existence of oxides of copper and elemental copper. Fig. 4E shows the spectrum region of O 1s, which is resolved into three peaks. The binding energy of Cu–O in the O 1s band is 531.3 eV, which indicates the existence of copper oxide.37 The peak at 532.2 eV is assigned the group of O–C–O. Besides, a peak at 533.4 eV was also observed, which is due to molecularly adsorbed CO2.38 These conclusions were confirmed using XRD.
3.1.3. SEM and EDS analysis. A scanning electron micrograph (SEM) was used to evaluate the surface morphology and texture of materials before and after copper loading. Obviously, there is a great difference between the surface morphology of CAC and Cu-AC. Fig. 5 shows the SEM images of CAC (A), Cu-AC (B), and EDS for Cu-AC (C). As shown in Fig. 5A, CAC has abundant pore structures and the surface is smooth, which is suitable for copper ions to be loaded on the above. Fig. 5B displays the surface morphology of Cu-AC; it is clear that the white balls (Cu, Cu2O, or CuO) are evenly distributed on the surface of activated carbon, which changes the surface properties and thus leads to higher adsorption capacity. The EDS result shows that Cu-AC has a certain content of Cu compounds (Fig. 5C) and these results are in good agreement with XRD, XPS, and SEM analysis.
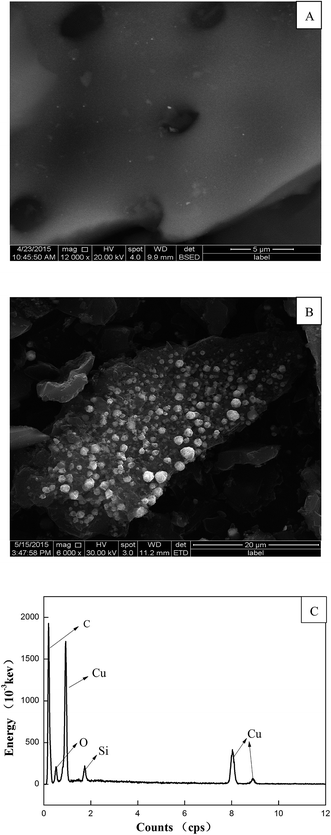 |
| | Fig. 5 SEM micrographs of CAC (A), Cu-AC (B), and EDS for Cu-AC (C). | |
3.1.4. FTIR analysis. The FTIR technique is an important tool to identify important functional groups present on the surface of materials which are capable of adsorbing organic pollutants. The FT-IR spectra of CAC and Cu-AC are shown in Fig. 6; both spectra have similar shapes in vibration band characteristics of carbonaceous materials and the high intense bands between 3200 and 3500 cm−1 can be attributed to O–H groups and N–H stretching vibration. The band at about 2920 cm−1 identifies the stretching vibrations of aliphatic groups –CH2–. The bands at about 1500 and 1750 cm−1 can be assigned to C![[double bond, length as m-dash]](https://www.rsc.org/images/entities/char_e001.gif) O axial deformation, such as highly conjugated C
O axial deformation, such as highly conjugated C![[double bond, length as m-dash]](https://www.rsc.org/images/entities/char_e001.gif) O stretching or C–O stretching in carboxyl groups, respectively. Bands at about 1200 cm−1 can be attributed to C–O stretching of carboxylate and ether structures. Thus, there are abundant functional groups for adsorbing pollutant ions on activated carbon. These functional groups play a significant role in adsorption of contaminant ions.39
O stretching or C–O stretching in carboxyl groups, respectively. Bands at about 1200 cm−1 can be attributed to C–O stretching of carboxylate and ether structures. Thus, there are abundant functional groups for adsorbing pollutant ions on activated carbon. These functional groups play a significant role in adsorption of contaminant ions.39
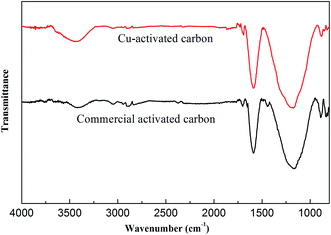 |
| | Fig. 6 Fourier transform infrared spectroscopy (FTIR) of commercial activated carbon and Cu-activated carbon. | |
3.1.5. Raman analysis. Raman spectroscopy is a technique used to obtain information about molecular vibration or rotational energy of samples, and then identify a substance and analyze the nature of the material. Additionally, it is widely used to characterize structural features of carbonaceous materials.40,41 The Raman spectrum of CAC and Cu-AC are shown in Fig. 7. These two spectra have obvious D and G bands, which appeared at approximately 1340 cm−1 (D band) and 1600 cm−1 (G band); D and G bands are typical in spectra of carbon materials. Only CAC has D and G peaks in the entire spectral range. However, there are three peaks which appeared at approximately 160 cm−1, 210 cm−1, and 620 cm−1 in Cu-AC. These indicate coexistence of a mixed phase (probably Cu2O mixed with CuO). As proved by the Cu-AC spectrum, it is due to coexistence of the Cu2O peak located near 615 cm−1 and the CuO phonon mode near 626 cm−1.42,43 Comparing the two Raman spectra indicated that copper, with different oxides, was successfully loaded onto activated carbon. These results are consistent with those of XRD, XPS, and EDS.
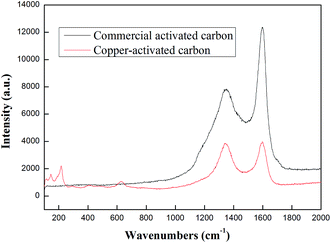 |
| | Fig. 7 Raman spectrum of commercial activated carbon and Cu-activated carbon. | |
3.1.6. Adsorption experiment. In a series of typical experiments, 40 mg of Cu-AC were dispersed into 20 mL each of five dyes with their concentrations at 400 mg L−1. The adsorption performance of Cu-AC for five dyes is summarized in Fig. 8A. After 4 h, the concentration of MB, Congo red, and Eosin-Y almost decreased to zero. Conversely, the equilibrium concentration of Rhodamine B and amaranth was about 75.79 mg L−1 and 161.3 mg L−1, respectively. Cu-AC before and after adsorbing five dyes is show in Fig. 8B and C. It is seen from Fig. 8A that the adsorption capacity of MB is better than Rhodamine B, which are both cationic dyes. Therefore, according to the difference of adsorption capacity and adsorption characteristics, in order to study the adsorption mechanism of Cu-AC, we chose MB to study the adsorption kinetics, isotherms, and thermodynamics.
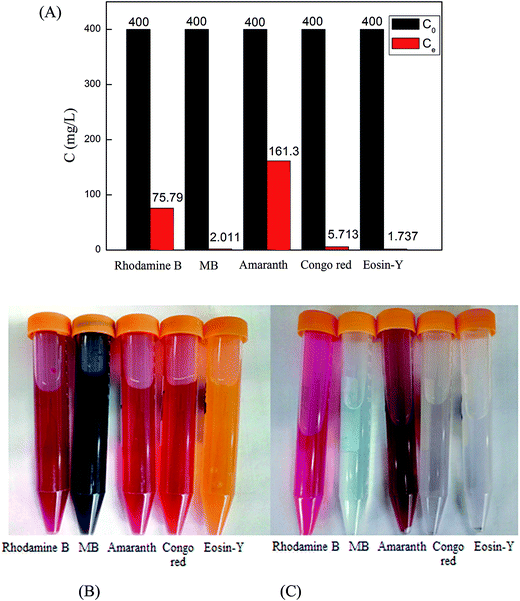 |
| | Fig. 8 The adsorption performance of Cu-AC for five dyes: (A) picture of Cu-AC before, (B) and after, (C) adsorbed five dyes. | |
3.1.7. Adsorption mechanism. N2 adsorption–desorption isotherms curve, X-ray diffraction (XRD) analysis, and zeta potential were performed to research the adsorption mechanism. It is well known that the physical adsorption properties of Cu-AC are determined by its physical properties (surface area and pore structure), and the electrostatic adherence of Cu-AC is decided by its surface charge.44 The specific surface area of CAC is 1346 m2 g−1 and adsorption capacity of MB on CAC is 202 mg g−1. However, the specific surface area of Cu-AC is 1534 m2 g−1 and adsorption capacity of MB on Cu-AC is 307.5 mg g−1. Before copper was loaded onto the surface of CAC, its adsorption capacity was 202 mg g−1, and it increased by 105.5 mg g−1 after copper was loaded on CAC, thus proving that MB adsorption on Cu-AC is mainly from physical adsorption. In order to verify the hypothesis of electrostatic adsorption, the surface charge of Cu-AC in the solution was studied in different pH solutions and the results are shown in Fig. 9. The zeta potential of Cu-AC shows positive potential in the range of pH < 7 and shows negative potential in the range of pH > 7. Therefore, in the range of pH < 7, there is repulsive interaction between Cu-AC and positively charged dyes. Conversely, there is electrostatic adherence between Cu-AC and negative charged dyes. Therefore, the MB solution shows it is positively charged and its pH is alkaline (pH = 7–8); conversely, Cu-AC shows a negative charge in this case, so there is electrostatic adherence between Cu-AC and MB. The XRD showed that copper and a small amount of copper oxides were loaded on CAC after thermal decomposition of cupric nitrate; compared with CAC, the adsorption capacity of Cu-AC was increased. Therefore, copper and copper oxides play a catalytic role in the adsorption process, which is favorable for the adsorption of dyes on Cu-AC. And the photocatalytic degradation ability of copper has been proven in many literature references; for example, M. J. Ndolomingo and R. Meijboom45 studied copper loaded on γ-Al2O3 for catalytic oxidation of methylene blue and Renu Sankar46 proved that copper oxide nanoparticles effectively degrade Coomassie brilliant blue R-250 dye under sunlight. Also, Ze Da Meng47 studied Cu/Cu2O-AC/TiO2 photocatalytic degradation of methyl orange under visible light. Gao Xiaoyan48 studied Cu2O on activated carbon (Cu2O/AC) catalyst for the photocatalytic degradation of pyrocatechol; they did a comparative experiment under dark and light conditions, and the results showed that copper caused photocatalytic degradation. We can see from this literature that copper has a catalytic effect on the removal of dyes, and the removal rate is higher with light. Therefore, copper plays a role in photocatalytic degradation of dyes.
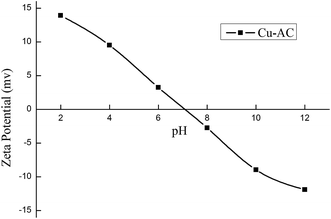 |
| | Fig. 9 The zeta potential of Cu-AC at room temperature. | |
3.2. Adsorption isotherms
The adsorption isotherm plays a vital role in describing the adsorption mechanism. When the adsorption process reaches an equilibrium state, it establishes how the molecules of an adsorbate are distributed between solid and liquid phases. Our adsorption experiments were conducted at various initial concentrations with different temperatures of 303, 313, and 323 K. To determine the adsorption capacity of Cu-AC to MB, three widely used isotherm models (Langmuir, Freundlich, and Temkin) were used to determine which one was the best match with our experimental data. The three isotherm models data are shown in Table 3. Fig. 10–12 show the Langmuir, Freundlich, and Temkin isotherm plots respectively, for adsorption of MB on Cu-AC. The results show that correlation (R2) with the Langmuir isotherm is larger (better) than with the other two isotherms. Hence, the Langmuir isotherm is the best and most appropriate for our experimental data. This implies a homogeneous and monolayer coverage of MB on the surface of Cu-AC. Moreover, another characteristic parameter of the Langmuir isotherm that can be used to evaluate the feasibility of adsorption on an adsorbent is a dimensionless factor RL, called the separation factor. It can be calculated by the following equation:49| |
 | (3) |
where C0 corresponds to the initial concentration of MB and KL is the Langmuir constant. The value of RL is related to the type of isotherm: unfavorable (RL > 1), linear (RL = 1), favorable (0 < RL < 1), and irreversible (RL = 0). In this work, the RL values of the MB adsorption were calculated to be in the range of 0.1717–0.5831, indicating that MB adsorption onto Cu-AC is favorable.
Table 3 Langmuir, Freundlich and Temkin constants for MB adsorption on samples at different temperature
| Langmuir coefficients |
| Isotherm constants |
qmax/(mg g−1) |
KL/(L mg−1) |
R2 |
| 302 |
360 |
24.76 |
0.999 |
| 313 |
370 |
25.07 |
0.999 |
| 323 |
373 |
32.63 |
0.999 |
| Freundlich coefficients |
| Isotherm constants |
KF/(mg g−1) |
1/n |
R2 |
| 303 |
14.76 |
0.0706 |
0.955 |
| 313 |
14.89 |
0.0665 |
0.989 |
| 323 |
15.09 |
0.0575 |
0.977 |
| Temkin coefficients |
| Isotherm constants |
A (L mg−1) |
B (J mg−1) |
R2 |
| 303 |
23.37 |
208.69 |
0.960 |
| 313 |
22.58 |
221.66 |
0.985 |
| 323 |
20.09 |
242.96 |
0.975 |
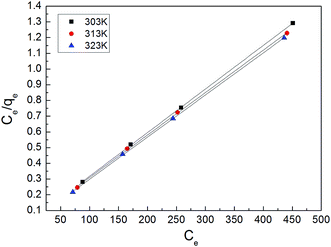 |
| | Fig. 10 Langmuir isotherm for MB removal using Cu-AC. | |
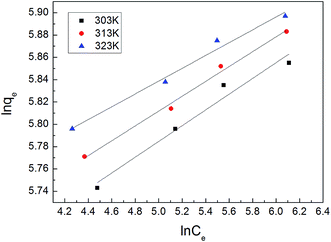 |
| | Fig. 11 Freundlich isotherm for MB removal using Cu-AC. | |
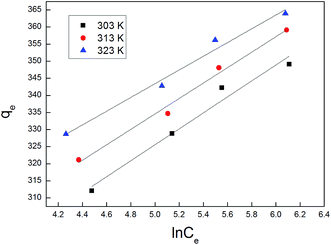 |
| | Fig. 12 Temkin isotherm for MB removal using Cu-AC. | |
3.3. Adsorption kinetics
The adsorption rate is a vital parameter as it helps determine the applicability of an adsorption mechanism and also provides useful information for designing the experimental process. Many applications including production of a decoloring process, wastewater treatment, and organic pollution removal need a rapid adsorption rate and short adsorption time. A pseudo first-order model and pseudo second-order model were applied to help understand the adsorption kinetics. The best fitting model was selected based on the linear regression correlation coefficient R2. Therefore, it was necessary to determine which model is most suitable for our experimental data. The results of the parameter data of the two models are calculated and summarized in Table 4, which helped us predict the adsorption rate and obtain much important information for the design and modeling processes. Fig. 13 and 14 show two model plots and the constants (k1, k2) and qe were determined using the slope and intercept of these plots, respectively. As shown in Table 4, the pseudo first-order model has the lower R2 values, and the experimental data is consistent with the pseudo second-order kinetic model with a R2 value close to 1.
Table 4 Kinetic parameters of pseudo first-order model and pseudo second-order model for MB adsorption
| C0/(mg L−1) |
qe,exp/(mg g−1) |
Pseudo-first order model |
Pseudo-second order model |
| k1/(L min−1) |
qe/(mg g−1) |
R2 |
k2/(g mg−1 min−1) |
qe/(mg g−1) |
R2 |
| 400 |
312 |
0.0326 |
103 |
0.9634 |
0.00036 |
327 |
0.9974 |
| 500 |
329 |
0.0206 |
89 |
0.9491 |
0.000358 |
341 |
0.9986 |
| 600 |
342 |
0.0261 |
122 |
0.9869 |
0.000343 |
355 |
0.9989 |
| 800 |
349 |
0.0229 |
100 |
0.9811 |
0.000336 |
361 |
0.9991 |
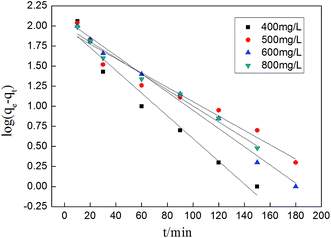 |
| | Fig. 13 Pseudo first-order plot for MB removal using Cu-AC. | |
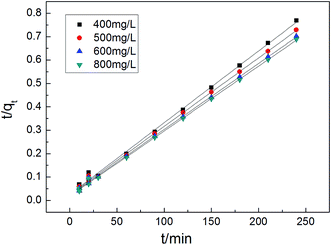 |
| | Fig. 14 Pseudo second-order plot for MB removal using Cu-AC. | |
3.4. Adsorption thermodynamics
Thermodynamic parameters such as entropy (ΔS), enthalpy (ΔH), and free energy (ΔG) were obtained by the following equations.| |
 | (4) |
| |
ΔGθ = −RT![[thin space (1/6-em)]](https://www.rsc.org/images/entities/char_2009.gif) ln ln![[thin space (1/6-em)]](https://www.rsc.org/images/entities/char_2009.gif) K K
| (5) |
| |
 | (7) |
Parameters such as ΔH and ΔS for MB can be determined from the slope and intercept of a van't Hoff plot of ln![[thin space (1/6-em)]](https://www.rsc.org/images/entities/char_2009.gif) KD versus 1/T as shown in Fig. 15 and Table 5. The values of ΔG were calculated from eqn (5) at different temperatures. The values of ΔG are found to be negative at 303 K, 313 K, and 323 K, indicating that the adsorption is a spontaneous process. The decrease in the negative value of ΔG with increasing temperature indicates that the adsorption of MB molecules is easier at higher temperatures.50 The positive values of ΔH indicate that the adsorption process substantiates physisorption and the adsorption reaction is an endothermic nature of MB adsorption, based on ΔH less than 80 kJ mol−1. Meanwhile, the positive ΔS suggested the affinity of activated carbon for MB and increasing randomness at the solid-solution interface during the adsorption process. In addition, some structural properties changed in the adsorbates and adsorbents.
KD versus 1/T as shown in Fig. 15 and Table 5. The values of ΔG were calculated from eqn (5) at different temperatures. The values of ΔG are found to be negative at 303 K, 313 K, and 323 K, indicating that the adsorption is a spontaneous process. The decrease in the negative value of ΔG with increasing temperature indicates that the adsorption of MB molecules is easier at higher temperatures.50 The positive values of ΔH indicate that the adsorption process substantiates physisorption and the adsorption reaction is an endothermic nature of MB adsorption, based on ΔH less than 80 kJ mol−1. Meanwhile, the positive ΔS suggested the affinity of activated carbon for MB and increasing randomness at the solid-solution interface during the adsorption process. In addition, some structural properties changed in the adsorbates and adsorbents.
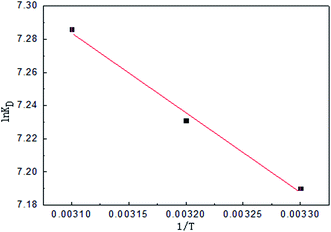 |
| | Fig. 15 Van't Hoff plot of MB in an adsorption solution of Cu-AC. | |
Table 5 Thermodynamic parameters for adsorption of MB on Cu-AC
| T/(K) |
KD/(mL g−1) |
ΔGθ/(kJ mol−1) |
ΔHθ/(kJ mol−1) |
ΔSθ/(J (mol K)−1) |
| 303 |
1326 |
−18.112 |
|
|
| 313 |
1381 |
−18.816 |
3.99 |
72.93 |
| 323 |
1459 |
−19.565 |
|
|
3.5. Comparison of present study with previous studies
The MB removal process using various adsorbents has been studied by many scholars, and the removal of MB using Cu-AC adsorbent is investigated in the present work. The results for MB removal reported in the literature are summarized in Table 6. It can be seen that the adsorption capacity of Cu-AC increases remarkably, indicating that copper loading increased its adsorption capacity through the photocatalytic degradation ability of copper oxide. And comparing Cu-AC with ordinary AC showed that the maximum adsorption capacity of Cu-AC was increased by 141 mg g−1.
Table 6 Summary of present work done using Cu-AC for removal of MB and comparison with previous studies
| Adsorbents |
Adsorbate |
Maximum adsorption capacity (mg g−1) |
References |
| Cu-AC |
MB |
373 |
This work |
| Ordinary AC |
MB |
232 |
This work |
| CuO-NP-AC |
MB |
10.55 |
51 |
| Ag-NP-AC |
MB |
71.43 |
52 |
| Pd-NP-AC |
MB |
75.40 |
53 |
| Fe-activated carbon |
MB |
259.74 |
35 |
| ZnS:Cu-NP-AC |
MB |
123.46 |
53 |
| NiS-NP-AC |
MB |
46–52 |
54 |
| Fe3O4@GPTMS@Lys |
MB |
185 |
55 |
4. Conclusion
Removal of MB was investigated using Cu-AC with wastewater. An adsorption experiment was carried out using Cu-AC prepared by microwave heating and its adsorption capacity was determined by the adsorption of MB. The adsorption process fits a pseudo second-order model, which suggests that the adsorption rate is more dependent on the availability of adsorption sites than on dye concentration. And, equilibrium data fit the Langmuir isotherm model, indicating monolayer coverage of MB molecules over the surface of Cu-AC. The Langmuir maximum adsorption capacity was 373 mg g−1. And, comparing Cu-AC with ordinary AC activity shows that its maximum adsorption capacity was greatly improved. Thermodynamic parameters (ΔS, ΔH, and ΔG) show that the physical adsorption process is endothermic and spontaneous. According to our experiments and characterization analysis, adsorption of methylene blue on copper activated carbon is primarily from physical adsorption and some electrostatic adsorption; also, copper loading on activated carbon plays a catalytic role. Based on all results, Cu-AC can be regarded as a potential adsorbent for the removal of methylene blue dye from aqueous solutions.
Acknowledgements
The authors would like to express their gratitude to the Specialized Research Fund for the National Natural Science Foundation of China (51504119, 21567013), National high technology research and development plan (2015AA020201, 863 Program), Yunnan Applied Basic Research Project (2015FB129), the Yunnan Provincial Science and Technology Innovation Talents Scheme Technological Leading Talent (2013HA002), and Extracurricular Science and Technology Innovation Fund Project of Kunming University of Science and Technology (2015YB004).
References
- M. Ibrahim, A. A. Shaltout, D. E. Atta, A. F. Jalbout and M. Soylak, J. Iran. Chem. Soc., 2009, 6(2), 364–372 CrossRef CAS
 .
. - I. M. Ismail, A. S. Fawzy, N. M. Abdel-Monem, M. H. Mahmoud and M. A. El-Halwany, J. Adv. Res., 2012, 3, 331–336 CrossRef CAS
 .
. - M. Ghaedi, A. G. Nasab, S. Khodadoust, R. Sahraei and A. Daneshfar, J. Ind. Eng. Chem., 2015, 21, 986–993 CrossRef CAS
 .
. - P. K. Gautam, R. K. Gautam, S. Banerjee, G. Lofrano, M. A. Sanroman, M. C. Chattopadhyaya and J. D. Pandey, J. Environ. Chem. Eng., 2015, 3, 2560–2568 CrossRef CAS
 .
. - R. M. M. El-Kilani and M. H. Belal, J. Adv. Res., 2010, 1, 243–253 CrossRef
 .
. - A. Mirzaei, A. Ebadi and P. Khajavi, Chem. Eng. J., 2013, 231, 550–560 CrossRef CAS
 .
. - Z. N. Liu, A. N. Zhou, G. R. Wang and X. G. Zhao, Chin. J. Chem. Eng., 2009, 17, 942–948 CrossRef CAS
 .
. - M. Ghaedi, M. Ghayedi, S. N. Kokhdan, R. Sahraei and A. Daneshfar, J. Ind. Eng. Chem., 2013, 19, 1209–1217 CrossRef CAS
 .
. - O. Tünay, I. Kabdasli, G. Eremektar and D. Orhon, Water Sci. Technol., 1996, 34, 9–16 CrossRef
 .
. - E. Forgacsa, T. Cserhátia and G. Oros, Environ. Int., 2004, 30, 953–971 CrossRef PubMed
 .
. - Q. Q. Zhai, T. Bo and G. X. Hu, J. Hazard. Mater., 2011, 198, 78–86 CrossRef CAS PubMed
 .
. - A. R. Tehrani-Bagha, N. M. Mahmoodi and F. M. Menger, Desalination, 2010, 260(1–3), 34–38 CrossRef CAS
 .
. - E. Alventosa-deLara, S. Barredo-Damas, M. I. Alcaina-Miranda and M. I. Iborra-Clar, J. Hazard. Mater., 2012, 209–210, 492–500 CrossRef CAS PubMed
 .
. - T. Robinson, G. McMullan, R. Marchant and P. Nigam, Bioresour. Technol., 2001, 77, 247–255 CrossRef CAS PubMed
 .
. - M. Ghaedi, S. Hajati, B. Barazesh, F. Karimi and G. Ghezelbash, J. Ind. Eng. Chem., 2013, 19, 227–233 CrossRef CAS
 .
. - C. Leodopoulos, D. Doulia, K. Gimouhopoulos and T. M. Triantis, Appl. Clay Sci., 2012, 70, 84–90 CrossRef CAS
 .
. - A. Asfaram, M. Ghaedi, S. Hajati, A. Goudarzi and A. A. Bazrafshan, Spectrochim. Acta, Part A, 2015, 145, 203–212 CrossRef CAS PubMed
 .
. - M. R. Awual, I. M. M. Rahman, T. Yaita, M. A. Khaleque and M. Ferdows, Chem. Eng. J., 2014, 236, 100–109 CrossRef CAS
 .
. - T. Jiang, Y. D. Liang, Y. J. He and Q. Wang, J. Environ. Chem. Eng., 2015, 3, 1740–1751 CrossRef CAS
 .
. - A. Mirzaei, A. Ebadi and P. Khajavi, Chem. Eng. J., 2013, 231, 550–560 CrossRef CAS
 .
. - M. Aut and B. H. Hameed, J. Ind. Eng. Chem., 2013, 19, 1153–1161 CrossRef
 .
. - D. Morshedi, Z. Mohammadi, M. M. A. Boojar and F. Aliakbari, Colloids Surf., B, 2013, 112, 245–254 CrossRef CAS PubMed
 .
. - S. L. Liu, Y. N. Wang and K. T. Lu, J. Porous Mater., 2014, 21, 459–466 CrossRef CAS
 .
. - J. M. V. Nabais, C. Laginhas, M. M. L. R. Carrott, P. J. M. Carrott, J. E. C. Amorós and A. V. N. Gisbert, Appl. Surf. Sci., 2013, 15, 919–924 CrossRef
 .
. - A. Policicchioa, E. Maccallinia, R. G. Agostinoa, F. Ciuchib, A. Aloisec and G. Giordanoc, Fuel, 2013, 104, 813–821 CrossRef
 .
. - B. Meryemoglu, S. Irmak, A. Hesenov and O. Erbatur, Int. J. Hydrogen Energy, 2012, 37, 17844–17852 CrossRef CAS
 .
. - E. Kacen and C. Kutahyali, J. Anal. Appl. Pyrolysis, 2012, 97, 149–157 CrossRef
 .
. - A. M. Mansour, E. M. El Bakry and N. T. Abdel-Ghani, J. Photochem. Photobiol., A, 2016, 327, 21–24 CrossRef CAS
 .
. - M. J. Ahmed, J. Environ. Chem. Eng., 2016, 4, 89–99 CrossRef CAS
 .
. - S. H. Yao, J. J. Zhang, D. K. Shen, R. Xiao, S. Gu, M. Zhao and J. Y. Liang, J. Colloid Interface Sci., 2016, 463, 118–127 CrossRef CAS PubMed
 .
. - A. Kundu, B. S. Gupta, M. A. Hashim and G. Redzwan, J. Cleaner Prod., 2015, 105, 420–427 CrossRef CAS
 .
. - A. Asfaram, M. Ghaedi, S. Hajati, A. Goudarzi and A. A. Bazrafshan, Spectrochim. Acta, Part A, 2015, 145, 203–212 CrossRef CAS PubMed
 .
. - M. Ghaedi, A. M. Ghaedi, M. Hossainpour, A. Ansari, M. H. Habibi and A. R. Asghari, J. Ind. Eng. Chem., 2014, 20, 1641–1649 CrossRef CAS
 .
. - S. Kasaoka, Y. Sakata, E. Tanaka and R. Naitoh, Int. Chem. Eng., 1989, 29, 734–742 Search PubMed
 .
. - S. Cheng, L. B. Zhang, H. Y. Xia, J. H. Peng, J. H. Shu and C. Y. Li, RSC Adv., 2016, 6, 78936–78946 RSC
 .
. - J. Kwon, S. Park, T. H. Lee, J.-M. Yang and C. S. Lee, Appl. Surf. Sci., 2011, 257, 5115–5120 CrossRef CAS
 .
. - S. P. Chenakin, R. Szukiewicz, R. Barbosa and N. Kruse, J. Electron Spectrosc. Relat. Phenom., 2016, 209, 66–77 CrossRef CAS
 .
. - Y. F. Xi, Z. M. Sun, T. Hreid, G. A. Ayoko and R. L. Frost, Chem. Eng. J., 2014, 247, 66–74 CrossRef CAS
 .
. - M. Ahmaruzzaman and V. K. Gupta, Ind. Eng. Chem. Res., 2011, 50, 13589–13613 CrossRef CAS
 .
. - A. Sadezky, H. Muckenhuber, H. Grothe, R. Niessner and U. Pöschl, Carbon, 2005, 43, 1731–1742 CrossRef CAS
 .
. - X. Xu, W. Song, D. G. Huang, B. Y. Gao, Y. Y. Sun, Q. Y. Yue and K. F. Fu, Colloids Surf., A, 2015, 476, 68–75 CrossRef CAS
 .
. - M. H. Chou, S. B. Liu, C. Y. Huang, S. Y. Wu and C. L. Cheng, Appl. Surf. Sci., 2008, 254, 7539–7543 CrossRef CAS
 .
. - T. H. Tran and V. T. Nguyen, Mater. Sci. Semicond. Process., 2016, 46, 6–9 CrossRef CAS
 .
. - L. B. Zhang, Y. H. Liu, S. X. Wang, B. G. Liu and J. H. Peng, RSC Adv., 2015, 99618–99626 RSC
 .
. - M. J. Ndolomingo and R. Meijboom, Appl. Catal., A, 2014, 33–43 Search PubMed
 .
. - R. Sankar, P. Manikandan, V. Malarvizhi, T. Fathima, K. S. Shivashangari and V. Ravikumar, Spectrochim. Acta, Part A, 2014, 746–750 CrossRef CAS PubMed
 .
. - Z. D. Meng, T. Ghosh, J. H. Cho, L. Zhu, C. Y. Park, J. G. Choi and W. C. Oh, J. Korean Ceram. Soc., 2011, 571–576 CrossRef CAS
 .
. - X. Y. Gao, X. J. Zhang, Y. C. Tang, Y. B. Huang, Y. Zhang and Y. Q. Zi, Kinet. Catal., 2011, 672–677 CAS
 .
. - H. Gupta and P. R. Gogate, Ultrason. Sonochem., 2016, 30, 113–122 CrossRef CAS PubMed
 .
. - P. K. Gautam, R. K. Gautam, R. S. Saroj and J. D. Pandey, Proc. Natl. Acad. Sci., India, Sect. A, 2015, 85, 35–39 CrossRef CAS
 .
. - M. Ghaedi, A. M. Ghaedi, M. Hossainpour, A. Ansari, M. H. Habibi and A. R. Asghari, J. Ind. Eng. Chem., 2014, 20, 1641–1649 CrossRef CAS
 .
. - K. Mahapatra, D. S. Ramteke and L. J. Paliwal, J. Anal. Appl. Pyrolysis, 2012, 95, 79–86 CrossRef CAS
 .
. - A. Asfaram, M. Ghaedi, S. Hajati, A. Goudarzi and A. A. Bazrafshan, Spectrochim. Acta, Part A, 2015, 145, 203–212 CrossRef CAS PubMed
 .
. - M. Ghaedi, M. Pakniat, Z. Mahmoudi, S. Hajati, R. Sahraei and A. Daneshfar, Spectrochim. Acta, Part A, 2014, 123, 402–409 CrossRef CAS PubMed
 .
. - Y. R. Zhang, S. L. Shen, S. Q. Wang, J. Huang, P. Su, Q. R. Wang and B. X. Zhao, Chem. Eng. J., 2014, 239, 250–256 CrossRef CAS
 .
.
|
| This journal is © The Royal Society of Chemistry 2017 |
 Open Access Article
 *abcd,
Libo Zhangabcd,
Jinhui Pengabcd,
Chunyang Liabcd and
Shengzhou Zhangabcd

![[double bond, length as m-dash]](https://www.rsc.org/images/entities/char_e001.gif) O axial deformation, such as highly conjugated C
O axial deformation, such as highly conjugated C![[double bond, length as m-dash]](https://www.rsc.org/images/entities/char_e001.gif) O stretching or C–O stretching in carboxyl groups, respectively. Bands at about 1200 cm−1 can be attributed to C–O stretching of carboxylate and ether structures. Thus, there are abundant functional groups for adsorbing pollutant ions on activated carbon. These functional groups play a significant role in adsorption of contaminant ions.39
O stretching or C–O stretching in carboxyl groups, respectively. Bands at about 1200 cm−1 can be attributed to C–O stretching of carboxylate and ether structures. Thus, there are abundant functional groups for adsorbing pollutant ions on activated carbon. These functional groups play a significant role in adsorption of contaminant ions.39


![[thin space (1/6-em)]](https://www.rsc.org/images/entities/char_2009.gif) ln
ln![[thin space (1/6-em)]](https://www.rsc.org/images/entities/char_2009.gif) K
K

![[thin space (1/6-em)]](https://www.rsc.org/images/entities/char_2009.gif) KD versus 1/T as shown in Fig. 15 and Table 5. The values of ΔG were calculated from eqn (5) at different temperatures. The values of ΔG are found to be negative at 303 K, 313 K, and 323 K, indicating that the adsorption is a spontaneous process. The decrease in the negative value of ΔG with increasing temperature indicates that the adsorption of MB molecules is easier at higher temperatures.50 The positive values of ΔH indicate that the adsorption process substantiates physisorption and the adsorption reaction is an endothermic nature of MB adsorption, based on ΔH less than 80 kJ mol−1. Meanwhile, the positive ΔS suggested the affinity of activated carbon for MB and increasing randomness at the solid-solution interface during the adsorption process. In addition, some structural properties changed in the adsorbates and adsorbents.
KD versus 1/T as shown in Fig. 15 and Table 5. The values of ΔG were calculated from eqn (5) at different temperatures. The values of ΔG are found to be negative at 303 K, 313 K, and 323 K, indicating that the adsorption is a spontaneous process. The decrease in the negative value of ΔG with increasing temperature indicates that the adsorption of MB molecules is easier at higher temperatures.50 The positive values of ΔH indicate that the adsorption process substantiates physisorption and the adsorption reaction is an endothermic nature of MB adsorption, based on ΔH less than 80 kJ mol−1. Meanwhile, the positive ΔS suggested the affinity of activated carbon for MB and increasing randomness at the solid-solution interface during the adsorption process. In addition, some structural properties changed in the adsorbates and adsorbents..
.
.
.
.
.
.
.
.
.
.
.
.
.
.
.
.
.
.
.
.
.
.
.
.
.
.
.
.
.
.
.
.
.
.
.
.
.
.
.
.
.
.
.
.
.
.
.
.
.
.
.
.
.
.


