 Open Access Article
Creative Commons Attribution 3.0 Unported Licence
Synthesis and characterisation of cerium(IV)-incorporated hydrous iron(III) oxide as an adsorbent for fluoride removal from water†
Kankan Mukhopadhyayb,
Abir Ghosha,
Supriyo Kumar Dasb,
Bibhutibhushan Showc,
Palani Sasikumar*a and
Uday Chand Ghosh *a
*a
aDepartment of Chemistry, Presidency University, 86/1 College Street, Kolkata-700073, India. E-mail: ucghosh@yahoo.co.in; sasikumar.chem@presiuniv.ac.in; Fax: +91-33-2241-3893; Tel: +91-33-2241-3893
bDepartment of Geology, Presidency University, 86/1 College Street, Kolkata-700073, India
cDepartment of Chemistry, Jadavpur University, Kolkata-700032, India
First published on 16th May 2017
Abstract
Surface-altered hydrous iron(III) oxide incorporating cerium(IV) (CIHFO) was prepared and characterised via modern analytical tools for applications in fluoride removal from groundwater. The material with a Fe![[thin space (1/6-em)]](https://www.rsc.org/images/entities/char_2009.gif) :
:![[thin space (1/6-em)]](https://www.rsc.org/images/entities/char_2009.gif) Ce ratio of 1.0
Ce ratio of 1.0![[thin space (1/6-em)]](https://www.rsc.org/images/entities/char_2009.gif) :
:![[thin space (1/6-em)]](https://www.rsc.org/images/entities/char_2009.gif) 0.5 (mol
0.5 (mol![[thin space (1/6-em)]](https://www.rsc.org/images/entities/char_2009.gif) :
:![[thin space (1/6-em)]](https://www.rsc.org/images/entities/char_2009.gif) mol) calcined at 473 K shows 24.8 ± 0.5 mg F− g−1 adsorption capacity at pH 5.0–7.0 from a solution with a concentration of 15.0 mg L−1; the material was established to be microcrystalline (∼5 nm) with a 140.711 m2 g−1 surface area, irregular surface morphology and porous structure. The time-dependent fluoride adsorption capacities of CIHFO at 293, 303 and 313 K are well described by the pseudo-first order, pseudo-second order and Weber–Morris kinetic models, respectively. The adsorption reaction occurs via a film/boundary layer diffusion process. The very low Arrhenius activation energy (Ea = 0.026 kJ mol−1) indicates the high feasibility of fluoride adsorption over CIHFO. The equilibrium data fit better with the Freundlich and Redlich–Peterson (g < 1.0) isotherms than with the Langmuir isotherm, which suggests multilayer adsorption. The values of the Freundlich parameters, n = 3.10, 4.47 and 7.57 and KF = 8.58, 10.88 and 11.25 at 293, 303 and 313 K, respectively, indicate high affinity for fluoride. Thermodynamic analysis of the reaction equilibrium shows that the reaction is highly exothermic (ΔH0 = −25.924 and −36.279 kJ mol−1 for Ci = 25.0 and 35.0 mg L−1), whereas the negative ΔG0 values indicate the spontaneous nature of the reaction. The fluoride adsorption over CIHFO occurs via ion-exchange that progresses to chemisorption. The presence of sulphate shows an adverse influence on fluoride adsorption by CIHFO, and the fluoride level of 2.4 g per L groundwater (9.05 mg F L−1) can be reduced below the permissible value.
mol) calcined at 473 K shows 24.8 ± 0.5 mg F− g−1 adsorption capacity at pH 5.0–7.0 from a solution with a concentration of 15.0 mg L−1; the material was established to be microcrystalline (∼5 nm) with a 140.711 m2 g−1 surface area, irregular surface morphology and porous structure. The time-dependent fluoride adsorption capacities of CIHFO at 293, 303 and 313 K are well described by the pseudo-first order, pseudo-second order and Weber–Morris kinetic models, respectively. The adsorption reaction occurs via a film/boundary layer diffusion process. The very low Arrhenius activation energy (Ea = 0.026 kJ mol−1) indicates the high feasibility of fluoride adsorption over CIHFO. The equilibrium data fit better with the Freundlich and Redlich–Peterson (g < 1.0) isotherms than with the Langmuir isotherm, which suggests multilayer adsorption. The values of the Freundlich parameters, n = 3.10, 4.47 and 7.57 and KF = 8.58, 10.88 and 11.25 at 293, 303 and 313 K, respectively, indicate high affinity for fluoride. Thermodynamic analysis of the reaction equilibrium shows that the reaction is highly exothermic (ΔH0 = −25.924 and −36.279 kJ mol−1 for Ci = 25.0 and 35.0 mg L−1), whereas the negative ΔG0 values indicate the spontaneous nature of the reaction. The fluoride adsorption over CIHFO occurs via ion-exchange that progresses to chemisorption. The presence of sulphate shows an adverse influence on fluoride adsorption by CIHFO, and the fluoride level of 2.4 g per L groundwater (9.05 mg F L−1) can be reduced below the permissible value.
1. Introduction
The generic term ‘fluorosis’ is closely associated with elevated levels of fluoride concentration in drinking water. A report called ‘Second thoughts about fluoride’, which was published in Scientific American in 2008, demonstrated the severity of fluoride poisoning.1 Increased fluoride in groundwater is, therefore, recognised as a major threat to human health by the European Union (EU), World Health Organisation (WHO) and Environmental Protection Agency (EPA). Fluoride contamination is considered a top priority to ensure the quality of drinking water after microbial pollution.2 The beneficial and detrimental effects of fluoride to human health are highly dependent upon its concentration in drinking water and the volume of water consumed daily. The unusual bio-chemical behaviour of fluoride has necessitated restrictions on the use of groundwater for drinking without prior removal (treatment) of fluoride. At present, 32 countries worldwide report endemic levels of fluorosis.3 This problem has also been reported in India for the past few decades and is now considered a natural crisis. The supply of treated surface water to entire fluoride-prone areas is challenging, as it requires the investment of huge funds for technological shifts, manpower, operation and maintenance. Thus, it can be safely stated that access to safe drinking water is correlated with higher income levels, whereas poor rural populations are forced to consume more fluoride-contaminated water. The simplest and the cheapest way to ensure safe water is through cost-effective treatment technology. Defluoridation of excess fluoride (above 1.5 mg L−1) from fluoride-rich groundwater is the only pragmatic option to overcome this problem. The adsorption technique is often considered to be the most efficient and commercially viable method for fluoride removal3 from drinking water compared to other conventional methods. The criteria to select a suitable adsorbent include adsorption capacity, cost of material, ease of operation, and the possibility of regeneration and reuse. Bimetallic and polymetallic nanocrystallites have drawn attention in recent decades for their efficacy in this process. Incorporation of a metal ion inside the lattice of another metal oxide results in structural modification, lattice defects, and size gradation of the metallic product. This rearrangement increases the porosity, surface area, and number of adsorption sites with oxygen and hydroxyl groups, which in turn triggers dynamic adsorption. Iron(III) oxide is one of the most effective natural water purifiers; it is abundantly available in the earth's crust.4 Hydrous iron(III) oxide, however, shows relatively low adsorption affinity for hard fluoride ions in aqueous media.5 Numerous bimetal hydrous oxides of La(III), Ce(IV), Ti(IV) and Zr(IV) with Fe(III) or Al(III) have shown relatively high binding affinities with fluoride.4–18 Consequently, different researchers have prepared binary and ternary composites of metal oxides containing Fe(III) and have investigated their efficiencies in fluoride removal.4–6,16–31 As Ce(IV) is small in size and has a high positive charge (high ionic potential), it has a strong binding affinity with fluoride. Therefore, the surface of hydrous CeO2 should have greater adsorption affinity for fluoride. Another unique feature of cerium oxide is its highly facile transformation between the +4 and +3 oxidation states.6 However, the use of hydrous CeO2 in defluoridation technology would not be cost effective for rural populations of developing countries, such as India. Thus, it would be beneficial to alter the surface of hydrous Fe(III) oxide by incorporating different proportions of Ce(IV) oxide to upgrade the fluoride removal efficiency of pure Fe(III) oxide.In this work, an attempt has been made to tune the synthesis of Ce(IV)-incorporated hydrous Fe(III) oxide (CIHFO) and apply it for fluoride adsorption from water at neutral pH. The optimised material has been characterized by modern analysis techniques, viz. powder X-ray diffraction (XRD), X-ray fluorescence (XRF), Brunauer–Emmett–Teller (BET) analysis, atomic force microscopy (AFM), transmission electron microscopy (TEM), scanning electron microscopy (SEM), optical microscopy (OM), Fourier transform infrared (FTIR) spectroscopy, thermogravimetry analysis (TGA) and differential thermal analysis (DTA). Finally, the adsorption of fluoride on the optimised material (Fe![[thin space (1/6-em)]](https://www.rsc.org/images/entities/char_2009.gif) :
:![[thin space (1/6-em)]](https://www.rsc.org/images/entities/char_2009.gif) Ce = 1.0
Ce = 1.0![[thin space (1/6-em)]](https://www.rsc.org/images/entities/char_2009.gif) :
:![[thin space (1/6-em)]](https://www.rsc.org/images/entities/char_2009.gif) 0.5) was further investigated systematically. Thus, this article reports the synthesis, characterisation and fluoride removal efficacy of this promising newly developed material in aqueous medium.
0.5) was further investigated systematically. Thus, this article reports the synthesis, characterisation and fluoride removal efficacy of this promising newly developed material in aqueous medium.
2. Materials and methods
2.1. Reagents
The chemicals used were ceric ammonium nitrate ((NH4)2[Ce(NO3)6]), ferric chloride (FeCl3), sodium fluoride (NaF), sodium hydroxide (NaOH), hydrochloric acid (HCl), nitric acid (HNO3), liquid ammonia and ammonium carbonate [(NH4)2CO3]. All chemicals and reagents used in this work were of guaranteed reagent (G.R.) grade (Merck India, Mumbai).2.2. Fluoride solution
A standard stock solution of fluoride (1000 mg L−1) was prepared by dissolving an appropriate amount (2.21 g) of sodium fluoride in one litre of de-ionised water. The required concentrations of fluoride solution were achieved by appropriate dilution of the stock solution with fluoride-free double de-ionized water.2.3. Fluoride analysis
The fluoride samples were analysed using an ion-selective electrode (Hach, USA). Here, 25 mL of filtrate was placed in a polythene (PE) beaker, and fluoride adjustment buffer powder (Hach) was dissolved to adjust the from pH 5.0 to 7.8. The calibrated ion-selective electrode was then dipped in a sample solution to determine the fluoride concentration.2.4. Ce(IV)-incorporated hydrous Fe(III) oxide (CIHFO) preparation
The method of preparation of hydrous cerium(IV)-incorporated iron(III) oxide adopted here is different from previously described methods.6,18 Here, a batch of cerium incorporated hydrous Fe(III) oxide was synthesised by co-precipitation in an ambient laboratory environment. The concentration of ferric chloride (0.1 M) solution in 0.1 M HCl was kept constant, while the concentration of ammonium ceric nitrate in 0.1 M HNO3 was varied. Both solutions were mixed together, and the pH of the mixture was increased to ∼6.0 to 7.0 by dropwise addition of ammonia solution (mixture of 25% ammonia solution and 0.1 M ammonium carbonate solution). The brownish-yellow gel-like precipitate was developed and was aged for 24 hours. The precipitate was filtered through a 0.45 μm membrane filter and repetitively washed with deionised water to remove extraneous contaminants. The residue was dried at 75 °C (±5 °C) in an air oven. The hot mass immediately after drying was treated with cold water in order to break it into small particles. The air-dried particles were ground and sieved to collect the particles with sizes between 50 and 100 mesh (particle size: 140 to 290 μm), which were used to conduct the experiments.2.5. Instruments
Powder X-ray diffraction (XRD), X-ray fluorescence (XRF), optical microscopy (OM), scanning electron microscopy (SEM), transmission electron microscopy (TEM), atomic force microscopy (AFM), Brunauer–Emmett–Teller (BET) nitrogen (vapour) adsorption–desorption and Föurier transform infrared (FTIR) spectroscopy were used to characterize the materials. The powder XRD patterns of the materials were recorded using an X-ray diffractometer (Bruker D8 Advance) equipped with Cu-Kα radiation (λ = 1.5418 Å) at a scanning speed of 0.4° min−1 between 2θ = 10° and 70°, operated at a 40 kV voltage and an applied potential current of 30 mA. Transmission electron microscopic (TECNAI G2 30 ST, FEI, Netherlands) images were recorded at different magnifications. The samples for TEM were suspended in 0.25% vinylec-E chloroform solution by sonication, and one drop of the suspension was casted onto a carbon film-coated copper grid and dried under an IR lamp. The grid was then mounted on a Double Tilt Specimen Holder to perform the TEM analysis. X-ray fluorescence (XRF-Panalytical Axios) of the optimised material was analysed by accurately weighing 8.0 g of sample (∼200 mesh), which was thoroughly mixed with 1.0 g of wax. This mixture was packed in an aluminium cup 40 mm in diameter and pressed at 200 KN. This was exposed to X-rays for analysis. Atomic force microscopic (AFM) images were taken with an Innova Atomic Force Microscope (Bruker AXS Pte Ltd) using optical beam deflection to monitor the displacement of a micro-fabricated silicon cantilever with a spring constant of 80 Nm−1 to visualize the topography of the mixed oxide surface. OM images were recorded using a Nikon Eclipse LV100 POL microscope. TG and DT were measured using a Perkin Elmer system; the variations in weight and heat energy during the phase transitions of the materials were measured in a variety of gaseous environments in the temperature range of 50 °C to 1200 °C. The surface areas of the materials were analyzed by the Brunauer–Emmett–Teller (BET) method by N2(vapour) adsorption at 77 K using a high-speed surface analyzer (Quantachrome Nova4000e). The adsorption of N2(vapour) at a temperature of 77 K results in an adsorption isotherm commonly referred to as the Brunauer–Emmett–Teller (BET) isotherm. Multiplying the number of gas molecules required to cover an adsorbent surface with a monolayer of adsorbed molecules with the cross-sectional area of an adsorbate material gives the approximate sample surface area. The pHPZC values of the samples were analysed by the pH metric method used by Babić et al.322.6. Experimental design
Batch adsorption is a systematic static process to evaluate the removal efficacy of an adsorbent. Here, a measured volume of fluoride solution (100 mL) with a desired initial concentration (Ci, mg L−1) was placed in a 250 mL PE bottle along with a definite mass (0.050 g) of CIHFO (except for the dose variation experiments) and agitated at 250 (±5) rpm inside a thermostatic shaker for 2 hours (except for the time-dependent experiments). The solid mass was immediately separated by filtration, and the filtrate was analysed to determine the residual concentration of fluoride (Cf, mg L−1). As the material was prepared with the aim of treating groundwater, the batch experimental program was conducted in the neutral pH range, except for the pH influence experiments.The composition of CIHFO was optimised by preparing samples with varying mole proportions of Ce in Fe. To optimise the drying temperature, the optimized CIHFO samples were separately dried for five hours at 100 °C (373 K) to 600 °C (873 K) with increments of 100 °C; these samples were employed for the adsorption experiments described above.
The effects of the solution pH on fluoride adsorption were investigated independently at pre-programmed pHi values from 3.0 to 10.0 by unit increments, employing two different fluoride solutions (Ci: 10.0 and 15.0 mg L−1). The pH value of each test solution was adjusted with 0.1 M HCl or 0.1 M NaOH solution.
Time-dependent fluoride adsorption experiments with CIHFO (reaction kinetics) were conducted with three separate concentrations of fluoride solution. The same experiment was also carried out at three different temperatures (293 K, 303 K and 313 K) with a fixed fluoride concentration (15.0 mg L−1).
Equilibrium experiments were carried out using fluoride solutions with Ci values ranging from 10.0 to 60.0 mg L−1. The scheduled experiments were conducted separately at 293 K, 303 K, and 313 K at a solution pHi of 7.0, an agitation time of 2 hours and a speed of 250 ± 5 rpm. The fluoride concentration remaining at equilibrium (Ce, mg L−1) was determined by the ion-selective electrode, and the equilibrium capacity (Qe, mg g−1) was calculated. The thermodynamic parameters (ΔS0, ΔH0, ΔG0) were evaluated from the results of the equilibrium analysis.
The adsorption of fluoride over tuned CIHFO may be adversely influenced by the presence of ions occurring in groundwater, such as Ca2+, Mg2+, HPO42−, SO42−, HCO3−, NO3− and Cl−. To evaluate this interference, batch absorber experiments were conducted at pH ∼7.0 as described above using the fluoride solution with Ci = 10.0 mg L−1 in the presence of different concentrations of competing ions.
For the desorption experiments, 0.05 g of fluoride-enriched CIHFO (16.4 mg F− g−1) was agitated at 250 (±5) rpm for one hour along with 50 mL of NaOH solution with various concentrations in the range from 0.1 to 4.0 M.
2.7. Adsorption capacity
Immediately after each experiment, the adsorbent particles were filtered through a 0.45 μm membrane filter. The residual fluoride level in each filtrate was analysed. The amount of fluoride adsorbed by CIHFO was calculated using the following mass balance equation (eqn (1)):| Qe = (Ci − Cf) × V/M | (1) |
2.8. Field validation
To establish the applicability of CIHFO in groundwater treatment, validation of the removal efficacy of the optimised material with field water is an essential step. To achieve this goal, water samples were collected in thoroughly cleaned PE bottles from different hand pump-attached tube wells in the Kashipur block, the most adversely fluoride-affected region of Purulia district, West Bengal, India. The fluoride concentrations of the collected water samples were analysed in the laboratory by the ion selective electrode, and the water samples with maximum fluoride concentrations (Kharai village) were used for the field validation.3. Results and discussion
3.1. Influence of cerium content in CIHFO on fluoride adsorption
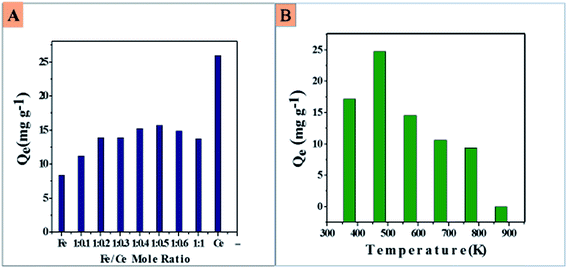
Fig. 1A shows the changes in the fluoride adsorption capacity with changing mole ratio of Fe(III) to Ce(IV) in CIHFO from 1.0![[thin space (1/6-em)]](https://www.rsc.org/images/entities/char_2009.gif) :
:![[thin space (1/6-em)]](https://www.rsc.org/images/entities/char_2009.gif) 0.0 to 0.0
0.0 to 0.0![[thin space (1/6-em)]](https://www.rsc.org/images/entities/char_2009.gif) :
:![[thin space (1/6-em)]](https://www.rsc.org/images/entities/char_2009.gif) 1.0; the results showed an increase of the fluoride adsorption amount with increasing cerium content from 1.0
1.0; the results showed an increase of the fluoride adsorption amount with increasing cerium content from 1.0![[thin space (1/6-em)]](https://www.rsc.org/images/entities/char_2009.gif) :
:![[thin space (1/6-em)]](https://www.rsc.org/images/entities/char_2009.gif) 0.0 to 1.0
0.0 to 1.0![[thin space (1/6-em)]](https://www.rsc.org/images/entities/char_2009.gif) :
:![[thin space (1/6-em)]](https://www.rsc.org/images/entities/char_2009.gif) 0.5, followed by a decrease until the Fe
0.5, followed by a decrease until the Fe![[thin space (1/6-em)]](https://www.rsc.org/images/entities/char_2009.gif) :
:![[thin space (1/6-em)]](https://www.rsc.org/images/entities/char_2009.gif) Ce mole proportion reached 1
Ce mole proportion reached 1![[thin space (1/6-em)]](https://www.rsc.org/images/entities/char_2009.gif) :
:![[thin space (1/6-em)]](https://www.rsc.org/images/entities/char_2009.gif) 1. Similar observations have been reported by others.7,10 Although the fluoride adsorption was highest for the pure ceria material (25.3 mg g−1), the fluoride adsorption amount was appreciably high compared to pure iron oxide at a Fe to Ce ratio of 1.0
1. Similar observations have been reported by others.7,10 Although the fluoride adsorption was highest for the pure ceria material (25.3 mg g−1), the fluoride adsorption amount was appreciably high compared to pure iron oxide at a Fe to Ce ratio of 1.0![[thin space (1/6-em)]](https://www.rsc.org/images/entities/char_2009.gif) :
:![[thin space (1/6-em)]](https://www.rsc.org/images/entities/char_2009.gif) 0.5. This may be beneficial in light of the cost of the material.
0.5. This may be beneficial in light of the cost of the material.
Fig. 1B shows that the adsorption amount/gram of calcined CIHFO decreased with increasing calcination temperature at and above 300 °C (573 K). The adsorbent calcined at 200 °C (473 K) showed the maximum fluoride adsorption amount (24.8 mg g−1) from an aqueous solution of fluoride (Ci = 15.0 mg L−1). As the adsorbent material was prepared by a co-precipitation method, the as-prepared CIHFO contains hydrous oxides of iron and cerium; the hydroxyl groups on these metal oxide surfaces are the primary adsorption sites for fluoride adsorption. At the temperature of 473 K, the surface water molecules attached by hydrogen bonding are removed, and the surface hydroxyl groups become available to the solute for adsorption reactions, resulting in a higher adsorption value. These hydroxyl groups were deliberately eliminated from the surfaces of the metal oxides by increasing the calcination temperature (>473 K), which is similar to other reports.8,10,16 As a result, the adsorption capacity of the proposed adsorbent decreased sharply.
3.2. Characterisation of CIHFO
The CIHFO material with a Fe![[thin space (1/6-em)]](https://www.rsc.org/images/entities/char_2009.gif) :
:![[thin space (1/6-em)]](https://www.rsc.org/images/entities/char_2009.gif) Ce mole ratio of 1.0
Ce mole ratio of 1.0![[thin space (1/6-em)]](https://www.rsc.org/images/entities/char_2009.gif) :
:![[thin space (1/6-em)]](https://www.rsc.org/images/entities/char_2009.gif) 0.5 calcined at 200 °C (473 K) showed the highest affinity for fluoride; it was characterised by powder XRD, TEM, OM, SEM-EDX, XRF for composition, FTIR, TG and DT analyses. The powder XRD pattern (Fig. S1A†) of the CIHFO (Fe
0.5 calcined at 200 °C (473 K) showed the highest affinity for fluoride; it was characterised by powder XRD, TEM, OM, SEM-EDX, XRF for composition, FTIR, TG and DT analyses. The powder XRD pattern (Fig. S1A†) of the CIHFO (Fe![[thin space (1/6-em)]](https://www.rsc.org/images/entities/char_2009.gif) :
:![[thin space (1/6-em)]](https://www.rsc.org/images/entities/char_2009.gif) Ce = 1.0
Ce = 1.0![[thin space (1/6-em)]](https://www.rsc.org/images/entities/char_2009.gif) :
:![[thin space (1/6-em)]](https://www.rsc.org/images/entities/char_2009.gif) 0.5) sample shows the presence of microcrystalline particles and crystallites ∼5 nm in size. Comparison of the 2θ (°) values for the XRD peak positions of the newly synthesized material CIHFO with literature reports18 of Fe2O3 and CeO2 [23.03°, 28.91°, 32.78°, 48.29°, 57.11° for CIHFO; 24.21° (0 1 2), 33.25° (1 0 4), 35.72° (1 1 0), 40.97° (1 1 3), 49.6° (0 2 4), 54.22° (1 1 6), 57.78° (1 2 2/0 1 8), 62.61° (2 1 4), 64.17° (3 0 0), 72.18° (1 1 9), 75.67° (2 2 0) for Fe2O3 and 33.0° (2 0 0), 56.3° (3 1 1), 69.43° (4 0 0), 76.69° (3 3 1), 79.04° (4 2 0) for CeO2] showed that two peaks of CIHFO very closely matched those of CeO2 phase with cubic structures corresponding to (h k l) values of (1 1 1) and (2 2 0), while one peak was common to Ce2O3 phase with a hexagonal structure corresponding to the (h k l) value (2 0 1). However, only one XRD peak of CIHFO was found to be close to α-Fe2O3; this clearly indicates the incorporation of Fe3+ ion into the crystal structure of CeO2. Furthermore, XRF analysis to determine the composition of the sample quantified the presence of 55.082% Fe2O3 and 33.626% CeO2 with some other minor constituents as impurities, namely Al2O3 (0.059%), SiO2 (0.456%), CaO (0.014%), MnO (0.395%), and Cl− (6.97%). The established empirical formula of the hybrid oxide is Fe3.72CeO7.59. Fig. 2A–C shows TEM images at low and high resolution, respectively. Fig. 2A shows the presence of agglomerated particles, and B shows particles 5 nm in size which are microcrystalline in nature. The fingerprint-like appearance in the high resolution TEM image in Fig. 2C indicates the presence of internal crystallinity in the particles. The presence of the associated crystallite particles was also prominently observed in the optical microscopic images (Fig. 2D and E). The SEM images (Fig. 2F and G) show the irregular surface morphology of the material. The SEM-EDX spectrum (Fig. 2H) also supports the presence of higher iron content than cerium, in contrast to a material reported6 by another research group. This is in agreement with our intention when preparing the material. From the analytical data, the empirical formula of the hybrid oxide is established as Fe3.72CeO7.59.
0.5) sample shows the presence of microcrystalline particles and crystallites ∼5 nm in size. Comparison of the 2θ (°) values for the XRD peak positions of the newly synthesized material CIHFO with literature reports18 of Fe2O3 and CeO2 [23.03°, 28.91°, 32.78°, 48.29°, 57.11° for CIHFO; 24.21° (0 1 2), 33.25° (1 0 4), 35.72° (1 1 0), 40.97° (1 1 3), 49.6° (0 2 4), 54.22° (1 1 6), 57.78° (1 2 2/0 1 8), 62.61° (2 1 4), 64.17° (3 0 0), 72.18° (1 1 9), 75.67° (2 2 0) for Fe2O3 and 33.0° (2 0 0), 56.3° (3 1 1), 69.43° (4 0 0), 76.69° (3 3 1), 79.04° (4 2 0) for CeO2] showed that two peaks of CIHFO very closely matched those of CeO2 phase with cubic structures corresponding to (h k l) values of (1 1 1) and (2 2 0), while one peak was common to Ce2O3 phase with a hexagonal structure corresponding to the (h k l) value (2 0 1). However, only one XRD peak of CIHFO was found to be close to α-Fe2O3; this clearly indicates the incorporation of Fe3+ ion into the crystal structure of CeO2. Furthermore, XRF analysis to determine the composition of the sample quantified the presence of 55.082% Fe2O3 and 33.626% CeO2 with some other minor constituents as impurities, namely Al2O3 (0.059%), SiO2 (0.456%), CaO (0.014%), MnO (0.395%), and Cl− (6.97%). The established empirical formula of the hybrid oxide is Fe3.72CeO7.59. Fig. 2A–C shows TEM images at low and high resolution, respectively. Fig. 2A shows the presence of agglomerated particles, and B shows particles 5 nm in size which are microcrystalline in nature. The fingerprint-like appearance in the high resolution TEM image in Fig. 2C indicates the presence of internal crystallinity in the particles. The presence of the associated crystallite particles was also prominently observed in the optical microscopic images (Fig. 2D and E). The SEM images (Fig. 2F and G) show the irregular surface morphology of the material. The SEM-EDX spectrum (Fig. 2H) also supports the presence of higher iron content than cerium, in contrast to a material reported6 by another research group. This is in agreement with our intention when preparing the material. From the analytical data, the empirical formula of the hybrid oxide is established as Fe3.72CeO7.59.
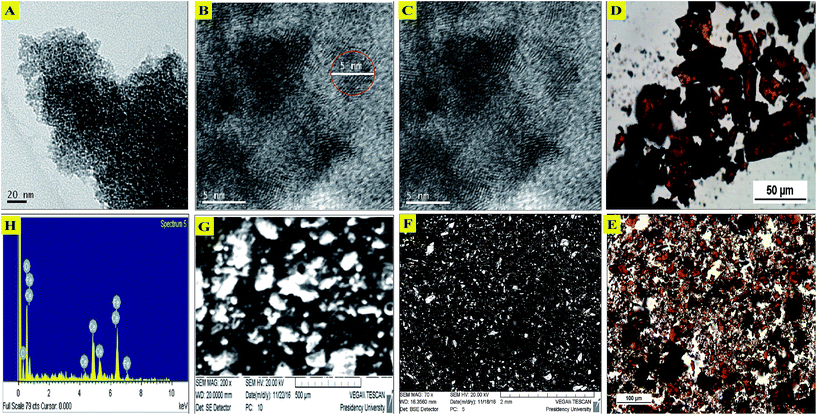 | ||
| Fig. 2 Transmission electron microscopy images of CIHFO at different magnifications: (A) 20 nm, (B) 5 nm, and (C) 5 nm showing fingerprint-like impressions of internal crystallinity. Optical microscopy images of the material at (D) high resolution (50 μm scale) and (E) low resolution (100 μm scale). Scanning electron microscopy images of the material at (F) high magnification and (G) low magnification. (H) EDX spectra (a larger image is provided in the ESI (Fig. S5†) for clarity). | ||
The FTIR spectra of iron(III) oxide, cerium(IV) oxide and composition-optimised CIHFO are compared in Fig. 3A. It can be seen that the stretching and bending modes of the vibrations for O–H bonds are indicated by the bands at wave numbers of (ν) 3000 to 3500 cm−1 and ∼1630 cm−1, respectively.10,13 In addition, the bands recorded in the spectra at ν = 1300 to 1400 cm−1 are the stretching modes of M–O bonds and those around 750 cm−1 are the bending modes of M–O bonds.31 The FTIR spectrum for HFO (black) showed bands for Fe–O at ν = 1318 cm−1 and for HCO at ν = 1396 cm−1, while that for CIHFO (red) showed multiple band structures at ν = 1318 and 1396 cm−1; this confirms the presence of Fe–O–Ce bonds in the material. The TG spectrum of CIHFO (Fig. 3B) recorded a maximum weight loss at around 230 °C, and the percentage of this loss is about 25. This result is different from that of Yang et al.21 The weight loss was also confirmed from a sharp exothermic band in the DT spectrum (Fig. 3B). This result is presumably owing to the elimination of physically attached water molecules, including surface-adhered hydrogen bonded and lattice water molecules.
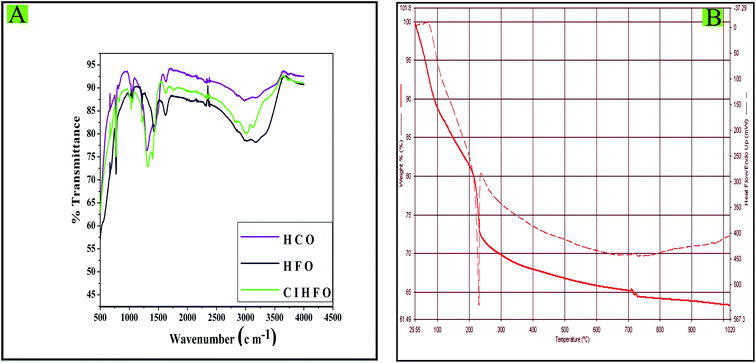 | ||
| Fig. 3 (A) Fourier transform infrared spectra of HCO, HFO and CIHFO; (B) TGA and DTA spectra of CIHFO. | ||
Fig. 4 shows AFM images in 3D (image-A) and 2D (image-B), including the height histogram along the z-axis (C), the extracted profile (D), and the length measurement (E). It can be seen that the material has a regular surface morphology with high porosity, a pore volume of 21.4 Å and a pore size distribution with a surface area of 140.711 m2 g−1. Fig. S2† shows the plot of P/P0 versus 1/[W(P0/P) − 1]; this plot shows a linear change, possibly due to the high porosity of the material.
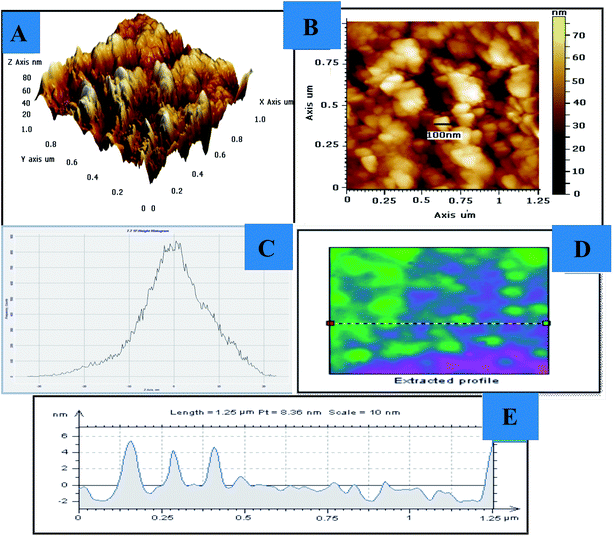 | ||
| Fig. 4 Atomic force microscopy images of CIHFO: (A) 3-D view, (B) 2-D view, (C) height histrogram along the Z-axis, and (D) extracted profile, (E) length measurement. | ||
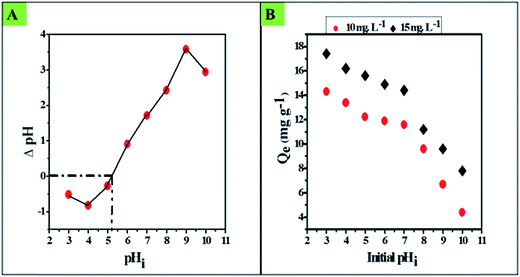
The plot of ΔpH versus pHi is shown in Fig. 5A; this plot optimizes the zero point surface charge pH (pHzpc)32 of the material, where a transition of the surface charge occurs from positive to negative via the electrically neutral surface at pH 5.2.
3.3. Effect of pH
Fluoride adsorption over an oxide surface is initially influenced by the pH of the solution (pHi) and the pHzpc of the material. In general, anion adsorption is believed to be associated with exchange of hydroxyl ions (OH−) or coulombic forces; hence, adsorption of fluoride over the surface of CIHFO occurs preferentially at a lower pH range. The influence of pHi upon the fluoride adsorption process over the CIHFO surface is shown in Fig. 5B. It can be seen from the results that the fluoride adsorption capacity (Qe, mg g−1) decreased with increasing pHi from 3.0 to 5.0 and remained almost the same up to pHi 7.0. The Qe value (mg g−1) declined sharply with increasing pHi from >7.0 to 10.0. A similar pH effect with a defluoridation process was also reported by Biswas et al.4 This indicates that the as-prepared material could be profitably used as a fluoride scavenger from water in the pHi range from 5.0 to 7.0.Fluoride adsorption over the prepared material (CIHFO) can be stipulated by a two-step ligand/anion exchange reaction, (R1).
| M–OH2+ + F− → M–F + H2O | (R1) |
At strongly acidic pH (pHi = 3), the high value of Qe is due to the electrostatic/columbic attraction forces of fluoride to the positively charged surface of the material. The decrease in Qe with increasing pHi from 3.0 to 5.0 is due to the fluctuation of the positive charge density of the solid surface. When pH = pHZPC (5.2 ± 0.2), the solid oxide surfaces are electrically neutral; this is attributed to the equal distribution of positive and negative charges. Fluoride adsorption in these conditions can be simply explained by reaction (R2).
| M–OH + F− → M–F + OH− | (R2) |
When pHi > pHZPC (5.2 ± 0.2), the CIHFO surface becomes negative and imparts coulombic repulsion to the fluoride ions. Hence, the value of Qe (mg g−1) started to decline at pHi >7.0; this can be demonstrated by (R3). This situation is in good agreement with the observed noticeable decrease of the equilibrium solution pH.
| M–OH + F− + OH− → M–O− + F− + OH2 | (R3) |
Hence, in a lower pH range, especially below pHPZC, the dominating positive charge over the solid surface triggers quick adsorption of the fluoride ions from the solution onto the solid surface due to columbic forces; this elucidates the increase in the adsorption capacity. It is obvious that CIHFO may be an efficient scavenger of fluoride; this is in good agreement with results of other researchers,4 who also observed enhanced adsorption of fluoride with decreasing pH.
3.4. Effect of CIHFO dose
To determine the effects of the adsorbent dose on fluoride removal, the adsorbent dose was varied from 0.05 to 2.0 g per 50 mL fluoride solution with Ci = 10.0, 15.0 or 20.0 mg L−1, respectively, for the adsorption reaction at 30 °C (303 K) and at pHi ∼7.0. It was noticed that the fluoride removal capacity (Qe, mg g−1) decreased for a given Ci value with increasing adsorbent dose (Fig. 6). This phenomenon can be elucidated by the surface site heterogeneity model. As per this model, surface sites are composed of a series of spectra of binding energies. When the dose is applied in minute quantity, the availability of exposed surface sites increases the adsorption capacity (Qe) value. This condition reversed as the adsorbent dose was increased, which is similar to other studies.4,15,23,25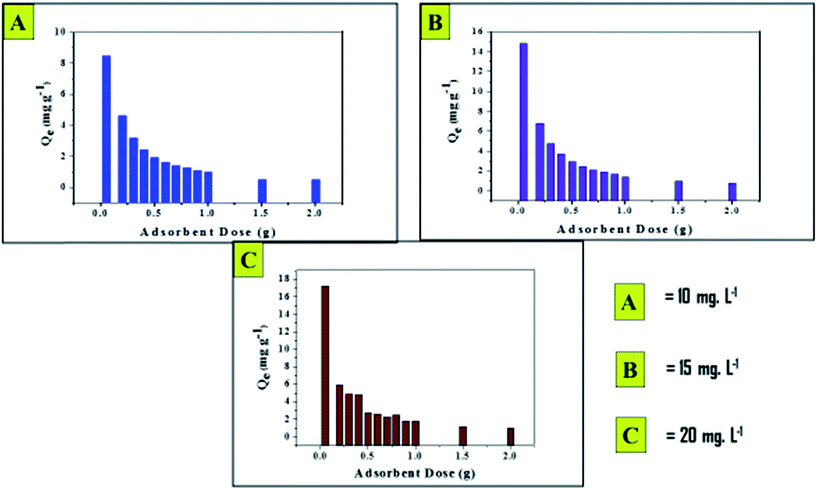 | ||
| Fig. 6 Effects of adsorbent dose on fluoride removal at three different concentrations at pH 7.0 (±2) and a temperature of 303 K (±2 °C) with a contact time of 120 min. | ||
3.5. Kinetic modelling
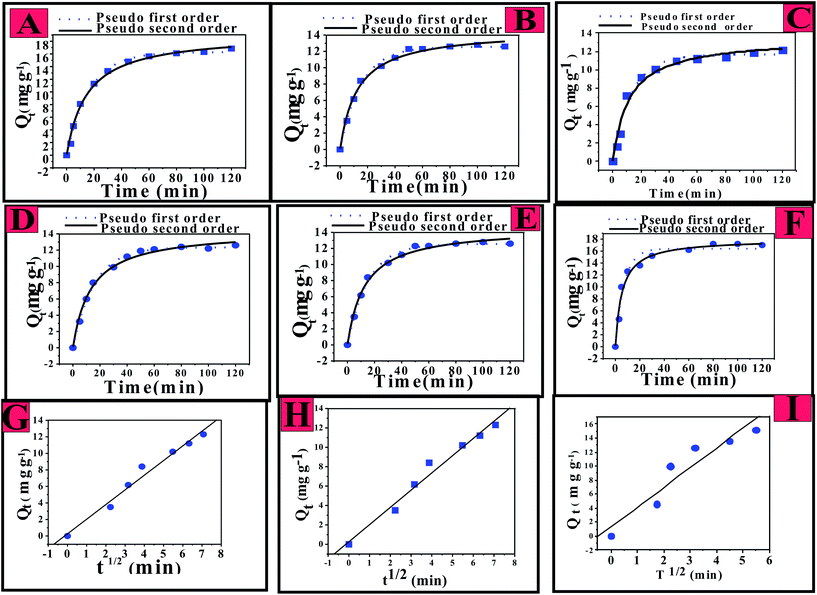
The time-dependent adsorption capacity values, Qt (mg g−1), with increasing reaction time are presented in Fig. 7A–F. Here, A to C represent the Qt data, respectively, for the adsorption of fluoride by CIHFO at reaction temperatures of 20 °C (293), 30 °C (303) and 40 °C (313 K); (D) to (F) represent the Qt data obtained for fluoride solutions with Ci = 10.0, 15.0 and 20.0 mg L−1 at 303 K and pH ∼7.0. Inspection of the data revealed that more than 80% of the loaded fluoride transferred to the material surface from the solution in t = 0 to 40 minutes; the remaining 15% to 20% of the fluoride in solution required more time to transfer onto the solid surface. This later slow solute transfer may be due to coulombic and physical hindrance from the fluoride already transferred to the solid surface from the solution as well as decreases of the available solute concentration and the adsorption sites of the adsorbent.15,23,25The kinetic data shown in Fig. 7 were analysed by the commonly used pseudo-first order (eqn (2)), pseudo-second order (eqn (3)), and intra-particle diffusion (eqn (4)) model equations;4,6,33 these well-known theoretical concepts are generally applied to understand the mechanism of fluoride adsorption on an adsorbent.
| Qt = Qe[1 − e−k1t] | (2) |
| Qt = t × k2 × Qe2/[1 + (t × k2 × Qe)] | (3) |
| Qt = Kidt0.5 + C | (4) |
| Kinetics equation | Parameters | Fluoride concentration (mg L−1) | Temperature (K) | ||||
|---|---|---|---|---|---|---|---|
| 10 | 15 | 20 | 293 | 303 | 313 | ||
| Pseudo-second order | k2 (g mg−1 min−1) | 0.005 | 0.007 | 0.010 | 0.003 | 0.005 | 0.006 |
| qe (mg g−1) | 14.40 | 16.37 | 17.98 | 19.20 | 14.61 | 13.48 | |
| R2 | 0.99 | 0.99 | 0.97 | 0.99 | 0.99 | 0.97 | |
| χ2 | 0.17 | 0.31 | 0.82 | 0.32 | 0.17 | 0.47 | |
| Pseudo-first order | k1 (min−1) | 0.06 | 0.10 | 0.14 | 0.05 | 0.06 | 0.07 |
| qe (mg g−1) | 12.34 | 14.70 | 16.3 | 16.28 | 12.56 | 11.63 | |
| R2 | 0.99 | 0.99 | 0.96 | 0.99 | 0.99 | 0.986 | |
| χ2 | 0.08 | 0.27 | 1.24 | 0.23 | 0.11 | 0.30 | |
| Intra-particle diffusion | Kid (g mg−1 min0.5) | 1.77 | 2.54 | 2.82 | 2.44 | 1.77 | 1.84 |
| R2 | 0.96 | 0.94 | 0.88 | 0.96 | 0.96 | 0.92 | |
An increase of the rate of a reaction with temperature is associated with the availability of more fractions of adsorbent species with the threshold energy required for effective molecular collision.34 It was observed that the value of Qt decreased with increasing reaction temperature. The decrease of the value of Qt with increasing temperature indicates the exothermic nature of the adsorption reaction. In the case of increasing Ci, the rate change showed a similar result; however, the value of Qt decreased with decreasing value of Ci. This is presumably due to the increased availability of solute loading sites per unit of the active sites.
As per the intra-particle diffusion model, the plot of Qt against t0.5 (Weber–Morris plot)33 should be a straight line with a non-zero intercept value or a combination of two or three straight lines including the origin as a point. However, the present Qt data acquired under our experimental conditions and at the investigated Ci of fluoride when plotted against t0.5 demonstrated a straight line with a good R2 value (Fig. 7G–I), indicating that fluoride adsorption over CIHFO occurred via a boundary layer (film) diffusion process.33 The boundary layer (film) diffusion process was also indicated when the temperature-dependent Qt data were plotted against t0.5 (see ESI, Fig. S3†).
3.6. Equilibrium analysis
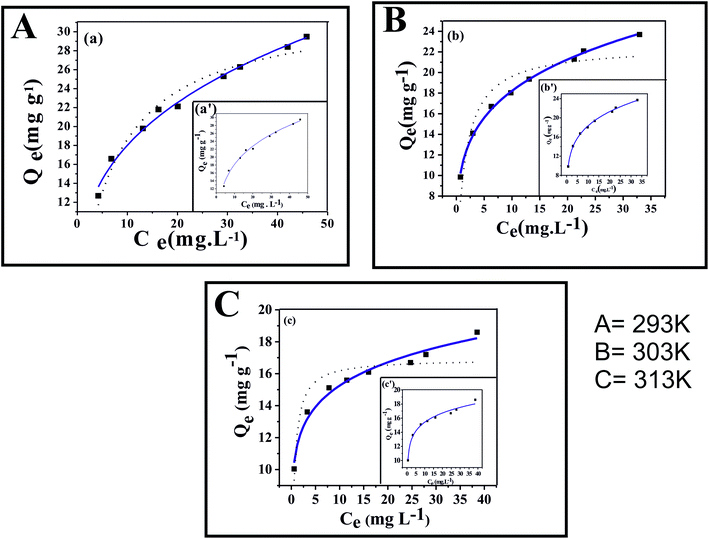
To determine the adsorption efficacy of a newly developed adsorbent, adsorption isotherms are basic requirements for the commercialisation of the adsorption system. Langmuir and Freundlich are two fundamental isotherm models that can conveniently depict the surface properties and adsorption mechanism of such a system. Fig. 8A–C presents the equilibrium data for the adsorption of fluoride on CIHFO at pH ∼7.0 and at temperatures of 293 (±2) K, 303 (±2) K, and 313 (±2) K, respectively. We examined the adherence of the equilibrium data to the most widely accepted isotherm models, namely Langmuir35 (bold line) (eqn (5)), Freundlich36 (dotted line) (eqn (6)) and Redlich–Peterson37 (inset) (eqn (7)) (Fig. 8A–C). The Langmuir model assumes that each molecule retains the same adsorption energy, there is no interaction between the molecules and all sites have equal affinities towards the adsorbate; hence, this isotherm denotes homogeneous adsorption. The Freundlich model is associated with non-ideal multilayer adsorption and heterogeneity of the adsorption sites. The non-linear expressions of the Langmuir, Freundlich and Redlich–Peterson eqn (5)–(7) can be set as| Qe = qm × KL × Ce (1 + KL × Ce) | (5) |
| Qe = KF × Ce1/n | (6) |
| Qe = αCe/1 + βCeg | (7) |
The isotherm parameters generated from the plots of the equilibrium data on the origin using spreadsheet software are presented in Table 2. From the values of the regression coefficient (R2) and the statistical error chi-square (χ2) of non-linear analysis, it can be seen that the equilibrium data fit much better with the Freundlich model than with the Langmuir model. For further confirmation of the better Freundlich fit, the equilibrium data was also analysed with the Redlich–Peterson isotherm model (inset, Fig. 8); the as-estimated model parameters are also given in Table 2. Here, the value of g was found to be somewhat away from unity, confirming the greater conformity of the equilibrium data with the Freundlich isotherm.37
| Isotherm model | Parameters | Temperature | ||
|---|---|---|---|---|
| 293 K | 303 K | 313 K | ||
| Langmuir | θ (mg g−1) | 32.62 | 22.55 | 16.91 |
| K (L mg−1) | 0.13 | 0.66 | 2.18 | |
| χ2 | 1.29 | 2.88 | 1.20 | |
| R2 | 0.96 | 0.88 | 0.84 | |
| Freundlich | n | 3.10 | 4.47 | 7.57 |
| KF (mg g−1) | 8.58 | 10.88 | 11.25 | |
| R2 | 0.99 | 0.99 | 0.98 | |
| χ2 | 0.31 | 0.05 | 0.15 | |
| Redlich–Peterson | α | 16.25 | 156.29 | 170.47 |
| β | 1.44 | 13.5 | 14.16 | |
| g | 0.74 | 0.79 | 0.88 | |
| R2 | 0.99 | 0.99 | 0.98 | |
| χ2 | 0.28 | 0.03 | 0.13 | |
| Dubinin–Radushkevich | Qm (mol kg−1) | 3.05 | 2.07 | 1.29 |
| β (mol2 kJ−2) × 103 | 3.14 | 2.08 | 1.21 | |
| EDR (kJ mol−1) | 12.61 | 15.50 | 20.32 | |
| R2 | 0.60 | 0.96 | 0.98 | |
The evaluated degree of the Freundlich coefficient (1/n) falls between 0 and 1, as the values of n obtained are 3.10, 4.47 and 7.57, respectively for the temperatures (293 K, 303 K and 313 K) applied in the equilibrium reactions. Again, the high value of n validated that the fluoride uptake by CIHFO followed the Freundlich isotherm more than the Langmuir isotherm.13 Thus, it can be said that the adsorption sites of this mixed metal oxide are heterogeneous, and the multilayer adsorption mechanism is suitable for the fluoride adsorption.
The Dubinin–Radushkevich (D–R) equation (eqn (8))38,39 was used to evaluate the free energy of the reaction; it can be obtained from the equilibrium isotherm data to predict whether the nature of adsorption is physical, ion-exchange or chemical.
ln![[thin space (1/6-em)]](https://www.rsc.org/images/entities/char_2009.gif) Qe = ln Qe = ln![[thin space (1/6-em)]](https://www.rsc.org/images/entities/char_2009.gif) Qm − βε2 Qm − βε2
| (8) |
ε is the Polanyi potential, which can be extracted from eqn (9) below:
ε = RT![[thin space (1/6-em)]](https://www.rsc.org/images/entities/char_2009.gif) ln(1 + 1/Ce) ln(1 + 1/Ce)
| (9) |
| EDR = 1/(2β)1/2 | (10) |
It can be seen that the values of Qm decreased with increasing temperature, which supports the previous results obtained from equilibrium modelling. From the D–R equation and according to the value of EDR, an adsorption process may be one of three types:38–40 (i) physisorption if EDR = 8.0 kJ mol−1, (ii) ion-exchange if EDR = 8.0 to 16.0 kJ mol−1 and (iii) chemisorption if EDR > 16.0 kJ mol−1. The gradual increase of the EDR value with increasing temperature from 12.61 to 20.32 kJ mol−1 indicates that the adsorption of fluoride proceeds from ion-exchange to chemisorption. At 303 K, the EDR obtained in the present case is 15.50 kJ mol−1, which is indicated to be at the borderline of the ion-exchange and chemisorption processes.8,38
3.7. Thermodynamic parameters
Changes in thermodynamic parameters such as standard free energy (ΔG0), standard enthalpy (ΔH0) and standard entropy (ΔS0) for this adsorption process were estimated using the following thermodynamic relations (eqn (11) and (12)),40 assuming the activity coefficient to be unity at low solute concentrations.| ΔG0 = ΔH0 − TΔS0 | (11) |
ΔG0 = −2.303RT![[thin space (1/6-em)]](https://www.rsc.org/images/entities/char_2009.gif) log log![[thin space (1/6-em)]](https://www.rsc.org/images/entities/char_2009.gif) Kc Kc
| (12) |
From eqn (11) and (12), eqn (13) can be derived:
log![[thin space (1/6-em)]](https://www.rsc.org/images/entities/char_2009.gif) Kc = ΔS0/2.303R − (ΔH0/2.303R)1/T Kc = ΔS0/2.303R − (ΔH0/2.303R)1/T
| (13) |
Every term in the context represented herewith has its usual significance. Eqn (14) is adapted from eqn (13) with a slight alteration, where the thermodynamic equilibrium constant Kc is substituted by qe/Ce:
| log(qe/Ce) = ΔS0/2.303R − (ΔH0/2.303R)1/T | (14) |
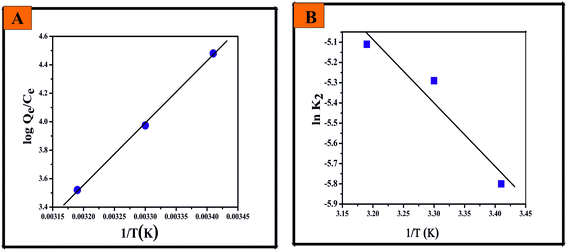 | ||
Fig. 9 The plots of (A) log![[thin space (1/6-em)]](https://www.rsc.org/images/entities/char_2009.gif) Qe/Ce versus 1/T (K) for the thermodynamic parameters and (B) ln Qe/Ce versus 1/T (K) for the thermodynamic parameters and (B) ln![[thin space (1/6-em)]](https://www.rsc.org/images/entities/char_2009.gif) k2 versus 1/T (K) for the activation energy of the fluoride adsorption reaction with CIHFO. k2 versus 1/T (K) for the activation energy of the fluoride adsorption reaction with CIHFO. | ||
| Fluoride concentration (mg L−1) | ΔH0 (kJ mol−1) | ΔS0 (J mol−1 K−1) | ΔG0 (kJ mol−1) at different temperatures (K) | ||
|---|---|---|---|---|---|
| 293 | 303 | 313 | |||
| 25 | −25.924 | −47.411 | −11.941 | −11.698 | −10.971 |
| 35 | −36.279 | −86.537 | −10.913 | −10.011 | −9.160 |
3.8. Activation energy
The Arrhenius equation is applicable to evaluate the activation energy of any kind of reaction and can be expressed as eqn (15):
k2 = A![[thin space (1/6-em)]](https://www.rsc.org/images/entities/char_2009.gif) exp(−Ea/RT) exp(−Ea/RT)
| (15) |
The logarithm of eqn (15) illustrates a linear relationship of the Arrhenius equation and can be drawn as below eqn (16):
ln![[thin space (1/6-em)]](https://www.rsc.org/images/entities/char_2009.gif) k2 = ln k2 = ln![[thin space (1/6-em)]](https://www.rsc.org/images/entities/char_2009.gif) A + (−Ea/R)1/T A + (−Ea/R)1/T
| (16) |
The plot of ln![[thin space (1/6-em)]](https://www.rsc.org/images/entities/char_2009.gif) k2 against 1/T generates a straight line (Fig. 9B); the values of Ea and A were calculated from the slope and intercept of the plot and were found to be Ea = 0.026 kJ mol−1 and A = 4.95 g mg−1 min−1. The significantly low value of the activation energy supports the high fluoride affinity of CIHFO and the feasibility of the reaction.8,41
k2 against 1/T generates a straight line (Fig. 9B); the values of Ea and A were calculated from the slope and intercept of the plot and were found to be Ea = 0.026 kJ mol−1 and A = 4.95 g mg−1 min−1. The significantly low value of the activation energy supports the high fluoride affinity of CIHFO and the feasibility of the reaction.8,41
3.9. Effects of co-occurring ions on fluoride adsorption
Among commonly occurring groundwater anions, sulphate showed adverse effects on fluoride adsorption by CIHFO. The results of the adverse influence of sulphate on fluoride adsorption from the solution of Ci = 10.0 mg L−1 are shown in Fig. 10A. It can be seen that as the sulphate concentration increased from 10.0 to 150 mg L−1, the fluoride adsorption amount (9.5 mg g−1) decreased to 3.3 mg g−1, which is only ∼30% of the initial value. However, the fluoride adsorption amount (9.5 mg g−1) was similar in the presence of other anions, such as phosphate, bicarbonate, nitrate and chloride. The sequence of the adverse influence of the tested ions on fluoride adsorption over CIHFO can be given as SO42−, HCO3− > HPO42− > NO3− > Cl−. Some other studies12,20 support this interference trend; however, different interference trends have also been reported.6,8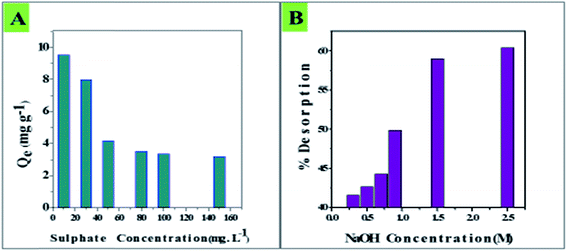 | ||
| Fig. 10 Effects of (A) sulphate interference on fluoride adsorption by CIHFO and (B) molar concentration of NaOH on the desorption of fluoride from the CIHFO surface. | ||
4. Desorption
From Fig. 10B, it is clear that with increasing basicity, the desorption percentage increased; a maximum of 61% desorption occurred. A similar increasing trend of desorption percentage with increasing molar strength of base was reported by other researchers.8,11 The process is predicted to be borderline chemisorption and is exothermic in nature; therefore, it is obvious that the product is more stable than the reactant. Also, as the desorption tendency is moderate, the tendency of fluoride to leach into the environment also decreases. The fluoride-desorbed material was found to be recyclable up to a maximum of three cycles, with a drastic decrease of the fluoride absorption efficiency thereafter.5. Fluoride removal from a natural water sample
Groundwater was collected from a hand pump-attached tube-well in Kharai village (Kashipur block) of Purulia district, West Bengal; the physico-chemical parameters of the groundwater were analysed, including pH (7.36), iron (total) (0.87 mg L−1), fluoride (9.05 mg L−1), calcium (8.05 mg L−1), magnesium (1.99 mg L−1), hardness (9.99 mg L−1), TDS (1140 mg L−1), salinity (517 mg L−1), conductivity (364 μS) and turbidity (008 NTU). 500 mL of this water sample was stirred magnetically (500 rpm) for 2 hours with increasing CIHFO dosages from 0.1 g to 1.5 g. Immediately after the experiments, the samples were filtered and the fluoride levels were analyzed. It appeared that the fluoride level was reduced from 9.05 mg L−1 to below 1.0 mg L−1 when the dosage of CIHFO employed was 1.20 g; this is well below the WHO recommended guideline maximum concentration level. Thus, the experimentally approved CIHFO dosage is 2.40 g L−1 for the treatment of fluoride-rich (concentration: 9.05 mg L−1) groundwater to reduce the fluoride level below 1.0 mg L−1.6. Mechanism of fluoride adsorption over CIHFO
Based on the measured pHzpc of CIHFO and the pH effect on fluoride adsorption, it can be stated that under acidic pH conditions, more fluoride ions are adsorbed on the adsorbent surface due to electrostatic attractions between the negatively charged adsorbate and the positively charged adsorbent surface. As the energy of activation is low, the fluoride should be distributed very rapidly over the CIHFO surface using the minimum energy which is available from the mechanical agitation of the reaction mixture. The EDR values (12.61, 15.50 and 20.32 kJ mol−1, respectively, at 293, 303 and 313 K) estimated from modelling the equilibrium data with the D–R isotherm predict that the adsorption process is ion-exchange to borderline chemisorption. The obtained experimental results indicate that during the adsorption process, the univalent surface hydroxyl ions are exchanged by fluoride ions, leading to the formation of a stable complex with a potential energy lower than that of the reactants (Fig. 11A). The large negative value of ΔH0 and the lower tendency of fluoride desorption support this observation. Moreover, the FTIR spectrum of adsorbed CIHFO when compared with that of CHIFO (Fig. 11B) shows a significant reduction of the O–H stretching and bending band intensities, and the near disappearance13 of the bands at 1400 cm−1 and 750 cm−1 validates the proposed mechanism.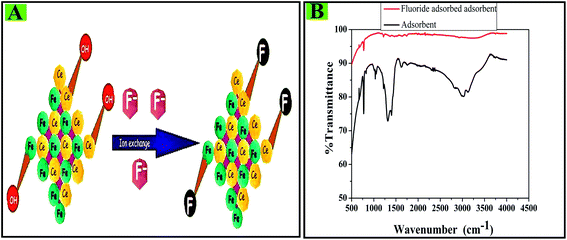 | ||
| Fig. 11 (A) Schematic of the fluoride adsorption mechanism on the CIHFO surface. (B) Fourier transform infrared spectral data of the pure adsorbent and the fluoride-adsorbed adsorbent. | ||
7. Conclusion
Surface-tuned iron(III) oxide with cerium(IV) oxide (CIHFO) is a highly porous, microcrystalline and amorphous material with a high surface area relative to that of iron(III) oxide. Microscopic images confirmed the presence of microcrystalline particles not only with nanodimensions but also with irregular surface morphologies. Exploration of this thermally stable material (473 K) for fluoride adsorption shows that the surface reaction occurs according to pseudo-first as well as pseudo-second order kinetics with a boundary layer (film) diffusion process. The very low Arrhenius energy of activation indicates the high affinity of CIHFO for fluoride. The better adherence of the equilibrium data to the Freundlich isotherm suggests the surface heterogeneity of the CIHFO multilayer adsorption phenomenon. The effects of tested ions on the fluoride adsorption reaction show no notable adverse influence, with the exception of sulphate. The FTIR analysis and other experimental results suggested that fluoride adsorption occurs through an ion-exchange mechanism which ultimately changes to chemisorption. Encouraging results were obtained when CIHFO was employed for high fluoride (9.05 mg L−1) groundwater treatment for field validation.Acknowledgements
The authors are grateful to the Head, Department of Chemistry and also to the Department of Geology, including the Authority of the Presidency University, Kolkata, India, for providing laboratory facilities for conducting this work. The authors are thankful to Mr Arijit Halder, SRF, Department of Chemistry, Jadavpur University, Kolkata, for BET analysis. We are thankful to an anonymous reviewer who provided valuable time and comments to help us revise our manuscript into very good shape. The author (K. M.) is grateful to the Department of Science and Technology (DST), Govt. of India for providing her with financial support.References
- D. Fagin, Second thoughts about fluoride, Sci. Am., 2008 Jan 1, 298(1), 74–81 Search PubMed.
- S. Water, Guidelines for drinking-water quality [electronic resource]: incorporating first addendum, World Health Organization, 3rd edn, 2006, vol. 1, Recommendations Search PubMed.
- S. Ayoob and A. K. Gupta, Fluoride in drinking water: a review on the status and stress effects, Crit. Rev. Environ. Sci. Technol., 2006 Dec 1, 36(6), 433–487 Search PubMed.
- K. Biswas, K. Gupta and U. C. Ghosh, Adsorption of fluoride by hydrous iron(III)–tin(IV) bimetal mixed oxide from the aqueous solutions, Chem. Eng. J., 2009 Jul 1, 149(1), 196–206 Search PubMed.
- S. Dey, S. Goswami and U. C. Ghosh, Hydrous ferric oxide (HFO)—a scavenger for fluoride from contaminated water, Water, Air, Soil Pollut., 2004 Oct 1, 158(1), 311–323 Search PubMed.
- D. Tang and G. Zhang, Efficient removal of fluoride by hierarchical Ce–Fe bimetal oxides adsorbent: thermodynamics, kinetics and mechanism, Chem. Eng. J., 2016 Jan 1, 283, 721–729 Search PubMed.
- S. Deng, H. Liu, W. Zhou, J. Huang and G. Yu, Mn–Ce oxide as a high-capacity adsorbent for fluoride removal from water, J. Hazard. Mater., 2011 Feb 28, 186(2), 1360–1366 Search PubMed.
- A. Ghosh, S. Chakrabarti, K. Biswas and U. C. Ghosh, Agglomerated nanoparticles of hydrous Ce(IV) + Zr(IV) mixed oxide: Preparation, characterization and physicochemical aspects on fluoride adsorption, Appl. Surf. Sci., 2014 Jul 15, 307, 665–676 Search PubMed.
- L. Chen, K. Zhang, J. He, X. G. Cai, W. Xu and J. H. Liu, Performance and mechanism of hierarchically porous Ce–Zr oxide nanospheres encapsulated calcium alginate beads for fluoride removal from water, RSC Adv., 2016, 6(43), 36296–36306 RSC.
- H. Liu, S. Deng, Z. Li, G. Yu and J. Huang, Preparation of Al–Ce hybrid adsorbent and its application for defluoridation of drinking water, J. Hazard. Mater., 2010 Jul 15, 179(1), 424–430 Search PubMed.
- J. Zhu, X. Lin, P. Wu, Q. Zhou and X. Luo, Fluoride removal from aqueous solution by Al(III)–Zr(IV) binary oxide adsorbent, Appl. Surf. Sci., 2015 Dec 1, 357, 91–100 Search PubMed.
- P. Chen, W. Zhang, M. Li, P. Ai, L. Tian and H. Jiang, Facile synthesis of magnetic La–Zr composite as high effective adsorbent for fluoride removal, RSC Adv., 2016, 6(42), 35859–35867 RSC.
- V. Tomar, S. Prasad and D. Kumar, Adsorptive removal of fluoride from water samples using Zr–Mn composite material, Microchem. J., 2013 Jul 31, 111, 116–124 Search PubMed.
- M. Barathi, A. S. Kumar and N. Rajesh, Efficacy of novel Al–Zr impregnated cellulose adsorbent prepared using microwave irradiation for the facile defluoridation of water, J. Environ. Chem. Eng., 2013 Dec 31, 1(4), 1325–1335 Search PubMed.
- Z. Qiusheng, L. Xiaoyan, Q. Jin, W. Jing and L. Xuegang, Porous zirconium alginate beads adsorbent for fluoride adsorption from aqueous solutions, RSC Adv., 2015, 5(3), 2100–2112 RSC.
- L. Chen, B. Y. He, S. He, T. J. Wang, C. L. Su and Y. Jin, Fe–Ti oxide nano-adsorbent synthesized by co-precipitation for fluoride removal from drinking water and its adsorption mechanism, Powder Technol., 2012 Sep 30, 227, 3–8 Search PubMed.
- K. Biswas, S. K. Saha and U. C. Ghosh, Adsorption of fluoride from aqueous solution by a synthetic iron(III)–aluminum(III) mixed oxide, Ind. Eng. Chem. Res., 2007 Aug 1, 46(16), 5346–5356 Search PubMed.
- T. Basu and U. C. Ghosh, Nano-structured iron(III)–cerium(IV) mixed oxide: Synthesis, characterization and arsenic sorption kinetics in the presence of co-existing ions aiming to apply for high arsenic groundwater treatment, Appl. Surf. Sci., 2013 Oct 15, 283, 471–481 Search PubMed.
- L. Chai, Y. Wang, N. Zhao, W. Yang and X. You, Sulfate-doped Fe3O4/Al2O3 nanoparticles as a novel adsorbent for fluoride removal from drinking water, Water Res., 2013 Aug 1, 47(12), 4040–4049 Search PubMed.
- M. Mohapatra, D. Hariprasad, L. Mohapatra, S. Anand and B. K. Mishra, Mg-doped nanoferrihydrite—A new adsorbent for fluoride removal from aqueous solutions, Appl. Surf. Sci., 2012 Mar 1, 258(10), 4228–4236 Search PubMed.
- W. Yang, X. Dou, Y. Li, D. Mohan, C. U. Pittman and Y. S. Ok, Performance and mass transfer of aqueous fluoride removal by a magnetic alumina aerogel, RSC Adv., 2016, 6(114), 112988–112999 RSC , used for TG-DTA.
- S. P. Suriyaraj and R. Selvakumar, Advances in nanomaterial based approaches for enhanced fluoride and nitrate removal from contaminated water, RSC Adv., 2016, 6(13), 10565–10583 RSC.
- A. Mohseni-Bandpi, B. Kakavandi, R. R. Kalantary, A. Azari and A. Keramati, Development of a novel magnetite–chitosan composite for the removal of fluoride from drinking water: adsorption modeling and optimization, RSC Adv., 2015, 5(89), 73279–73289 RSC.
- K. Pandi and N. Viswanathan, A novel metal coordination enabled in carboxylatedalginic acid for effective fluoride removal, Carbohydr. Polym., 2015 Mar 15, 118, 242–249 Search PubMed.
- T. Wu, L. Mao and H. Wang, Adsorption of fluoride on Mg/Fe layered double hydroxides material prepared via hydrothermal process, RSC Adv., 2015, 5(30), 23246–23254 RSC.
- H. M. Cai, G. J. Chen, C. Y. Peng, Z. Z. Zhang, Y. Y. Dong, G. Z. Shang, X. H. Zhu, H. J. Gao and X. C. Wan, Removal of fluoride from drinking water using tea waste loaded with Al/Fe oxides: A novel, safe and efficient biosorbent, Appl. Surf. Sci., 2015 Feb 15, 328, 34–44 Search PubMed.
- X. Wu, Y. Zhang, X. Dou and M. Yang, Fluoride removal performance of a novel Fe–Al–Cetrimetal oxide adsorbent, Chemosphere, 2007 Nov 30, 69(11), 1758–1764 Search PubMed.
- K. Biswas, K. Gupta, A. Goswami and U. C. Ghosh, Fluoride removal efficiency from aqueous solution by synthetic iron(III)–aluminum(III)–chromium(III) ternary mixed oxide, Desalination, 2010 May 31, 255(1), 44–51 Search PubMed.
- K. Biswas, D. Bandhoyapadhyay and U. C. Ghosh, Adsorption kinetics of fluoride on iron(III)–zirconium(IV) hybrid oxide, Adsorption, 2007 Feb 1, 13(1), 83–94 Search PubMed.
- S. K. Swain, T. Patnaik, P. C. Patnaik, U. Jha and R. K. Dey, Development of new alginate entrapped Fe(III)–Zr(IV) binary mixed oxide for removal of fluoride from water bodies, Chem. Eng. J., 2013 Jan 15, 215, 763–771 Search PubMed.
- M. G. Sujana and S. Anand, Iron and aluminium based mixed hydroxides: a novel sorbent for fluoride removal from aqueous solutions, Appl. Surf. Sci., 2010 Sep 15, 256(23), 6956–6962 Search PubMed.
- B. M. Babić, S. K. Milonjić, M. J. Polovina and B. V. Kaludierović, Point of zero charge and intrinsic equilibrium constants of activated carbon cloth, Carbon, 1999 Feb 22, 37(3), 477–481 Search PubMed.
- W. J. Weber and J. C. Morris, Kinetics of adsorption on carbon from solution, Journal of the Sanitary Engineering Division, 1963 Mar, 89(2), 31–60 Search PubMed.
- I. Saha, A. Ghosh, D. Nandi, K. Gupta, D. Chatterjee and U. C. Ghosh, β-Cyclodextrin modified hydrous zirconium oxide: synthesis, characterization and defluoridation performance from aqueous solution, Chem. Eng. J., 2015 Mar 1, 263, 220–230 Search PubMed.
- I. Langmuir, The constitution and fundamental properties of solids and liquids. Part I. Solids, J. Am. Chem. Soc., 1916 Nov, 38(11), 2221–2295 Search PubMed.
- H. M. Freundlich, Over the adsorption in solution, J. Phys. Chem., 1906 Mar, 57(385471), 1100–1107 Search PubMed.
- O. J. Redlich and D. L. Peterson, A useful adsorption isotherm, J. Phys. Chem., 1959, 63, 1024 CrossRef CAS.
- A. A. Daifullah, S. M. Yakout and S. A. Elreefy, Adsorption of fluoride in aqueous solutions using KMnO 4-modified activated carbon derived from steam pyrolysis of rice straw, J. Hazard. Mater., 2007 Aug 17, 147(1), 633–643 Search PubMed.
- M. M. Dubinin and L. V. Radushkevich, Equation of the characteristic curve of activated charcoal, Chem. Zentralbl., 1947, 1(1), 875 Search PubMed.
- I. Saha, S. Kanrar, K. Gupta, B. Show, D. Nandi, K. Biswas, B. Manna, D. Chatterjee and U. C. Ghosh, Tuned synthesis and characterizational insight into β-cyclodextrin amended hydrous iron-zirconium hybrid oxide: a promising scavenger of fluoride in aqueous solution, RSC Adv., 2016, 6(96), 93842–93854 RSC.
- Y. Chen, Q. Zhang, L. Chen, H. Bai and L. Li, Basic aluminumsulfate@ graphene hydrogel composites: preparation and application for removal of fluoride, J. Mater. Chem. A, 2013, 1(42), 13101–13110 CAS.
Footnote |
| † Electronic supplementary information (ESI) available. See DOI: 10.1039/c7ra00265c |
| This journal is © The Royal Society of Chemistry 2017 |

