 Open Access Article
Creative Commons Attribution 3.0 Unported Licence
Differential pulse voltammetric determination of an immunosuppressive drug teriflunomide on an edge plane pyrolytic graphite electrode†
Kinga Kaczmarska *,
Mariola Brycht,
Andrzej Leniart and
Sławomira Skrzypek
University of Lodz, Faculty of Chemistry, Department of Inorganic and Analytical Chemistry, Tamka 12, 91-403 Lodz, Poland. E-mail: kinga.kaczmarska@o2.pl
First published on 16th May 2017
Abstract
In the present work, sensitive and selective determination of teriflunomide (Trf) on an edge plane pyrolytic graphite electrode (EPPGE) using differential pulse voltammetry (DPV) is presented for the first time. It was found that Trf gives a single well-defined oxidation peak at ca. +1.0 V vs. Ag/AgCl (3 mol L−1 KCl) in Britton–Robinson buffer solution (BRBS) at pH 3.0. The optimization of pH and DPV parameters was performed. A linear response of Trf was obtained in the range of 2.5 × 10⁻⁶ to 5.0 × 10⁻⁵ mol L−1 for EPPGE. The limit of detection (LOD) and limit of quantification (LOQ) were found to be 6.2 × 10⁻⁷ mol L−1 and 2.1 × 10⁻⁶ mol L−1, respectively. Furthermore, the proposed method was validated and successfully applied for the determination of Trf in the spiked samples of human urine with satisfactory recoveries in the range of 95.2–103.5% (RSD = 4.2%). The influence of potential interfering agents on the peak current response of Trf was also studied. Moreover, to understand the electrooxidation process of Trf on EPPGE, cyclic voltammetry (CV) was employed. Additionally, the surface topography and morphology of the EPPGE were characterized by atomic force microscopy (AFM) and scanning electron microscopy (SEM), respectively. The surface area of EPPGE was calculated based on the Randles–Sevcik equation.
1. Introduction
The most famous and incurable autoimmune disease that attacks the central nervous system is multiple sclerosis (MS).1 The disease's symptoms occur when the myelin sheaths in nerve cells in the central nervous system (brain and spinal cord) are damaged and consequently cause abnormal impulse transmission.2 Multiple sclerosis can cause a variety of symptoms and syndromes, and the most common are movement disorders, sensory, cerebellar (balance disorder), visual disturbances, pain syndromes, and psychiatric symptoms (cognitive and mood disorders).3 There is no medicine which could completely stop the progression of the MS, but there are many drugs and therapeutic approaches that are helpful to reduce the symptoms of the disease.3 One of them is teriflunomide (Trf, (2Z)-2-cyano-3-hydroxy-N-[4-(trifluoromethyl) phenyl]but-2-enamide, Fig. 1). Trf is an immunosuppressive drug with anti-inflammatory properties which selectively and reversibly inhibits the mitochondrial enzyme dihydroorotate dehydrogenase (DHO-DH) required for the de novo pyrimidine synthesis.4 As a consequence of confined de novo pyrimidine production, Trf reduces the proliferation of activated T and B cells, which are thought to participate in the inflammatory process in the central nervous system.5 Trf was accepted by the FDA (Food and Drug Administration, USA) on September 2012, and in the European Union on August 2013 for the treatment of adult patients with relapsing-remitting multiple sclerosis (RRMS).6On the basis of the literature survey, the most popular technique for the determination of Trf in biological fluids or pharmaceutical formulations is chromatography, i.e. high-performance liquid chromatography with UV detection (HPLC-UV),7 liquid chromatography-tandem mass spectrometry (LC-MS/MS),8,9 liquid chromatography with UV detection (LC-UV),9 and chromatography-electrospray-tandem mass spectrometry (LC-ESI-MS/MS).10 These methods belong to one of the most selective and sensitive, but on the other hand, they have some disadvantages, i.e. time consuming and tedious analysis, expensive instruments and large consumption organic solvents. In addition, the pretreatment procedure (plasma preparation, derivatization, extraction process and purification) is required in the analysis of complex matrices such as human urine, blood or serum.11 Electrochemical methods including voltammetric techniques are characterized by high selectivity, sensitivity, reproducibility, rapid response of detection, and low cost of equipment, and very often they are used for the determination of a wide range of pharmaceutical substances.12–14 To the best of our knowledge, no information about the voltammetric determination of Trf has been described in the literature.
So far, the carbon-based electrode materials, i.e. carbon paste,15,16 glassy carbon,17,18 boron-doped diamond,19,20 screen-printed carbon,21,22 and pyrolytic graphite,23,24 were commonly used as working electrodes in electrochemistry, and were shown to be an adequate choice for the large number of applications.
Edge plane pyrolytic graphite (EPPG) is manufactured from highly ordered pyrolytic graphite (HOPG). The EPPGE is produced by cutting the desirable electrode surface geometry such that the layers of graphite lie perpendicular to the surface.25,26 Furthermore, the EPPGE is used in voltammetry as working electrode on the grounds of low background current, long term stability and reproducibility, high selectivity and sensitivity.27 Moreover, EPPGE is characterized by strong adsorption properties and wide electrochemical window in aqueous solutions.28
In this paper, the application of EPPGE as a working electrode and the development of the procedure for the determination of Trf in spiked human urine samples by DPV technique was performed. To date, Trf has not been yet studied electrochemically on the other working electrodes. Attention was paid out to the elucidation of the nature of the used DPV peak of Trf at EPPGE. Special attention was given to the investigation of EPPGE by AFM and SEM and to the evaluation of the electrochemical active surface area.
2. Materials and methods
2.1. Instrumentation
Electrochemical experiments were performed using a μAutolab type II potentiostat-galvanostat (EcoChemie, Autolab B.V., Utrecht, The Netherlands) controlled by GPES software (General Purpose Electrochemical System, version 4.9) in conjunction with an M164 electrode stand (MTM Anko Instruments, Cracow, Poland). A conventional three-electrode glass cell was used with a platinum wire (Pt, 99.99%, The Mint. of Poland S.A., Warsaw, Poland) as a counter electrode, silver/silver chloride electrode/potassium chloride (Ag/AgCl, 3.0 mol L−1 KCl, Mineral, Poland) as a reference electrode, and an edge plane pyrolytic graphite electrode (EPPGE, ALS Company Ltd, Japan) with an inner disc diameter of 6 mm as a working electrode. The pH measurements of the buffer solutions were carried out using an Orion Star pH meter (Model A111, Thermo Scientific, The Netherlands) with a pH electrode (type Polilyte Lab, Hamilton, Switzerland). The atomic force microscopy (AFM, Dimension Icon, Bruker, Santa Barbara, CA, USA) was used to characterize the topography of the edge plane pyrolytic graphite electrode surface. The scanning electron microscopy (SEM, Nova NanoSEM450, FEI) was applied to evaluate the surface morphology of EPPGE.2.2. Reagents and solutions
The analytical standard of Trf (CAS Reg. No. 108605-62-5, Selleck Chemicals, Germany) was of 99.71% purity. Stock solution of Trf (1.0 × 10⁻³ mol L−1) was prepared in a glass flask by dissolving the substance in a methanol (99.8%, POCh SA, Gliwice, Poland) and refrigerated when not used. Sulfuric acid (96.0%, POCh SA, Gliwice, Poland), potassium chloride and potassium ferricyanide (Witko, Poland) were of analytical reagent grade. Britton–Robinson buffer solutions (BRBS) were prepared by mixing the same concentrations (0.04 mol L−1) of orthophosphoric acid (85.0%, POCh SA Gliwice, Poland), acetic acid (99.5%, POCh SA Gliwice, Poland) and boric acid (Witko, Poland) in triply distilled water, and they were adjusting to the desired pH value with sodium hydroxide (0.2 mol L−1, POCh SA Gliwice, Poland).The analytical standards of interfering agents, i.e. ascorbic acid, uric acid, paracetamol, dopamine, epinephrine, K+, Na+, Ca2+, and Mg2+, were of analytical reagent grade. The concentration of stock solutions of interfering agents was 1.0 × 10⁻³ mol L−1. All experiments were conducted at room temperature.
2.3. Measurement procedures
![[thin space (1/6-em)]](https://www.rsc.org/images/entities/char_2009.gif) :
:![[thin space (1/6-em)]](https://www.rsc.org/images/entities/char_2009.gif) cTrf) were as follows: 0.5
cTrf) were as follows: 0.5![[thin space (1/6-em)]](https://www.rsc.org/images/entities/char_2009.gif) :
:![[thin space (1/6-em)]](https://www.rsc.org/images/entities/char_2009.gif) 1, 1
1, 1![[thin space (1/6-em)]](https://www.rsc.org/images/entities/char_2009.gif) :
:![[thin space (1/6-em)]](https://www.rsc.org/images/entities/char_2009.gif) 1, 2
1, 2![[thin space (1/6-em)]](https://www.rsc.org/images/entities/char_2009.gif) :
:![[thin space (1/6-em)]](https://www.rsc.org/images/entities/char_2009.gif) 1, 5
1, 5![[thin space (1/6-em)]](https://www.rsc.org/images/entities/char_2009.gif) :
:![[thin space (1/6-em)]](https://www.rsc.org/images/entities/char_2009.gif) 1, and 10
1, and 10![[thin space (1/6-em)]](https://www.rsc.org/images/entities/char_2009.gif) :
:![[thin space (1/6-em)]](https://www.rsc.org/images/entities/char_2009.gif) 1. The evaluation of interferences was accomplished under optimized experimental conditions.
1. The evaluation of interferences was accomplished under optimized experimental conditions.The scanning electron microscopy was applied to evaluate the surface morphology of EPPGE. In the SEM measurements, a through lens detector (TLD) was used at a beam energy of 5 kV.
3. Results and discussion
3.1. Determination of the electrochemical active surface area of EPPGE
In this work, Fe(CN)63−/4− as common benchmark redox system was selected to determine the electrochemical active surface area of EPPGE by CV and Randles–Sevcik equation. Thus, the cyclic voltammograms of 1.0 × 10⁻³ mol L−1 K3[Fe(CN)6] in 0.1 mol L−1 KCl as the supporting electrolyte were recorded at various scan rates (ν) in the range of 10 mV s−1 to 500 mV s−1. A well-defined redox couple was observed due to the presence of ferricyanide/ferrocyanide. As can be seen from the voltammograms recorded for the different scan rates (Fig. A1 in ESI†), two well-defined signals (anodic and cathodic peaks) were obtained. It was found that the peak-to-peak separation (ΔE) of cathodic and anodic peak was in the range from 146 mV to 298 mV, and the ratio of cathodic (Ip,c) and anodic (Ip,a) peak current was in the range from 0.96 to 0.99. The relationship of anodic or cathodic peak current vs. the square root of the scan rate (ν1/2) can be expressed by the equations (eqn (1) and (2)):| Ip,a (A) = 3.00 × 10⁻⁵ × ν1/2 (V s−1)1/2 + 1.31 × 10⁻⁶, (R2 = 0.9963) | (1) |
| Ip,c (A) = −2.42 × 10⁻⁵ × ν1/2 (V s−1)1/2 − 1.77 × 10⁻⁶, (R2 = 0.9962) | (2) |
To determine the electrochemical active surface area for a reversible electrode process, Ip is defined by the Randles–Sevcik equation30 (eqn (3)):
 | (3) |
![[thin space (1/6-em)]](https://www.rsc.org/images/entities/char_2009.gif) 485 C mol−1], R is the universal gas constant [8.314 J mol−1 K−1], A is the surface area of electrode [cm2], Ip refers to the peak current [A], n is the number of electrons involved in the redox reaction (n = 1 for K3[Fe(CN)6]), T is the absolute temperature [298 K], D is diffusion coefficient of K3[Fe(CN)6] [7.2 × 10⁻⁶ cm2 s−1], ν is scan rate [V s−1], and Co is the concentration of K3[Fe(CN)6] [1 × 10⁻³ mol L−1]. Thus, the value of A can easily be calculated from the slope of Ip on ν1/2 plot, and the electrochemical active surface area was evaluated as 0.0416 cm2. The obtained A value was closed to the active surface area for another EPPGE.31
485 C mol−1], R is the universal gas constant [8.314 J mol−1 K−1], A is the surface area of electrode [cm2], Ip refers to the peak current [A], n is the number of electrons involved in the redox reaction (n = 1 for K3[Fe(CN)6]), T is the absolute temperature [298 K], D is diffusion coefficient of K3[Fe(CN)6] [7.2 × 10⁻⁶ cm2 s−1], ν is scan rate [V s−1], and Co is the concentration of K3[Fe(CN)6] [1 × 10⁻³ mol L−1]. Thus, the value of A can easily be calculated from the slope of Ip on ν1/2 plot, and the electrochemical active surface area was evaluated as 0.0416 cm2. The obtained A value was closed to the active surface area for another EPPGE.31
3.2. AFM and SEM characterization of EPPGE surface
Prior to the use of the electrode material for electrochemical analysis, it is important to investigate the working electrode surface. Therefore, the microscopical characteristics of the EPPGE were performed using SEM and AFM. As can be seen from SEM images (Fig. 2B), the surface of EPPGE is fabricated from graphite platelets, which are perpendicular to the basal plane. The edge planes of the graphite platelets are characterized by the different length, height and various spacing. These properties were confirmed by AFM images (height and amplitude images) which are presented in Fig. 2A. The compact areas as well as areas with large crevices can be observed on EPPGE surface, what is clearly visible on the AFM amplitude images. The cross-section profile taken from the AFM height images (Fig. 2A) showed that the depth and width of crevices are from a few nanometers to few hundred nanometers. The roughness surface parameters (RMS) and surface area difference (SAD) were determined using the Bruker Nanoscope Analysis software (version 1.4). It was found that the RMS value for a scan area of 50 μm × 50 μm was equal to 108.3 ± 22.8 nm, and SAD value was calculated as 6.1 ± 0.4%.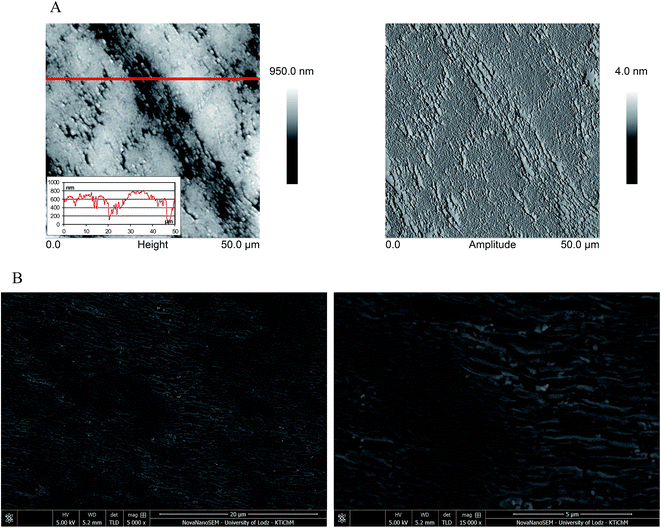 | ||
| Fig. 2 (A) AFM images (height and amplitude) of EPPGE with the cross-section profile along with the reference lines on height images, (B) SEM images of EPPGE. | ||
3.3. Electrochemical behavior of Trf
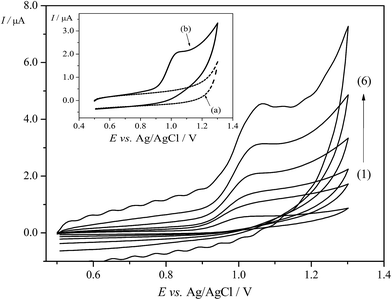
To evaluate the response of Trf on the EPPGE, the electrochemical study was performed employing CV. The valuable information concerning the electrode reaction mechanism (rate-determining step) can be accomplish from the relationship between the Ip and ν. Thus, the cyclic voltammograms for Trf (5.0 × 10⁻⁵ mol L−1) were recorded in BRBS at pH 3.0 at different scan rates from 10 mV s−1 to 400 mV s−1. The well-defined anodic peak of Trf at a potential of ca. +1.0 V on the EPPGE was obtained as depicted in Fig. 3. Moreover, sufficiently low background current on EPPGE was observed due to low interfacial capacitance (the inset of Fig. 3). It was found that in the presence of Trf, no redox peaks were observed in the cathodic run in the investigated potential window. This behavior suggests an irreversible process on the EPPGE. The peak potential (Ep) of the oxidation peak of Trf was also dependent on scan rate, and shifted to more positive values with increasing the ν (Fig. A2A in ESI†). This behaviour corroborates the irreversibility of the electrode reaction.Furthermore, the studies on the scan rate were carried out to evaluate the rate-limiting step on EPPGE (diffusion- or adsorption-controlled). The dependences of the Ip vs. ν1/2 was linear (Fig. A2B in ESI†) which is characteristic for a typical diffusion-controlled process.32 The above-mentioned relation can be expressed by following equation (eqn (4)):
| Ip (μA) = 0.066ν1/2 (mV s−1)1/2 − 0.023, (R2 = 0.9892) | (4) |
In addition, the effect of logarithm of oxidation peak current (log![[thin space (1/6-em)]](https://www.rsc.org/images/entities/char_2009.gif) Ip) of Trf on the logarithm of scan rate (log
Ip) of Trf on the logarithm of scan rate (log![[thin space (1/6-em)]](https://www.rsc.org/images/entities/char_2009.gif) ν) was investigated (Fig. A2C in ESI†). The above data yields the following equation (eqn (5)):
ν) was investigated (Fig. A2C in ESI†). The above data yields the following equation (eqn (5)):
log![[thin space (1/6-em)]](https://www.rsc.org/images/entities/char_2009.gif) Ip (μA) = 0.49 Ip (μA) = 0.49![[thin space (1/6-em)]](https://www.rsc.org/images/entities/char_2009.gif) log log![[thin space (1/6-em)]](https://www.rsc.org/images/entities/char_2009.gif) ν (mV s−1) − 1.17, (R2 = 0.9843) ν (mV s−1) − 1.17, (R2 = 0.9843)
| (5) |
A plot of log![[thin space (1/6-em)]](https://www.rsc.org/images/entities/char_2009.gif) Ip vs. log
Ip vs. log![[thin space (1/6-em)]](https://www.rsc.org/images/entities/char_2009.gif) ν gave a straight line with slope of 0.49. This value is very close to the theoretical value of 0.5, which indicated that the transfer process of Trf to the electrode surface was diffusion-controlled.33
ν gave a straight line with slope of 0.49. This value is very close to the theoretical value of 0.5, which indicated that the transfer process of Trf to the electrode surface was diffusion-controlled.33
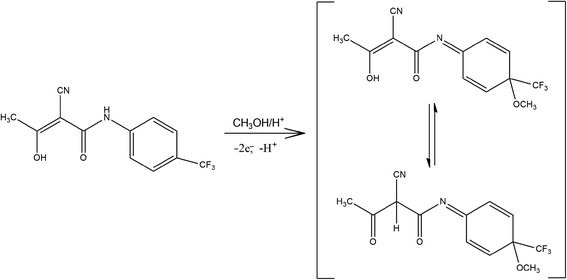
For an irreversible process at 25 °C, the number of electrons taking part in the electrode process of analyte can be calculated from the difference between the Ep and half wave potential (Ep/2) according to the equation given by Nicholson and Shain34 described as (eqn (6)):
| ΔEp (mV) = Ep− Ep/2 = (47.7/αn) | (6) |
3.4. Influence of pH and DPV parameters on the voltammetric behavior of Trf
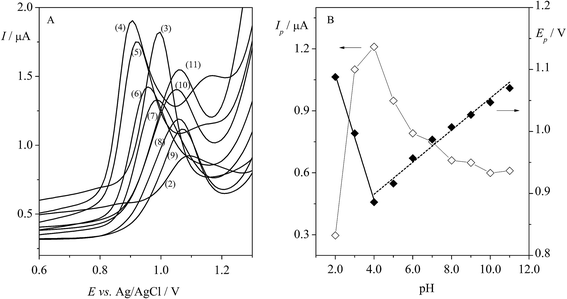
An important stage in this study was choosing the pH of the supporting electrolyte. In our work, the effect of BRBS on Trf (5.0 × 10⁻⁵ mol L−1) over a pH range from 2.0 to 11.0 was examined using DPV. The obtained voltammograms are depicted in Fig. 4A. It was found that Trf provided one oxidation peak at positive potentials (in the range of ca. 0.9–1.0 V) in BRBS, except for the pH 4.0 and 5.0 where two peaks were observed at potentials of ca. +0.9 V and +1.2 V, respectively. As can be seen from Fig. 4B (◊, left y axis), the rapid enhancement of the peak current of Trf with increasing pH was indicated with maximum at pH 4.0. Thereafter, Ip started to decrease progressively. The highest analytical signal was obtained at pH 4.0, nevertheless, the best results for Trf, i.e. well-defined voltammetric profile peak and low background current were obtained with BRBS at pH 3.0, thus, this medium was used for further voltammetric experiments.In addition, the shift of the peak potential of Trf was observed with increasing pH as depicted in Fig. 4B (♦, right y axis). The evolution of Ep vs. pH showed two linear segments in the pH ranges between 2.0 and 4.0 and 4.0 and 11.0. The dependence of anodic peak potential (Ep) on the pH of supporting electrolyte can be presented by the following equations (eqn (7) and (8)):
| Ep (V) = −0.096 pH + 1.28, (R2 = 0.9991) | (7) |
| Ep (V) = 0.025 pH + 0.801, (R2 = 0.9804) | (8) |
It was found that the peak potentials shifted towards less positive values (from +1.09 to +0.87 V) with the slope of −96 mV pH−1 in the pH range 2.0–4.0 (eqn (7)). As can be seen from Fig. 4B, the peak potentials in the pH range from 4.0 to 11.0 were shifted towards more positive values (from +0.87 to +1.07 V) with the slope of 25 mV pH−1. It is worth mentioning that the presence of two linear segments with breakdown in pH 4.0 was observed, and this change can be linked with the pKa value of Trf (theoretical value of 3.1).37
A very important step in the development of an electroanalytical methodology is optimization of parameters, which can influence the current response. Thus, the DPV parameters such as modulation amplitude (EDP), modulation time (tDP), and step potential (ΔEs) were studied in order to find the best experimental conditions for the quantification of Trf (5.0 × 10⁻⁵ mol L−1). During optimization, each parameter was gradually changed, while the others were kept a constant value. The DPV parameters, such as step potential of 10 mV, modulation amplitude of 60 mV, modulation time of 40 ms, and interval time (tint) of 200 ms, represent the optimum values with satisfactory height of current response of Trf (Fig. A3 in ESI†).
3.5. Analytical characteristics of Trf
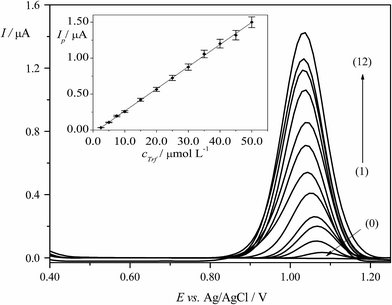
DPV technique was applied for the determination of Trf in BRBS (pH 3.0). Calibration curve for quantification of Trf was constructed by plotting the dependence of peak current vs. concentration of Trf (cTrf) under previously optimized experimental conditions described in Section 3.4. The proportional increase of the Ip values with increasing cTrf was observed in the linear dynamic range (LDR) of 2.5 × 10⁻⁶ to 5.0 × 10⁻⁵ mol L−1. The linear calibration plot along with error bars is presented in Fig. 5. Equation according to calibration graph is given below (eqn (9)):| Ip (μA) = 0.031cTrf (μmol L−1) − 0.044, (R2 = 0.9995) | (9) |
The characteristics and related validation parameters of the calibration equations are summarized in Table 1. LOD and LOQ were calculated from the data obtained from the analytical curves as described in the Section 2.3.1, and they were equal to 6.2 × 10⁻⁷ mol L−1 and 2.1 × 10⁻⁶ mol L−1, respectively. The precision (repeatability) was evaluated by four repetitive determinations (n = 4) for each concentration of Trf. The results showed that relative standard deviation (RSD) of the DPV peak current was ranged from 1.0% to 5.5%. In addition, the obtained results for different concentrations of Trf in the investigated concentration range were used to calculate the precision (RSD) which was changed in the range from 1.1% to 8.5%. To conclude, the proposed methodology could be used to determine Trf with satisfactory precision on the EPPGE.
| a LOD = 3 SD/b.b LOQ = 10 SD/b. | |
|---|---|
| Peak potential (Ep) vs. Ag/AgCl [V] | ca. +1.0 |
| Linear dynamic range (LDR) [mol L−1] | 2.5 × 10⁻⁶ to 5.0 × 10⁻⁵ |
| Slope (b) [μA L μmol−1] | 0.031 |
| Standard deviation of slope (SDb) [μA L μmol−1] | 1.1 × 10⁻³ |
| RSD of slope (RSDb) [%] | 3.6 |
| Intercept (a) [μA] | −0.044 |
| Standard deviation of intercept (SDa) [μA] | 1.2 × 10⁻⁹ |
| RSD of intercept (RSDa) [%] | 3.4 |
| Coefficient of determination (R2) | 0.9995 |
| Limit of detection (LOD) [mol L−1]a | 6.2 × 10⁻⁷ |
| Limit of quantification (LOQ) [mol L−1]b | 2.1 × 10⁻⁶ |
Taking into account the electrochemical behavior of Trf (paragraph 3.3). it is worth to add, that the obvious shift of the peak potential on concentration of Trf (Fig. 5) probably comes from the complexity of the electrode mechanism. The tautomeric equilibrium of Trf is the reactant of the electrode reaction, considering the proton exchange identically as in the product, between OH group and the C2 atom where cyano group is attached. Further, protonation of the N atom occurs in acidic medium, which is the reason for very complex pH dependence depicted in Fig. 4. Moreover, the other follow-up chemical reactions coupled to the electrode reaction are also probable, which make the electrode reaction irreversible. Thus, a complex combination of tautomeric equilibriums of Trf of the electrode reactions, protonation reaction of the product, and follow-up chemical reactions of the product, all together make a very complex scenario of the electrode mechanism, which is manifested as a dependence of the peak potential on the concentration.
3.6. Determination of Trf in spiked samples of human urine
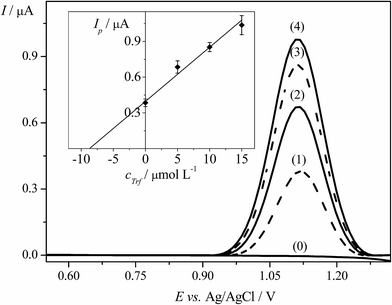
The EPPGE was applied to determine Trf in spiked samples of urine using DPV technique. Before analysis, the fresh urine was collected from volunteer and the samples of urine were prepared in an appropriate way, as described in Section 2.3.2. Furthermore, the standard addition method was applied for the determination of Trf in spiked urine as it was depicted in Section 2.3.2.The DP voltammograms and the corresponding standard addition plot are illustrated in Fig. 6. The average results of three replicate measurements were presented as confidence interval for 95% probability. Table 2 displays the results of analysis of human urine samples with sufficient average recovery value of 99.3% and with the RSD of 4.2%. To conclude, the obtained results showed that the proposed DPV method could be used for the determination of Trf in the complex matrix of human urine samples. The method is adequately accurate and suitable for quantification of Trf.
3.7. Interference study
The selectivity of proposed method was estimated via the investigation of the impact of potential interfering agents, which could occur in the human urine as described in Section 2.3.3. It was found that many of interfering substances affected on determination of Trf (except of Mg2+). Moreover, no significant decrease on peak current with changing ratio of concentrations of Trf on Int (cInt![[thin space (1/6-em)]](https://www.rsc.org/images/entities/char_2009.gif) :
:![[thin space (1/6-em)]](https://www.rsc.org/images/entities/char_2009.gif) cTrf) of 0.5
cTrf) of 0.5![[thin space (1/6-em)]](https://www.rsc.org/images/entities/char_2009.gif) :
:![[thin space (1/6-em)]](https://www.rsc.org/images/entities/char_2009.gif) 1, 1
1, 1![[thin space (1/6-em)]](https://www.rsc.org/images/entities/char_2009.gif) :
:![[thin space (1/6-em)]](https://www.rsc.org/images/entities/char_2009.gif) 1, 2
1, 2![[thin space (1/6-em)]](https://www.rsc.org/images/entities/char_2009.gif) :
:![[thin space (1/6-em)]](https://www.rsc.org/images/entities/char_2009.gif) 1, 5
1, 5![[thin space (1/6-em)]](https://www.rsc.org/images/entities/char_2009.gif) :
:![[thin space (1/6-em)]](https://www.rsc.org/images/entities/char_2009.gif) 1, and 10
1, and 10![[thin space (1/6-em)]](https://www.rsc.org/images/entities/char_2009.gif) :
:![[thin space (1/6-em)]](https://www.rsc.org/images/entities/char_2009.gif) 1 was observed for the uric acid, paracetamol, ascorbic acid, and epinephrine. It was found that initially the peak currents increased for the ratios of ascorbic acid and K+, Na+, Ca2+ of 0.5
1 was observed for the uric acid, paracetamol, ascorbic acid, and epinephrine. It was found that initially the peak currents increased for the ratios of ascorbic acid and K+, Na+, Ca2+ of 0.5![[thin space (1/6-em)]](https://www.rsc.org/images/entities/char_2009.gif) :
:![[thin space (1/6-em)]](https://www.rsc.org/images/entities/char_2009.gif) 1, 1
1, 1![[thin space (1/6-em)]](https://www.rsc.org/images/entities/char_2009.gif) :
:![[thin space (1/6-em)]](https://www.rsc.org/images/entities/char_2009.gif) 1, and then in the ratios of 2
1, and then in the ratios of 2![[thin space (1/6-em)]](https://www.rsc.org/images/entities/char_2009.gif) :
:![[thin space (1/6-em)]](https://www.rsc.org/images/entities/char_2009.gif) 1, 5
1, 5![[thin space (1/6-em)]](https://www.rsc.org/images/entities/char_2009.gif) :
:![[thin space (1/6-em)]](https://www.rsc.org/images/entities/char_2009.gif) 1, and 10
1, and 10![[thin space (1/6-em)]](https://www.rsc.org/images/entities/char_2009.gif) :
:![[thin space (1/6-em)]](https://www.rsc.org/images/entities/char_2009.gif) 1 slightly decreased. The results are illustrated in Fig. 7. Notwithstanding, it can be stated that an insignificant impact of interferents was observed and the DPV method at EPPGE suggest the promising opportunity for the determination of Trf.
1 slightly decreased. The results are illustrated in Fig. 7. Notwithstanding, it can be stated that an insignificant impact of interferents was observed and the DPV method at EPPGE suggest the promising opportunity for the determination of Trf.
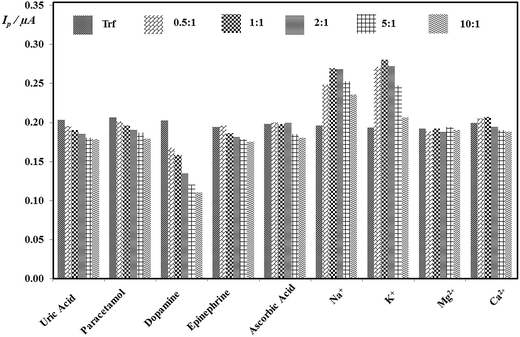 | ||
Fig. 7 Histograms of the peak current in the presence the concentration ratios of varying concentrations of each Int to fixed concentration of Trf (cInt![[thin space (1/6-em)]](https://www.rsc.org/images/entities/char_2009.gif) : :![[thin space (1/6-em)]](https://www.rsc.org/images/entities/char_2009.gif) cTrf). cTrf). | ||
4. Conclusions
In the present work, EPPGE in combination with DPV was applied for the first time to develop the novel, simple, fast and inexpensive voltammetric method for quantification of Trf. The proposed procedure was employed for the determination of Trf in the spiked human urine with good recoveries. It was showed that EPPGE electrode may be used as sensitive working electrode in clinical analysis of different biologically active compounds and could substitute complex and costly separation methods. Furthermore, this method requires significantly less organic solvents in comparison with the chromatographic techniques. The interference study revealed that the use of proposed method in this kind of analysis could be limited depending on the presence of some common compounds. Moreover, the proposed electrode can also be used for the analysis of urine samples of patients undergoing treatment with teriflunomide to evaluate Trf present in urine samples with no special pretreatment of samples except suitable dilution. Hence, the EPPGE is also likely to be useful device for quality control analysis in analytical laboratories and pharmaceutical industries.Acknowledgements
The authors are very grateful to Prof. Dr Valentin Mirceski (Ss. Cyril and Methodius University, Skopje) for stimulating discussions. This work was supported by Grants No. B1611100001291.02 and B1611100000047.01 from the University of Lodz, Poland.References
- K. Berer and G. Krishnamoorthy, FEBS Lett., 2014, 22, 4207–4213 CrossRef PubMed.
- F. D. Lublin and S. C. Reingold, Neurology, 1996, 4, 907–911 CrossRef.
- A. Compston and A. Coles, Lancet, 2002, 9313, 1221–1231 CrossRef.
- C. Colosimo, A. Gil–Nagel, N. E. Gilhus, A. Rapoport and O. Williams, Handbook of Neurological Therapy, Oxford University Press, New York, 2015 Search PubMed.
- A. Bar-Or, A. Pachner, F. Menguy-Vacheron, J. Kaplan and H. Wiendl, Drugs, 2014, 74, 659–674 CrossRef CAS PubMed.
- European Medicines Agency, Aubagio EU summary of product characteristics, http://www.ema.europa.eu/docs/en_GB/document_library/EPAR_Product_Information/human/002514/WC500148682.pdf, 2015, accessed 20.05.15.
- E. N. van Roona, J. P. Yska, J. Raemaekers, T. L. Th. A. Jansen, M. van Wanrooy and J. R. B. J. Brouwers, J. Pharm. Biomed. Anal., 2004, 36, 17–22 CrossRef PubMed.
- H. Rakhila, T. Rozek, A. Hopkins, S. Proudman, L. Cleland, M. James and M. Wiesea, J. Pharm. Biomed. Anal., 2011, 55, 325–331 CrossRef CAS PubMed.
- A. Suneetha and R. K. Rajab, Biomed. Chromatogr., 2016, 9, 1371–1377 CrossRef PubMed.
- J. M. Parekh, R. N. Vaghela, D. K. Sutariya, M. Sanyal, M. Yadav and P. S. Shrivastav, J. Chromatogr. B: Anal. Technol. Biomed. Life Sci., 2010, 878, 2217–2225 CrossRef CAS PubMed.
- M. Wang, P. Ma, X. Xi, L. Liu, Y. Wen, K. Liu, L. Sun, Y. Lu and Z. Yin, Talanta, 2016, 161, 278–287 CrossRef CAS PubMed.
- N. A. El-Maali, Bioelectrochemistry, 2004, 64, 99–107 CrossRef PubMed.
- M. Brycht, S. Skrzypek, N. Karadaş, S. Smarzewska, B. Bozal-Palabiyik, S. A. Özkan and B. Uslu, Ionics, 2015, 21, 2345–2354 CrossRef CAS.
- M. Brycht, K. Kaczmarska, B. Uslu, S. A. Ozkan and S. Skrzypek, Diamond Relat. Mater., 2016, 68, 13–22 CrossRef CAS.
- I. Švancara, K. Vytras, K. Kalcher, A. Walcarius and J. Wang, Electroanalysis, 2009, 21, 7–28 CrossRef.
- R. Pauliukaite, R. Metelka, I. Švancara, A. Królicka, A. Bobrowski, K. Vytřas, E. Norkus and K. Kalcher, Anal. Bioanal. Chem., 2002, 374, 1155–1158 CrossRef CAS PubMed.
- A. Leniart, M. Brycht, B. Burnat and S. Skrzypek, Sens. Actuators, B, 2016, 231, 54–63 CrossRef CAS.
- B. Dogan-Topal, B. Bozal-Palabiyik, S. A. Ozkan and B. Uslu, Rev. Roum. Chim., 2015, 60, 467–475 Search PubMed.
- M. Brycht, S. Skrzypek, K. Kaczmarska, B. Burnat, A. Leniart and N. Gutowska, Electrochim. Acta, 2015, 169, 117–125 CrossRef CAS.
- M. Brycht, P. Lochyński, J. Barek, S. Skrzypek, K. Kuczewski and K. Schwarzova-Peckova, J. Electroanal. Chem., 2016, 771, 1–9 CrossRef CAS.
- S. Dal Borgo, H. Sopha, S. Smarzewska, S. B. Hočevar, I. Švancara and R. Metelka, Electroanalysis, 2015, 27, 209–216 CrossRef CAS.
- V. Sosa, C. Barceló, N. Serrano, C. Ariño, J. M. Díaz-Cruz and M. Esteban, Anal. Chim. Acta, 2015, 855, 34–40 CrossRef CAS PubMed.
- R. N. Goyal, A. R. S. Rana and H. Chasta, Bioelectrochemistry, 2012, 83, 46–51 CrossRef PubMed.
- M. Brycht, S. Skrzypek, N. Karadaş, S. Smarzewska, B. Bozal-Palabiyik, S. A. Özkan and B. Uslu, Ionics, 2015, 21, 2345–2354 CrossRef CAS.
- C. E. Banks and R. G. Compton, Anal. Sci., 2005, 21, 1263–1268 CrossRef CAS PubMed.
- C. E. Banks and R. G. Compton, Analyst, 2006, 131, 15–21 RSC.
- W. J. Lin, C. S. Liao, J. H. Jhang and Y. C. Tsai, Electrochem. Commun., 2009, 11, 2153–2156 CrossRef CAS.
- S. Kurbanoglu, B. Dogan-Topal, B. Uslu, A. Can and S. A. Ozkan, Electroanalysis, 2013, 25, 1473–1482 CrossRef CAS.
- A. Krueger, Carbon Materials and Nanotechnology, Wiley-VCH, Weinheim, 2010 Search PubMed.
- B. Rezaei and S. Damiri, Sens. Actuators, B, 2008, 134, 324–331 CrossRef CAS.
- R. N. Goyal and S. Bishnoi, Bioelectrochemistry, 2010, 79, 234–240 CrossRef CAS PubMed.
- C. M. A. Brett and A. M. O. Brett, Electrochemistry: Principles, Methods and Applications, Oxford University Press, Oxford, UK, 1993 Search PubMed.
- J. Wang, Electroanalytical Techniques in Clinical Chemistry and Laboratory Medicine, Wiley-VCH, New York, 1988 Search PubMed.
- A. Bard and L. R. Faulkner, Electrochemical Methods: Fundamentals and Applications, Wiley, New York, 2nd edn, 2001 Search PubMed.
- R. M. Buoro, T. A. Enache, S. H. P. Serrano and A. M. Oliveira-Brett, J. Electroanal. Chem., 2014, 729, 61–67 CrossRef CAS.
- H. Lund and O. Hammerich, Organic Electrochemistry, Marcel Dekker, 4th edn, 2001 Search PubMed.
- Committee for Medicinal Products for Human Use, Assessment report, European Medicines Agency, http://www.ema.europa.eu/docs/en_GB/document_library/EPAR_-_Public_assessment_report/human/002514/WC500148684.pdf, 2013, accessed 27.06.13.
Footnote |
| † Electronic supplementary information (ESI) available. See DOI: 10.1039/c7ra00407a |
| This journal is © The Royal Society of Chemistry 2017 |


