
 Open Access Article
 This Open Access Article is licensed under a
 Creative Commons Attribution 3.0 Unported Licence
Free-standing Ti3C2Tx electrode with ultrahigh volumetric capacitance†
Qishan Fua,
Jing Wena,
Na Zhangb,
Lili Wuc,
Mingyi Zhanga,
Shuangyan Lina,
Hong Gaoa and
Xitian Zhang *a
*a
aKey Laboratory for Photonic and Electronic Bandgap Materials, Ministry of Education, School of Physics and Electronic Engineering, Harbin Normal University, Harbin 150025, P. R. China. E-mail: xtzhangzhang@hotmail.com; Fax: +86-451-88060349; Tel: +86-451-88060349
bDepartment of Chemistry and Chemical Biology, Cornell University, Ithaca, NY, USA
cCenter for Engineering Training and Basic Experimentation, Heilongjiang University of Science and Technology, Harbin 150022, P. R. China
First published on 20th February 2017
Abstract
To meet the power needs of soft and portable electronics, such as wearable and small-sized electronic devices, development of the flexible energy storage devices with high volumetric capacitance is urgent. In fact, electrode materials are an important component of high-performance energy storage devices. Herein, we develop a flexible and free-standing paper electrode with ultrahigh volumetric performance based on layered 2D Ti3C2Tx by first etching, then immersing in LiCl solution, and finally vacuum-assisted filtration. This paper electrode achieves a volumetric capacitance of 892 F cm−3, which is comparable to the best datum reported previously for Ti3C2Tx clay, and also exhibits excellent cyclic performance without capacitance loss after 10![[thin space (1/6-em)]](https://www.rsc.org/images/entities/char_2009.gif) 000 cycles. The paper electrodes with ultrahigh volumetric capacitance, outstanding flexibility and stability demonstrate their potential applications as high-performance power sources in wearable and small-sized electronic devices.
000 cycles. The paper electrodes with ultrahigh volumetric capacitance, outstanding flexibility and stability demonstrate their potential applications as high-performance power sources in wearable and small-sized electronic devices.
Supercapacitors (SCs) have gained considerable attention in recent years for their rapidly growing energy storage applications ranging from consumer electronics to industrial power supplies.1 Compared to lithium-ion batteries, SCs have higher power density, faster charging/discharging capability, safer operational condition and longer cycling life. However, their energy density is still much lower than that of batteries, which has limited their practical applications. Increasing the energy density without sacrificing the high power density of SCs has become a great challenge in the field. One promising approach is to develop new electrode materials with both high capacity and long cycle life.2 Various research efforts have been devoted to exploring efficient electrode materials as candidates for positive or negative electrodes of SCs. Significant progress has been made in developing positive electrode materials, such as metal oxides/hydroxides,3 metal sulfides,4 and conductive polymers,5 but negative electrode materials remain largely unexplored. Carbon-based materials, such as amorphous carbons,6 carbide-derived carbons,7 graphene materials,8 and carbon nanocomposition5,8 and other carbon-based materials, have been intensively studied and commercially used as negative electrodes of SCs. However, their volumetric capacitances (in the range of 50–570 F cm−3)5,9–11 suffer from low package densities. It is believed that a low specific capacitance of a negative electrode will limit the energy density of SCs significantly according to the equation of 1/C = 1/Cn + 1/Cp, where Cn and Cp represent capacitances of negative and positive electrodes, respectively. Therefore, new materials with higher package densities need to be explored to improve the volumetric capacitance. For practical applications, the volumetric capacitance is a vital factor for the energy storage efficiency of SCs, particularly for portable electronics and mobile devices that need high energy storage in limited volume space.5
Layered two-dimensional (2D) early transition metal carbides (Mn+1XnTx), also called MXenes, have been developed as a new class of negative electrode materials for SCs and Li-ion batteries2,12 and exhibit great potential to replace carbon-based materials. MXenes are produced by selective etching of the “A” element from the MAX phases. The MAX phases have a general formula of Mn+1AXn (n = 1, 2, 3), where “M” stands for an early transition metal (M = Ti, V, Nb, etc.), “A” stands for an A-group element (A = Al, Si, etc.), and “X” represents C and/or N. In Mn+1XnTx, “T” denotes –O, –OH, and –F functional groups terminated on the surface, which are introduced after etching by hydrofluoric acid (HF) aqueous solution, “x” stands for the number (0 < x ≤ 2) of termination groups.2,13 The MXenes can offer a unique combination of hardness, high melting point, good electrical conductivity, excellent oxidation resistance, and hydrophilicity.2,13 They can be made from low-cost raw materials and exfoliated into atomically thin sheets with large electrochemically active surfaces by etching. Many different cations, including H+, Li+, Na+, Mg2+, and Al3+, can be intercalated electrochemically into the thin MXene sheets, providing a high volumetric capacitance.2 Because of the merits mentioned above, 2D MXenes have been investigated theoretically14,15 and experimentally2,16,17 for energy storage applications. They were usually synthesized by immersing Al- or Ga-containing MAX powders in HF aqueous solution,2,13 ammonium bifluoride (NH4HF2),18 or an aqueous solution of lithium fluoride (LiF) and hydrochloric acid (HCl)19 at room temperature. A large group of 2D MXenes, including Ti3C2Tx,2 Ti2CTx,20 Mo2CTx,17 Ta4C3Tx, (Ti0.5Nb0.5)2CTx, (V0.5Cr0.5)3C2Tx, V2CTx, Ti3CNTx,18 Nb2CTx,21 and Nb4C3Tx,22 have been synthesized and their physical and chemical properties have been widely investigated.18,19,23 As one of the most representative MXenes studied, 2D Ti3C2 flakes were produced by etching Al from Ti3AlC2 with concentrated HF in a lengthy multi-step procedure and the electrode made of the 2D Ti3C2 flakes achieved a volumetric capacitance of over 300 F cm−3 in KOH electrolyte.2 Very recently, the synthesis of Ti3C2Tx flakes was conducted by etching with a mixed aqueous solution of LiF and HCl.19 The electrode made of the as-synthesized 2D Ti3C2Tx clay demonstrated a volumetric capacitance in excess of 900 F cm−3,19 which is comparable to noble metal oxides (such as RuO2).19 Furthermore, MXenes coated with polymer as well as carbon-based materials have been synthesized in order to improve their electrochemical performances.21,24,25 Among them, the PPy/Ti3C2Tx composite exhibited a high volumetric capacitances of 1000 F cm−3,25 which is the highest for 2D MXenes as electrode to the best of our knowledge. Other 2D MXenes such as Mo2C sheets17 were also synthesized with a mixture of LiF and HCl as etchants. When the 2D Mo2C sheets were tested as electrodes in SCs, the volumetric capacitance achieved as high as 700 F cm−3 in 1 M H2SO4 electrolyte. Based on the literatures and our experimental experience13 as well as recent results,26,27 we conclude that (i) a high volumetric capacitance is more easily obtained with a solution of LiF and HCl as etchants than concentrated HF; (ii) the trace amount of Li+ ions intercalate into 2D MXenes to increase the interlayer spacing of 2D MXenes, benefiting the charge transport and the intercalation and/or deintercalation of ions in electrolyte; (iii) the different synthesis and delamination routes result in significantly different electrochemical performance. In a word, the synthesis procedures play important roles in electrochemical performance of the MXenes. However, the development of effective synthesis procedures for preparing flexible and free-standing paper electrode with high volumetric capacitance remains a challenge.
In this work, we rationally design the synthesis procedure of 2D Ti3C2Tx, prepare the flexible and free-standing Ti3C2Tx paper electrode made of Ti3C2Tx sheets by first etching, then immersing in LiCl solution, finally vacuum-assistant filtration, and investigate its electrochemical performances.
2D Ti3C2Tx-Li sheets were synthesized by etching Al element from Ti3AlC2 powder with a mixed aqueous solution of HCl and LiF. The resultant Ti3C2Tx colloidal suspension was immersed in LiCl aqueous solution, which is essential to increase the active sites of the Ti3C2Tx sample and improve the negative electrode material utilization. The exfoliated Ti3C2Tx (labeled as Ti3C2Tx-Li) sheets with a few atomic layers thick and a large interlayer spacing were obtained by centrifugation. The formed colloidal suspension was filtered under vacuum on a polypropylene separator membrane to form a Ti3C2Tx-Li paper (labelled as TCTL-I) (Fig. S1†), it is highly conductive (3.6 × 10⁵ S m−1), flexible, and free-standing. The prepared paper needs no extra binders, conductive additives, or current collectors when it is used as the electrode.
Fig. 1a shows a typical scanning electron microscopy (SEM) image taken from the as-synthesized Ti3C2Tx-Li sheets. It is clear that a lot of dispersed thin sheets cover the entire substrate. The lateral size is in the range of 500 nm to 1 μm. The edge of the thin sheets appears sawtooth-like morphology. In order to gain further insight into the morphology and their microstructure, the transmission electron microscopy (TEM) measurements were performed. A representative TEM image of the ultrathin sheets is shown in Fig. 1b. The sheets are transparent and some small particles are found to adhere to their edges. The high-resolution TEM (HRTEM) image (Fig. 1c) and selected area electron diffraction (SAED) pattern (the inset of Fig. 1c) taken from the sheet along the 〈0001〉 zone axis show the crystallinity of the basal planes of the ultrathin sheets and the basal planes are attributed to the ±(0001) planes. The HRTEM image of the small particle is shown in Fig. 1d, which clearly displays the lattice fringes. The lattice spacing of 0.35 nm is consistent with the d values of (002) plane for carbon species. Some carbon particle clusters are also found in TEM test (Fig. S2†). Carbon species were previously synthesized by similar method.28 The Ti3C2Tx-Li single atom layers are about 12.9 Å thick (Fig. 1e). As can be clearly seen, most of the ultrathin sheets are a few atomic layers thick. The top-view SEM image of the TCTL-I in Fig. 1f shows the flat surface of the sample. The cross-sectional SEM image (Fig. 1g) of the TCTL-I demonstrates that the paper is composed of orderly stacked layers over the entire paper. The average thickness of the paper is approximately 8.8 μm (Fig. S3†). The energy dispersive X-ray (EDX) spectroscopy was used to analyze the composition of the TCTL-I. The EDX spectrum presented in Fig. S4† is mainly composed of Ti, C, F, O, and Cl, and trace amount of Al content, indicating the presence of electronegative surface termination species such as –O and/or –OH, –Cl, and –F. The overloaded carbon species are found in the EDX data. The XRD measurements were carried out. The pattern of the TCTL-I is shown in Fig. 2a (blue curve), revealing that only the (000l) peaks can be observed, confirming that the up and down surfaces of the Ti3C2Tx-Li sheets should be assigned to the ±(0001) planes, which is consistent with the TEM results. The (0002) peak centered at 6.16° in Fig. 2a is much stronger than those of other (000l) peaks in intensity. The corresponding XRD peaks of Ti3AlC2 powder are not found although the trace amount of Al (0.5 at%, Fig. S4†) is detected by EDX. The c-LP is calculated to be about 28.7 Å based on peak positions in Fig. 2a. The XRD pattern of the as-prepared Ti3C2Tx-Li paper after storing in air for 50 days (labeled as TCTL-II) was again measured, as shown in Fig. 2a (red curve). The (0002) peak position shifts to higher diffraction angle (6.88°). Thus, the c-LP changes into 25.7 Å, which is in consistence with the TEM result measured. The XRD pattern (green curve) of the previous Ti3C2Tx thin film obtained by etching with concentrated HF is also presented in Fig. 2a.13 Its c-LP is calculated to be approximately 19.2 Å in terms of the (0002) peak centered at 9.19°, which is larger than 18.6 Å of Ti3AlC2 (black curve) due to the –OH and/or –F surface groups attaching, but is 6.5 Å smaller than that of the TCTL-II, due to the presence of –Li group except the –OH and/or –F surface terminations in the TCTL-II, and 9.5 Å smaller than that of the TCTL-I due to the co-existence of water, –Li group, the –OH and/or –F surface terminations in the TCTL-I during the synthesis procedure, as shown in Fig. 2b. Surface chemical analysis of the TCTL-II was carried out using the X-ray photoelectron spectroscopy (XPS). The XPS survey scan of the TCTL-II presents five distinct peaks corresponding to Li 1s (60 eV), C 1s (285 eV), O 1s (531 eV), Ti 2p (454 eV), and F 1s (685 eV), as shown in Fig. 3a. Their chemical states (Table S1†) are obtained by fitting the respective high-resolution XPS spectra. The high-resolution XPS spectrum of C 1s can be deconvoluted into five peaks with Gaussian-like shapes corresponding to Ti–C, C–C, C–O, C![[double bond, length as m-dash]](https://www.rsc.org/images/entities/char_e001.gif) O, and O–CO, further indicating the presence of C species and oxygenated functional groups on the C species (Fig. 3b). The Raman scattering of the TCTL-II also confirms the presence of carbon (Fig. S5†). The O 1s peak is divided into six peaks, they are assigned to Ti–O, O–H, H–O–H, Oabs, CO, O–CO, and C–O, indicating the presence of –O and –HO surface termination of the TCTL-II and H2O in addition to the oxygenated functional groups on the C species (Fig. 3c). Deconvolution of Ti 2p1/2 and Ti 2p3/2 shows four peaks, respectively, corresponding to Ti–C and Ti–O species (Fig. 3d). The F 1s (Fig. 3e) and Li 1s (Fig. 3f) peaks reveal the presence of –F and –Li surface termination of the TCTL-II, respectively.
O, and O–CO, further indicating the presence of C species and oxygenated functional groups on the C species (Fig. 3b). The Raman scattering of the TCTL-II also confirms the presence of carbon (Fig. S5†). The O 1s peak is divided into six peaks, they are assigned to Ti–O, O–H, H–O–H, Oabs, CO, O–CO, and C–O, indicating the presence of –O and –HO surface termination of the TCTL-II and H2O in addition to the oxygenated functional groups on the C species (Fig. 3c). Deconvolution of Ti 2p1/2 and Ti 2p3/2 shows four peaks, respectively, corresponding to Ti–C and Ti–O species (Fig. 3d). The F 1s (Fig. 3e) and Li 1s (Fig. 3f) peaks reveal the presence of –F and –Li surface termination of the TCTL-II, respectively.
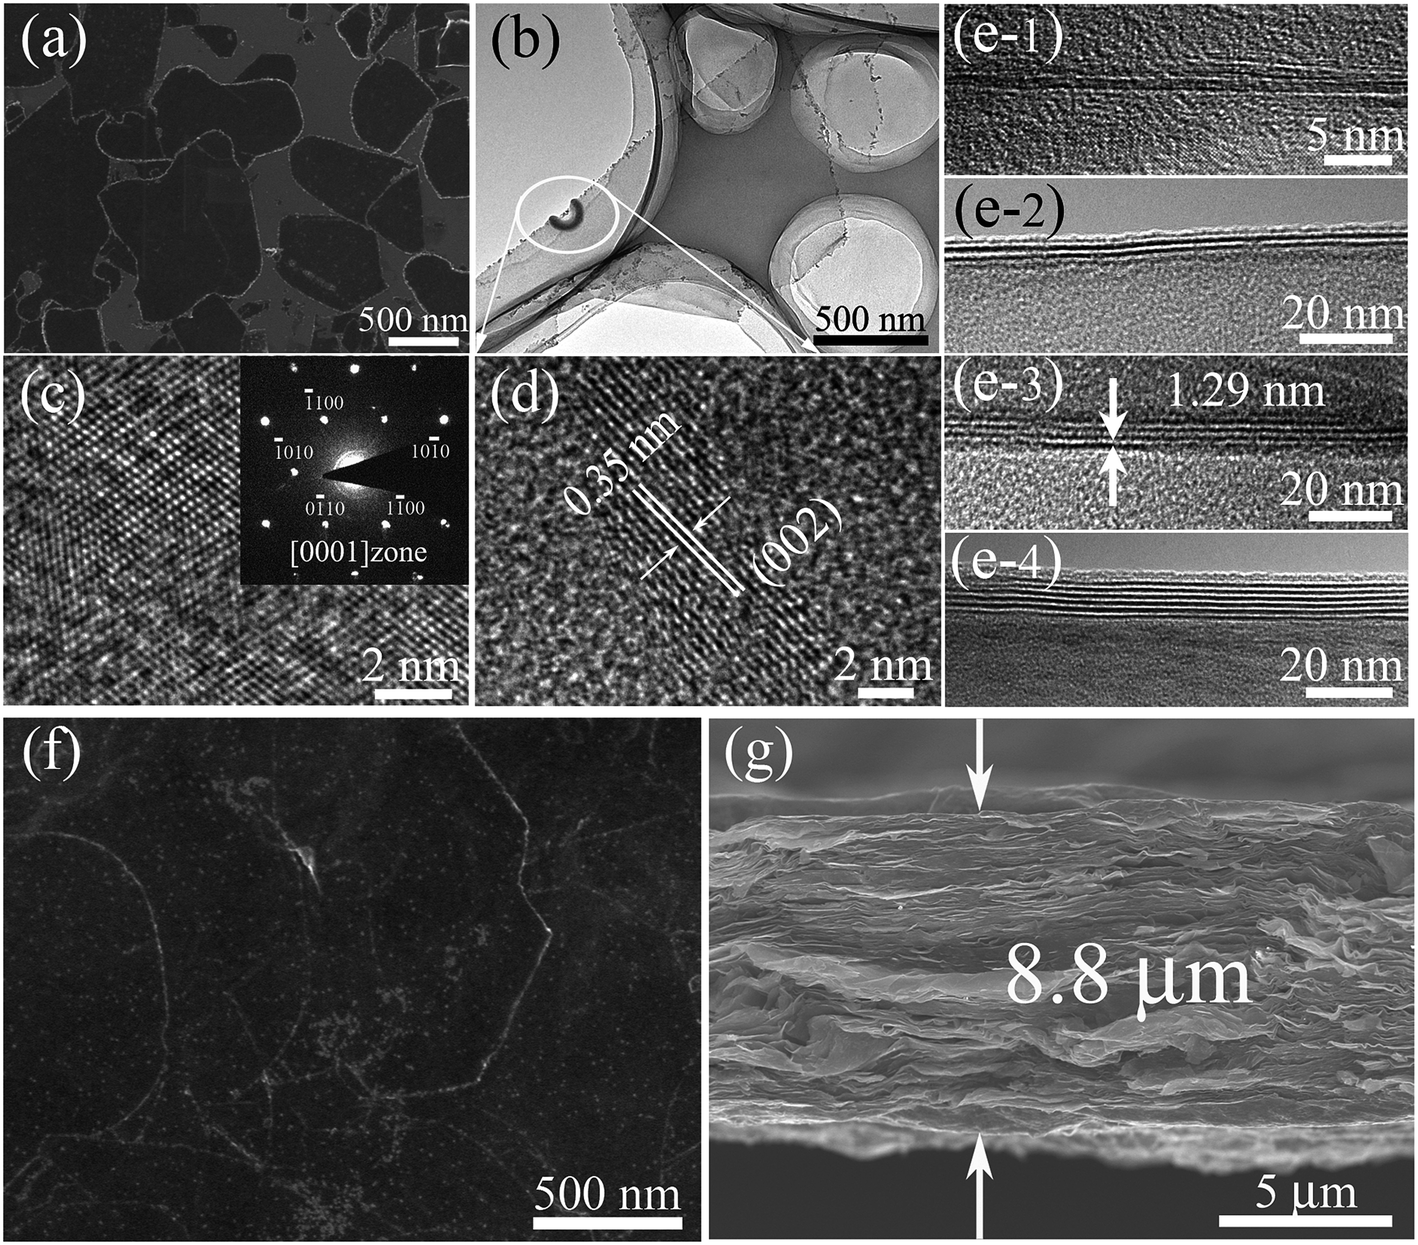 | ||
| Fig. 1 (a) A representative SEM image and (b) a typical TEM image taken from the as-synthesized Ti3C3Tx-Li sheets. (c) The HRTEM image of a Ti3C3Tx-Li sheet taken along the 〈0001〉 zone axis. Inset presents its SAED pattern. (d) The HRTEM image of the edge of the sheet in (b). (e) TEM images of the Ti3C3Tx-Li sheets with different layers thick. Their interlayer spacing is about 12.9 Å. (e-1): One layer, (e-2): two layers, (e-3): three layers, (e-4): six layers. SEM images of (f) the surface and (g) the cross-section of the Ti3C3Tx-Li paper obtained from the vacuum filtration. | ||
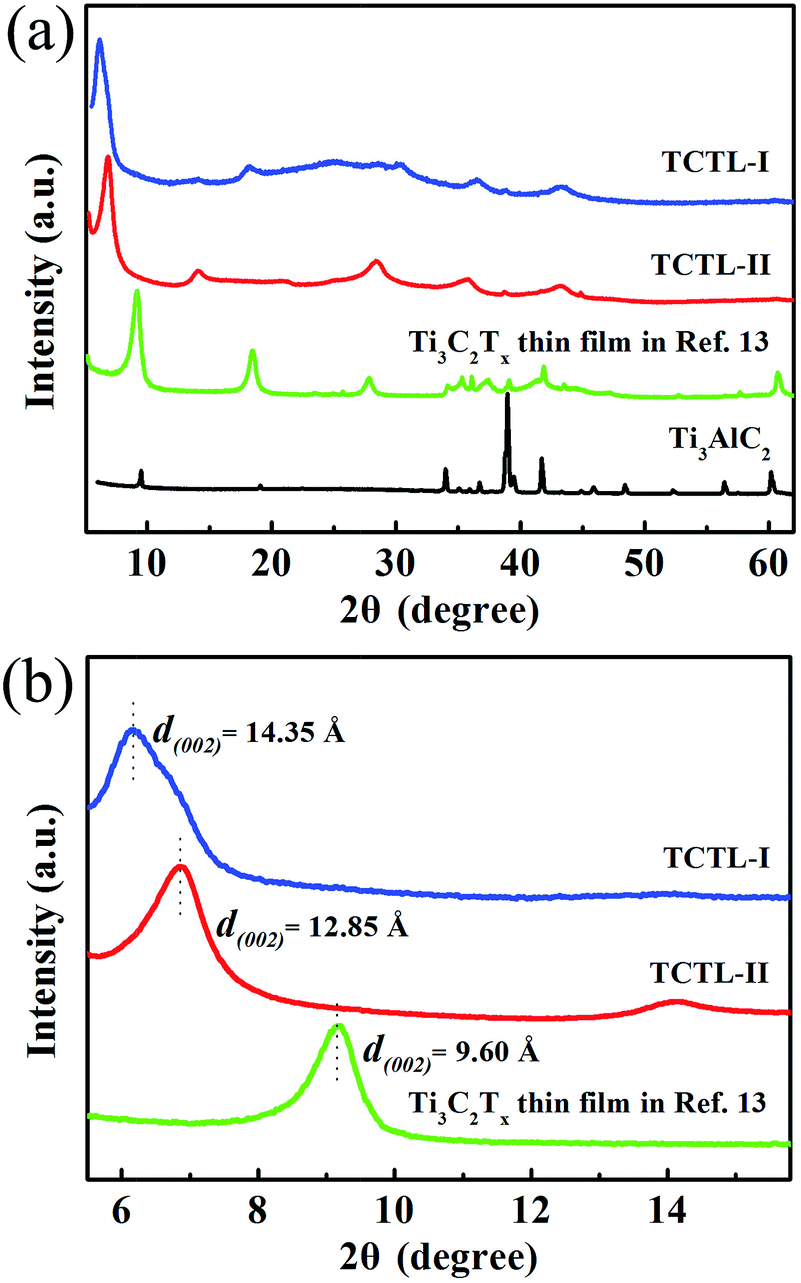 | ||
| Fig. 2 (a) XRD patterns of the TCTL-I, TCTL-II, the previous Ti3C2Tx thin film in ref. 13, and Ti3AlC2 powder and (b) the corresponding enlarged XRD patterns. | ||
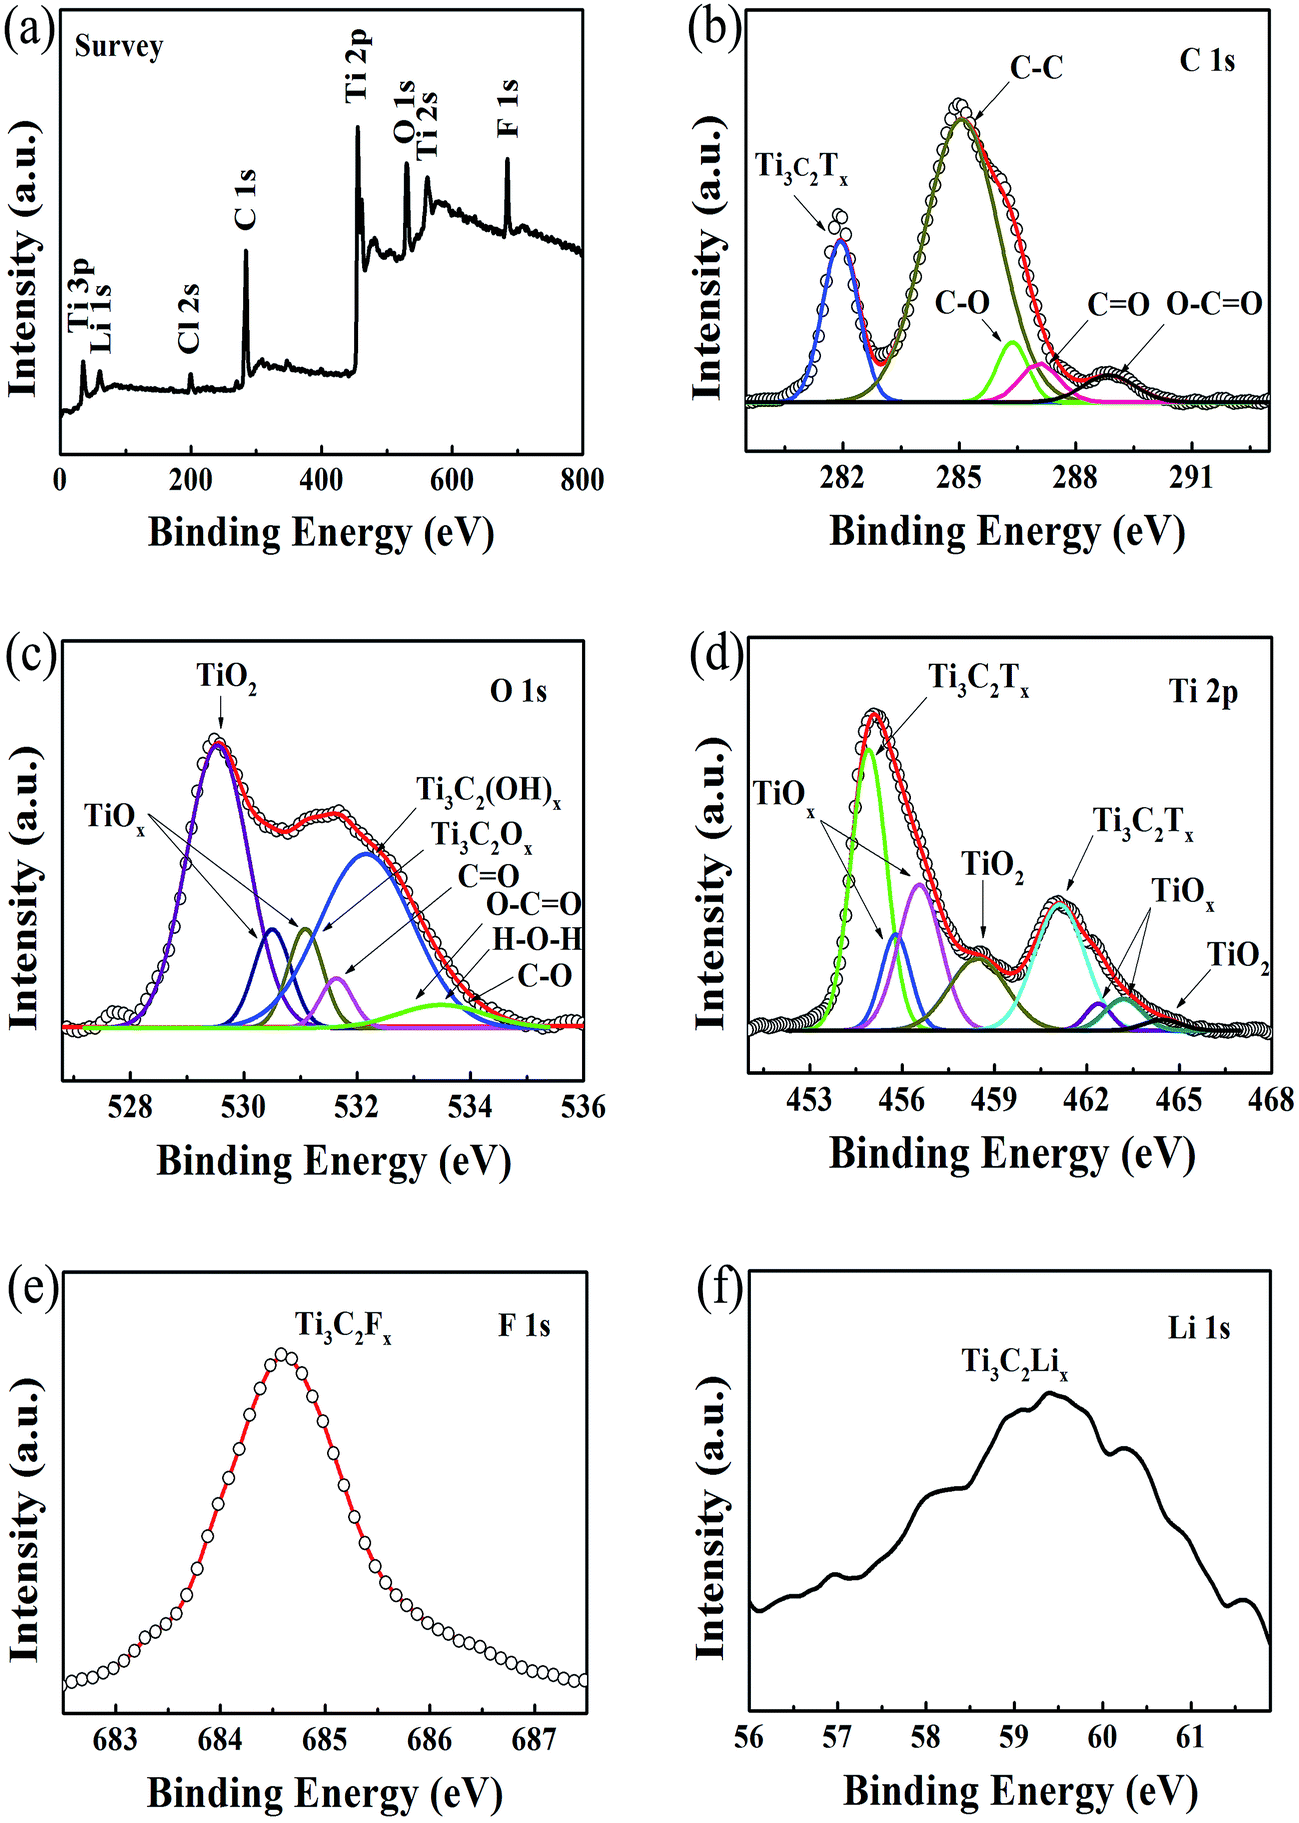 | ||
| Fig. 3 (a) XPS survey spectra of the TCTL-II sample. (b–f) High-resolution XPS spectra of C 1s, O 1s, Ti 2p, F 1s, and Li 1s, respectively. | ||
In order to explain our data gathered, we propose a structure model for the Ti3C2Tx-Li and its structural formation mechanism as follows: schematic diagram of the structural formation mechanism for the TCTL-II obtained via the LiF + HCl treatment is illustrated in Fig. 4. Fig. 4a shows the atom arrangement for Ti3AlC2 crystal structure. Three layers of Li+ ions and some H2O molecules can be intercalated into the interlayer space of the Ti3C2Tx-Li structure (Fig. 4b) except the surface termination when the Ti3C2Tx-Li sheets are produced. As is well known, the radii of Li+ ion and H2O molecule are 0.76 and 2.8 Å,17 respectively. The difference of about 4.75 Å in the interlayer spacing (d = Δc/2) between the TCTL-I and Ti3C2Tx thin films is approximately equal to the three layers of Li+ ions thick, indicating that the interlayer space can be intercalated by three layers of Li+ ions or one layer of H2O molecule, as shown in Fig. 4b. However, the H2O molecules will be gradually removed from the free-standing paper when it is stored in air. Then, Li+ ions, especially those located in the middle layer, will occupy the vacancies resulted from the de-intercalation of H2O molecules, in terms of the principle of energy minimum, until Li+ ions in the middle layer completely occupy the vacancies (Fig. 4c). As a result, the difference of 3.25 Å in the interlayer spacing between the TCTL-II and Ti3C2Tx thin films nicely allows two layers Li+ ions to keep in the interlayer space by the electrostatically adsorbing on the surface planes (Fig. 4d), and of course, some H2O molecules can still exist within the interlayer space. It is worth noting that the interlayer spacing of 12.9 Å obtained in our experiment for the TCTL-II results from the intercalation of the two layers of Li+ ions. As shown in Fig. 4, the intercalated surface terminations of –F (–Cl), –O (–OH), and –Li during the synthesis process could been confirmed by the above XRD, TEM results, and XPS data. The presence of H2O in the interlayer space is possible based on the XRD data and XPS results. The intercalation of –Li could result in the further expansion of c-LP to 28.7 Å. Here the expanded interlayer spaces also facilitate the intercalation and/or de-intercalation of H2O. The subsequent de-intercalation of H2O results in the diffusion and redistribution of –Li and decreases the c-LP to about 25.7 Å.
 | ||
| Fig. 4 Schematic diagram of the structural formation mechanism for the Ti3C2Tx sample. The atomic structure was built along the [110] direction. Atomic arrangements of (a) the Ti3AlC2 structure, (b) the as-synthesized Ti3C2Tx-Li sheets, (c) storing in air for 50 days, and (d) one and two layers structures. | ||
To evaluate the electrochemical performance of the TCTL-II as electrode, two different TCTL-II electrodes taken from the same paper were characterized in the 1 M H2SO4 aqueous electrolyte, respectively, using a conventional three-electrode configuration, a carbon rod as the counter electrode, and an Ag/AgCl electrode as the reference electrode. The mass loading of the TCTL-II is about 4.6 g cm−3. Fig. 5a shows the typical cyclic voltammetry (CV) curve of one of two TCTL-II electrodes at a scan rate of 2 mV s−1. From Fig. 5a, the large slopes (ΔI/ΔV) at the onset and end of the potential windows indicate that the TCTL-II electrode has faster charging and discharging response to the applied potential. The CV curve (Fig. S6†) obtained from the other sample has the similar profile at a scan rate of 2 mV s−1. Fig. 5b shows the CV plots at different scan rates. At the scan rates below 20 mV s−1, the CV curves do not show significant changes. However, the irregular shape appears at high scan rates due to the polarization resistance. This distortion increases with the scan rate probably due to the moderate H+ ion intercalating and de-intercalating rates in the TCTL-II. The volumetric capacitance calculated from CV curves at different scan rates is shown in Fig. 5c. When calculated based on the volume of the whole paper electrode, a volumetric capacitance of 892 F cm−3 is achieved at the scan rate of 2 mV s−1 and about 411 F cm−3 at 100 mV s−1 for the TCTL-II electrode with an average thickness of 8.8 μm, which is comparable to the highest value reported previously for 2D Ti3C2Tx clay and much larger than any other C-based materials (Table 1), indicating that the volumetric capacitance of the free-standing Ti3C2Tx paper electrode can be significantly improved by rational design and suitable synthesis procedure. The ultrahigh capacitance of the TCTL-II electrodes further confirms its optimized structure, which synergizes the effects of both effective synthesis procedure and fast ion intercalation and/or de-intercalation as well as charge transfer, thus enabling high and reversible capacitive behavior. The galvanostatic charge–discharge (GCD) curves (Fig. S7†) of the TCTL-II electrode at various current densities show the nearly triangular shape, confirming the high reversibility of the redox reactions of the tested electrode. In consideration of the long-term stability being an important requirement for the practical applications, the capacitance retention test was conducted. Fig. 5d presents the cycling stability of the TCTL-II electrode at a current density of 5 A g−1, showing the new electrode also exhibits excellent cyclic stability with almost no capacitance loss after 10000 cycles. The black and red GCD voltage profiles of the TCTL-II electrode shown in the inset of the Fig. 5d represent the first five cycles and the last five cycles, respectively. They all show a similar shape. More interestingly, the discharge time for the last five cycles is longer than that for the first five cycles, indicating the much more excellent long-term cycling stability of the paper electrode compared to transition metal oxide electrodes, such as the MnO2/H-TiO2 composite electrodes (90% after 5000 cycles at a current density of 10 A g−1)36 and the MnO2/graphitic petal/C nanotube electrodes (90% after 1000 cycles at a scan rate of 100 mV s−1).37 Furthermore, the electrochemical impedance spectroscopy (EIS) spectrum is shown in Fig. S8† and gives the small value of 0.82 Ω as the equivalent series resistance of the electrode material.
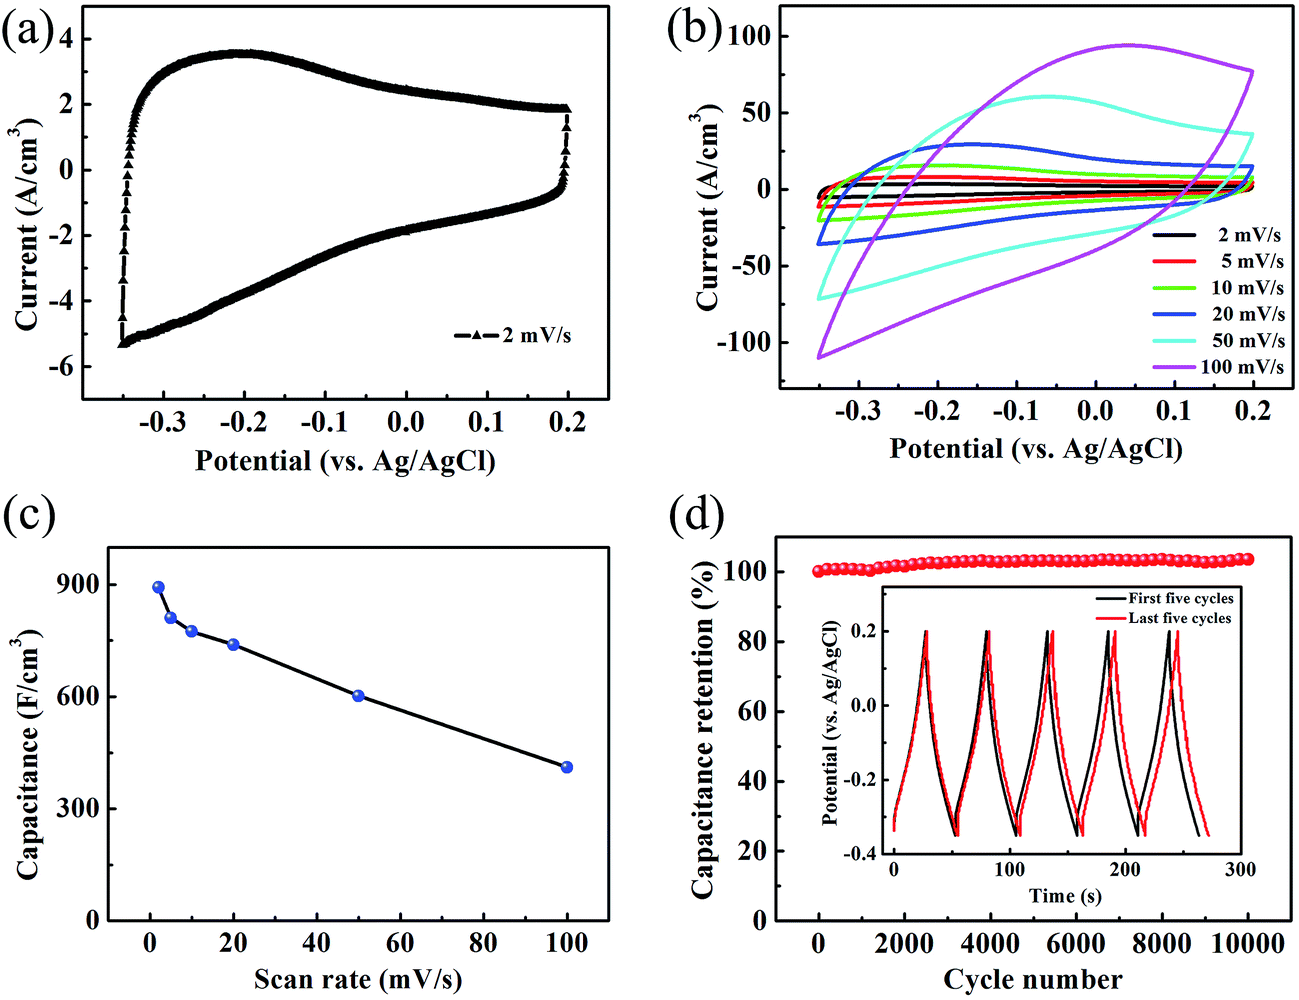 | ||
| Fig. 5 The results of TCTL-II (a) at a scan rate of 2 mV s−1, and (b) at different scan rates. (c) Volumetric capacitance as a function of scan rate. (d) The cycling performance of the TCTL-II electrode at a current density of 5 A g−1. The black and red GCD voltage profiles of the TCTL-II electrode shown in the inset represent the first five cycles and the last five cycles, respectively. | ||
| Electrode | Electrolyte | Capacitance (F cm−3) | Scan rate or current density | Ref. |
|---|---|---|---|---|
| Ti3C2Tx-Li | 1 M H2SO4 | 892 | 2 mV s−1 | This work |
| Ti3C2Tx “clay” | 1 M H2SO4 | 900 | 2 mV s−1 | 19 |
| Ti3C2Tx/SWCNT | 1 M MgSO4 | 390 | 2 mV s−1 | 29 |
| Ti3C2Tx/OLG | 1 M MgSO4 | 435 | 2 mV s−1 | 29 |
| Ti3C2Tx/PDDA | 1 M KOH | 296 | 2 mV s−1 | 30 |
| Ti3C2Tx/PVA | 1 M KOH | 528 | 2 mV s−1 | 30 |
| PANI-CCG | 1 M H2SO4 | 572 | 5 A g−1 | 5 |
| Doped carbon | 1 M H2SO4 | 521 | 0.2 A g−1 | 10 |
| Gold/MnO2 | 2 M Li2SO4 | 1160 | 50 mV s−1 | 31 |
| Ti3C2Tx/ppy | 1 M H2SO4 | 1000 | 5 mV s−1 | 24 |
| LSG-MnO2 | 1 M Na2SO4 | 1136 | 1 mV s−1 | 32 |
| Mo2CTx | 1 M H2SO4 | 700 | 2 mV s−1 | 17 |
| CNT/OA-Fe3O4 | 0.1 M Na2SO3 | 248 ± 15 | 5 mV s−1 | 33 |
| γ-Fe2O3 | 6 M KOH | 230 | 0.2 A g−1 | 34 |
| CDC | 1.5 M TEABF4/ACN | 180 | 20 mV s−1 | 35 |
It is interesting to speculate on why the ultrahigh volumetric capacitance and excellent cyclic stabilities of the Ti3C2Tx-Li paper electrode could be obtained. There are four main reasons: (i) the suitable synthesis and delamination routes can significantly enhance electrochemical performance of MXenes; (ii) the highly conductive Ti3C2Tx-Li paper acts as the host, which could effectively shorten the H+ diffusion pathway and facilitate electron transfer. Ti3C2Tx-Li paper also works as a cushion to buffer the huge volume change during charging/discharging; (iii) a comparative study (Fig. S9†) indicates the use of LiCl aqueous solution could benefit the increase of the c-LP for the Ti3C2Tx-Li paper electrode. An enough space between the two layers facilitates the fast intercalation and/or de-intercalation of the H+ in the Ti3C2Tx-Li structure; (iv) Ti3C2Tx itself is of the pseudocapacitive nature in an acidic electrolyte, and the nanosheet displays its ultrathin feature.26,27
Conclusions
In summary, the flexible, free-standing, additive-free, and highly conductive Ti3C2Tx-Li paper electrode was rationally designed and prepared by an effective method. In order to generate a large interlayer spacing and improve the electrode material utilization, it is necessary that the suspension is immersed in LiCl solution. The Ti3C2Tx-Li paper electrode achieves ultrahigh volumetric capacitance of 892 F cm−3 and has long-term cyclic stability. This work will provide insight to rationally design and develop the negative electrode materials for high-performance SCs.Experimental section
The Ti3C2Tx-Li sheets were produced by etching Al from Ti3AlC2 powder bought from Forsman Scientific (Beijing) Co., Ltd. 1.56 g LiF was added into 20 mL HCl aqueous solution (12 M). The mixture was stirred for 8 min with a Teflon magnetic stir bar to dissolve the LiF salt. 1 g Ti3AlC2 was slowly added to the as-prepared mixed aqueous solution. In order to avoid initial overheating of the aqueous solution due to the exothermic reaction, the ice water was used during the reaction process. The reaction mixture was then kept at 40 °C for 24 h. The resulting mixture was centrifuged at 8000 rpm for 5 min, and the supernatant was immediately poured out. Subsequently, it was immersed into 1 M LiCl aqueous solution after the mixture was washed with 1 M HCl aqueous solution a few times. Afterwards, the resultant mixture was washed with deionized water several times. In order to obtain Ti3C2Tx-Li atomically thin sheets, 35 mL of deionized water, which has been deaerated by argon, was added into the sediment and hand-shaked for 10 min before centrifuging at 5000 rpm for 1 h. The formed colloidal suspension was filtered on a polypropylene separator membrane (50 mm diameter, 0.2 μm pore size) to form a flexible, freestanding Ti3C2Tx-Li paper. The morphologies and microstructures of the sheets were characterized by scan electron microscopy (SEM, SU70, Hitachi, Japan) equipped with an energy dispersive X-ray spectroscopy (EDX), and transmission electron microscopy (TEM, FEI, Tecnai TF20), respectively. The crystal structure of the paper was characterized by X-ray diffraction (XRD, D/max2600, Rigaku, Japan) using the Cu Kα radiation (λ = 1.5418 Å). The X-ray photoelectron spectroscopy (XPS) measurements were performed on a Thermofisher K-Alpha X-ray spectrometer with Al source, and Raman spectra were measured by Micro-Raman spectrometer (J-Y; HR800, France) under excitation wavelength of 488 nm.Electrochemical measurements were performed using an electrochemical workstation (VMP3, France) with a standard three electrode electrochemical configuration. The carbon rod and Ag/AgCl were used as the counter electrode and the reference electrode, respectively. 1 M H2SO4 aqueous solution was used as electrolyte. The cyclic voltammetry (CV) and galvanostatic charge–discharge (GCD) measurements were conducted in the voltage range of −0.35–0.2 V. The galvanostatic cycling was performed at a current density of 5 A g−1. The electrochemical impedance spectroscopy (EIS) measurement was performed in a frequency range from 10 mHz to 200 kHz. The volumetric capacitance was calculated from CV curves by the following equation:  , where Cv is volumetric capacitance, j is volumetric current density, s is scan rate, U is voltage, and ΔU is voltage window.
Acknowledgements
This work was partly supported by the Natural Science Foundation of China (No. 51472066).References
- F. W. Li, J. T. Chen, X. S. Wang, M. Q. Xue and G. F. Chen, Adv. Funct. Mater., 2015, 25, 4601 CrossRef CAS.
- M. R. Lukatskaya, O. Mashtalir, C. E. Ren, Y. Dall'Agnese, P. Rozier, P. L. Taberna, M. Naguib, P. Simon, M. W. Barsoum and Y. Gogotsi, Science, 2013, 341, 1502 CrossRef CAS PubMed.
- H. X. Chuo, H. Gao, Q. Yang, N. Zhang, W. B. Bu and X. T. Zhang, J. Mater. Chem. A, 2014, 2, 20462 CAS.
- S. J. Peng, L. L. Li, H. T. Tan, R. Cai, W. H. Shi, C. C. Li, S. G. Mhaisalkar, M. Srinivasan, S. Ramakrishna and Q. Y. Yan, Adv. Funct. Mater., 2014, 24, 2155 CrossRef CAS.
- Y. F. Wang, X. W. Yang, A. G. Pandolfo, J. Ding and D. Li, Adv. Energy Mater., 2016, 6, 1600185 CrossRef.
- Y. Bai, Z. Wang, C. Wu, R. Xu, F. Wu, Y. C. Liu, H. Li, Y. Li, J. Lu and K. Amine, ACS Appl. Mater. Interfaces, 2015, 7, 5598 CAS.
- J. Chmiola, C. Largeot, P. L. Taberna, P. Simon and Y. Gogotsi, Science, 2010, 328, 480 CrossRef CAS PubMed.
- Y. Yan, Y. X. Yin, Y. G. Guo and L. J. Wan, Adv. Energy Mater., 2014, 4, 1301584 CrossRef.
- D. Yu, K. Goh, H. Wang, L. Wei, W. Jiang, Q. Zhang, L. Dai and Y. Chen, Nat. Nanotechnol., 2014, 9, 555 CrossRef CAS PubMed.
- J. S. Zhou, J. Lian, L. Hou, J. C. Zhang, H. Y. Gou, M. R. Xia, Y. F. Zhao, T. A. Strobel, L. Tao and F. M. Gao, Nat. Commun., 2015, 6, 8503 CrossRef CAS PubMed.
- S. Murali, N. Quarles, L. L. Zhang, J. R. Potts, Z. Q. Tan, Y. L. Lu, Y. W. Zhu and R. S. Ruoff, Nano Energy, 2013, 2, 764 CrossRef CAS.
- J. Luo, X. Tao, J. Zhang, Y. Xia, H. Huang, L. Zhang, Y. Gan, C. Liang and W. Zhang, ACS Nano, 2016, 10, 2491 CrossRef CAS PubMed.
- S. Y. Lin and X. T. Zhang, J. Power Sources, 2015, 294, 354 CrossRef CAS.
- Q. Tang, Z. Zhou and P. W. Shen, J. Am. Chem. Soc., 2012, 134, 16909 CrossRef CAS PubMed.
- C. Eames and M. S. Islam, J. Am. Chem. Soc., 2014, 136, 16270 CrossRef CAS PubMed.
- O. Mashtalir, M. Naguib, V. N. Mochalin, Y. Dall'Agnese, M. Heon, M. W. Barsoum and Y. Gogotsi, Nat. Commun., 2013, 4, 1716 CrossRef PubMed.
- J. Halim, S. Kota, M. R. Lukatskaya, M. Naguib, M. Q. Zhao, E. J. Moon, J. Pitock, J. Nanda, S. J. May and Y. Gogotsi, Adv. Funct. Mater., 2016, 26, 3118 CrossRef CAS.
- J. Halim, M. R. Lukatskaya, K. M. Cook, J. Lu, C. R. Smith, L. A. Näslund, S. J. May, L. Hultman, Y. Gogotsi, P. Eklund and M. W. Barsoum, Chem. Mater., 2014, 26, 2374 CrossRef CAS PubMed.
- M. Ghidiu, M. R. Lukatskaya, M. Q. Zhao, Y. Gogotsi and M. W. Barsoum, Nature, 2014, 516, 78 CAS.
- B. Ahmed, D. H. Anjum, M. N. Hedhili, Y. Gogotsi and H. N. Alshareef, Nanoscale, 2016, 8, 7580 RSC.
- A. Byeon, A. M. Glushenkov, B. Anasori, P. Urbankowski, J. Li, B. W. Byles, B. Blake, K. L. Van Aken, S. Kota, E. Pomerantseva, J. W. Lee, Y. Chen and Y. Gogotsi, J. Power Sources, 2016, 326, 686 CrossRef CAS.
- M. Ghidiu, M. Naguib, C. Shi, O. Mashtalir, L. M. Pan, B. Zhang, J. Yang, Y. Gogotsi, S. J. L. Billinge and M. W. Barsoum, Chem. Commun., 2014, 50, 9517 RSC.
- A. N. Enyashin and A. L. Ivanovskii, Comput. Theor. Chem., 2012, 989, 27 CrossRef CAS.
- J. Come, Y. Xie, M. Naguib, S. Jesse, S. V. Kalinin, Y. Gogotsi, P. R. C. Kent and N. Balke, Adv. Energy Mater., 2016, 6, 1502290 CrossRef.
- M. Boota, B. Anasori, C. Voigt, M. Q. Zhao, M. W. Barsoum and Y. Gogotsi, Adv. Mater., 2016, 28, 1517 CrossRef CAS PubMed.
- M. R. Lukatskaya, S. M. Bak, X. Q. Yu, X. Q. Yang, M. W. Barsoum and Y. Gogotsi, Adv. Energy Mater., 2015, 5, 1500589 CrossRef.
- M. M. Hu, Z. J. Li, T. Hu, S. H. Zhu, C. Zhang and X. H. Wang, ACS Nano, 2016, 10, 11344 CrossRef CAS PubMed.
- M. R. Lukatskaya, J. Halim, B. Dyatkin, M. Naguib, Y. S. Buranova, M. W. Barsoum and Y. Gogotsi, Angew. Chem., Int. Ed., 2014, 53, 4877 CrossRef CAS PubMed.
- M. Q. Zhao, C. E. Ren, Z. Ling, M. R. Lukatskaya, C. F. Zhang, K. L. Van Aken, M. W. Barsoum and Y. Gogotsi, Adv. Mater., 2015, 27, 339 CrossRef CAS PubMed.
- Z. Ling, C. E. Ren, M. Q. Zhao, J. Yang, J. M. Giammarco, J. Qiu, M. W. Barsoum and Y. Gogotsi, Proc. Natl. Acad. Sci. U. S. A., 2014, 111, 16676 CrossRef CAS PubMed.
- X. Y. Lang, A. Hirata, T. Fujita and M. Chen, Nat. Nanotechnol., 2011, 6, 232 CrossRef CAS PubMed.
- M. F. El-Kady, M. Ihns, M. Li, J. Y. Hwang, M. F. Mousavi, L. Chaney, A. T. Lech and R. B. Kaner, Proc. Natl. Acad. Sci. U. S. A., 2015, 112, 4233 CrossRef CAS PubMed.
- Y. M. Ko, D. Shin, B. Koo, S. W. Lee, W. S. Yoon and J. H. Cho, Nano Energy, 2015, 12, 612 CrossRef CAS.
- H. T. Zhang, X. Zhang, H. Lin, K. Wang, X. Z. Sun, N. S. Xu, C. Li and Y. W. Ma, Electrochim. Acta, 2015, 156, 70 CrossRef CAS.
- M. Heon, S. Lofland, J. Applegate, R. Nolte, E. Cortes, J. D. Hettinger, P. L. Taberna, P. Simon, P. H. Huang, M. Brunet and Y. Gogotsi, Energy Environ. Sci., 2011, 4, 135 CAS.
- X. Y. Cao, X. Xing, N. Zhang, H. Gao, M. Y. Zhang, Y. C. Shang and X. T. Zhang, J. Mater. Chem. A, 2015, 3, 3785 CAS.
- G. P. Xiong, K. P. S. S. Hembram, R. G. Reifenberger and T. S. Fisher, J. Power Sources, 2013, 227, 254 CrossRef CAS.
Footnote |
| † Electronic supplementary information (ESI) available. See DOI: 10.1039/c7ra00126f |
| This journal is © The Royal Society of Chemistry 2017 |