 Open Access Article
Creative Commons Attribution 3.0 Unported Licence
A Pd nanocatalyst supported on multifaceted mesoporous silica with enhanced activity and stability for glycerol electrooxidation†
Thiago S. D. Almeidaa,
Katia-Emiko Guimaa,
Roberto M. Silveirabc,
Gabriel C. da Silvad,
Marco A. U. Martinesb and
Cauê A. Martins *a
*a
aFaculty of Exact Sciences and Technology, Universidade Federal da Grande Dourados, 79804-970 Dourados, MS, Brazil. E-mail: cauemartins@ufgd.edu.br
bInstitute of Chemistry, Universidade Federal de Mato Grosso do Sul, C.P. 549, 79070-900 Campo Grande, MS, Brazil
cInstituto Federal de Educação, Ciência e Tecnologia de Mato Grosso do Sul – Campus Ponta Porã, C.P. 79900-000 Ponta Porã, MS, Brazil
dInstituto de Química de São Carlos, Universidade de São Paulo, IQSC-USP, C.P. 780, São Carlos, SP, Brazil
First published on 20th February 2017
Abstract
Glycerol is massively produced as a byproduct of biodiesel manufacturing, which decreases its price and increases its inadequate disposal. The use of glycerol to feed anodes of alkaline fuel cells and electrolysers has emerged as potential alternatives for its use. However, the activity and stability of commercial Pd/C nanoparticles currently proposed do not reach the required performance. Here, we propose a new Pd catalyst deposited in mesoporous silica (SiO2) with enhanced activity and stability for glycerol electrooxidation in alkaline media. We synthesized well-ordered mesoporous silica with pores in the form of a fountain pen and lm![[3 with combining macron]](https://www.rsc.org/images/entities/char_0033_0304.gif) m symmetry, in a cage-like arrangement. Such a structure was proved by experiments of microscopy, X-ray diffraction, N2 isotherms and small-angle X-ray scattering measured in synchrotron light. Next, we produced patterned Pd/SiO2 in a one-step synthesis and ordered Pd after template removal. The Pd catalysts were characterized by microscopy, dispersive X-ray spectrometry and X-ray diffraction. Pd/SiO2 and Pd showed improved current density and stability compared to Pd/C. The current density of Pd/SiO2 reached twice the values found for Pd/C. The enhancement is understood as a multiple role of the mesoporous silica support, which works as a seed mediator to order the Pd nanoparticles and mainly as a trap that confines the reactant inside the mesoporous structure, increasing the frequency of collision with active Pd sites. Furthermore, we showed that no carbonyl or intact glycerol was found on Pd/SiO2 after exhaustive cycles of use, except for adsorbed CO that was quickly removed from the surface, which is a probable reason for an improved pathway of glycerol electrooxidation via CO.
m symmetry, in a cage-like arrangement. Such a structure was proved by experiments of microscopy, X-ray diffraction, N2 isotherms and small-angle X-ray scattering measured in synchrotron light. Next, we produced patterned Pd/SiO2 in a one-step synthesis and ordered Pd after template removal. The Pd catalysts were characterized by microscopy, dispersive X-ray spectrometry and X-ray diffraction. Pd/SiO2 and Pd showed improved current density and stability compared to Pd/C. The current density of Pd/SiO2 reached twice the values found for Pd/C. The enhancement is understood as a multiple role of the mesoporous silica support, which works as a seed mediator to order the Pd nanoparticles and mainly as a trap that confines the reactant inside the mesoporous structure, increasing the frequency of collision with active Pd sites. Furthermore, we showed that no carbonyl or intact glycerol was found on Pd/SiO2 after exhaustive cycles of use, except for adsorbed CO that was quickly removed from the surface, which is a probable reason for an improved pathway of glycerol electrooxidation via CO.
Introduction
Biodiesel fabrication by the transesterification of vegetable oil or fat produces glycerol as 10 wt%. Thus, a high amount of glycerol has been generated as a byproduct, leading to a decay in price and increasing the risk of its inadequate disposal. In this context, the glycerol electrooxidation reaction (GEOR) has been investigated as a potential fuel for direct alcohol fuel cells (DAFC) since the three-hydrated carbon can be converted into CO2.1 On the other hand, its total electrooxidation is circumvented due to partial electrooxidation in parallel reactions to form carbonyl compounds2 on carbon-supported Pt nanoparticle (NP) catalysts.3 This apparent disadvantage is in fact an opportunity to produce highly valuable compounds from glycerol.4–7Pd-based nanocatalysts have been recently used to improve the catalytic properties of GEOR in alkaline media.8–13 Some works show the influence of multimetallic Pd-based NPs immobilized on a carbon support on GEOR.11,13 Although most of the thermodynamics and kinetics of the surface reaction are a function of the physical–chemical characteristics of the metallic catalysts, the NP supports play a central role in their stability. It is well known that the commercial amorphous carbon supports used in fuel cells do not present adequate stability for the long term.14 Thus, new supports for Pd NPs capable of maintaining the activity of the catalysts for long periods of operation are imperative to make glycerol fuel cells (and electrolysers) feasible. Su et al. used Pd/TiO2 nanofibres to improve GEOR besides other small-chain alcohol electrooxidation reactions.12 Zalineeva et al. used a self-supported porous PdBi catalyst for GEOR in an alkaline medium.9 The authors reported an outstanding improvement in current density and in electrochemical stability in terms of keeping the current density during long periods of potentiostatic experiments.9
Oxides such as SiO2 have emerged as powerful supports for metallic NPs since they combine qualities such as high durability15 and activity.16–18 SiO2 structures can be spatially controlled to generate highly oriented surfaces containing pores, which might work as cages to confine the reactants,19 improving the catalysis performance by increasing the collision frequency. Shim et al. synthesized bimetallic PtPd NPs well dispersed on the wall of mesoporous carbon/silica composites with enhanced activity for formic acid oxidation in terms of mass activity and onset potential.18 Melvin et al. synthesized hollow silica sphere supports for Pt NPs with high catalytic activity for methanol electrooxidation.16 Azizi et al., also working with methanol electrooxidation, found that Ni supported on mesoporous silica increases the output current density of the reaction in alkaline media, working as a Pt-free catalyst.17
The physical–chemical properties and spatially ordered structure of SiO2 increase its use in several kinds of energy technology20 and even in heterogeneous non-electrochemical catalysis.21,22 In this context, we synthesized ordered Pd nanostructures over highly ordered mesoporous silica and evaluated their activity and stability for GEOR in alkaline media.
Experimental
Synthesis of mesoporous lm![[3 with combining macron]](https://www.rsc.org/images/entities/h3_char_0033_0304.gif) m silica
m silica
The synthesis of mesoporous silica was carried out based on a previous report23 with modifications, which allowed the production of multifaceted lm![[3 with combining macron]](https://www.rsc.org/images/entities/char_0033_0304.gif) m silica. Firstly, we prepared a micellar solution and added the silica precursor for hydrolysis and the self-assembly procedure. For that, 1.5 g of Pluronic F-127 surfactant was dispersed in 100 mL of water at pH 1.5 (adjusted with 2.0 mol L−1 HCl) and stirred at room temperature to reach a homogeneous solution. Afterwards, 3.53 g of tetraethyl orthosilicate (TEOS) was added under vigorous stirring. The solution was kept static at room temperature for 12 h for the hydrolysis.
m silica. Firstly, we prepared a micellar solution and added the silica precursor for hydrolysis and the self-assembly procedure. For that, 1.5 g of Pluronic F-127 surfactant was dispersed in 100 mL of water at pH 1.5 (adjusted with 2.0 mol L−1 HCl) and stirred at room temperature to reach a homogeneous solution. Afterwards, 3.53 g of tetraethyl orthosilicate (TEOS) was added under vigorous stirring. The solution was kept static at room temperature for 12 h for the hydrolysis.
The second part of the synthesis consisted of the self-assembly procedure through condensation of the silica by adding 2.7 mL of 0.25 mol L−1 NaF and gently stirring in a thermostatic bath at 20 °C for 30 h. The precipitate was filtered and washed with water and ethanol. Next, the dispersion was dried in a chemical oven at 70 °C for 12 h, ground and finally calcined at 500 °C for 5 h, starting from room temperature and heating at a rate of 1 °C min−1. The final white powder was stored at room temperature to be used in the synthesis of the Pd-based catalysts.
Synthesis of Pd/SiO2 and Pd NPs based on templated multifaceted mesoporous lm![[3 with combining macron]](https://www.rsc.org/images/entities/h3_char_0033_0304.gif) m silica
m silica
Pd/SiO2 NPs were synthesized by chemical reduction as described elsewhere24 mediated by poly(acrylic acid sodium salt) (PAA). The metallic content was adjusted to 40% Pd on mesoporous silica. Briefly, adequate amounts of PdCl2 and mesoporous silica were mixed with a 3![[thin space (1/6-em)]](https://www.rsc.org/images/entities/char_2009.gif) :
:![[thin space (1/6-em)]](https://www.rsc.org/images/entities/char_2009.gif)
![[thin space (1/6-em)]](https://www.rsc.org/images/entities/char_2009.gif) 1 solution of ethylene glycol (EG)
1 solution of ethylene glycol (EG)![[thin space (1/6-em)]](https://www.rsc.org/images/entities/char_2009.gif) :
:![[thin space (1/6-em)]](https://www.rsc.org/images/entities/char_2009.gif)
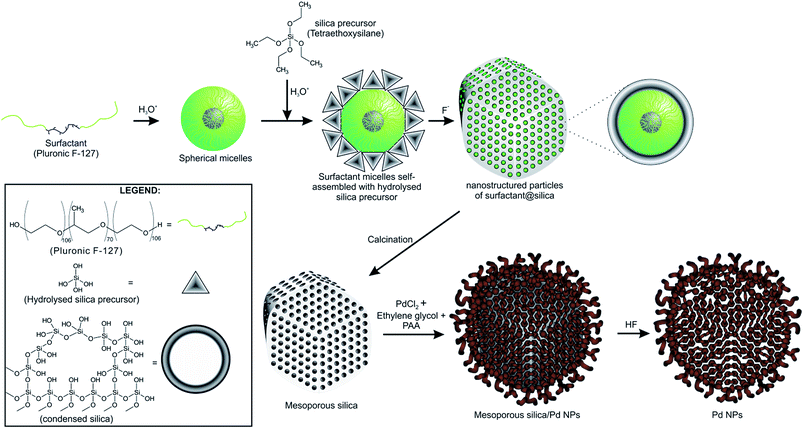
![[thin space (1/6-em)]](https://www.rsc.org/images/entities/char_2009.gif) water in an ultrasonic bath for 20 min. Next, PAA was added to obtain a monomer of PAA/Pd with an atom ratio of 3.0 and the mixture was sonicated for another 20 min. The reaction bath was kept in an oil bath at 140 °C for 7.5 h and it was cooled to room temperature to form a dispersion of NPs. The dispersion was washed with deionized water and centrifuged three times to eliminate synthesis residues and finally dried in oven at 60 °C for 24 h to obtain a powder of Pd/SiO2 NPs. Fig. 1 summarizes the synthesis of mesoporous silica and Pd/SiO2.
water in an ultrasonic bath for 20 min. Next, PAA was added to obtain a monomer of PAA/Pd with an atom ratio of 3.0 and the mixture was sonicated for another 20 min. The reaction bath was kept in an oil bath at 140 °C for 7.5 h and it was cooled to room temperature to form a dispersion of NPs. The dispersion was washed with deionized water and centrifuged three times to eliminate synthesis residues and finally dried in oven at 60 °C for 24 h to obtain a powder of Pd/SiO2 NPs. Fig. 1 summarizes the synthesis of mesoporous silica and Pd/SiO2.
Pd NPs were obtained by washing the Pd/SiO2 NPs with hydrofluoric acid, which was sonicated for 30 min and centrifuged at 6000 rpm three times. Such a procedure allows withdrawal of the mesoporous silica. Afterwards, the Pd dispersion was washed and centrifuged three times with deionized water and centrifuged at 6000 rpm. The Pd NPs dispersed in water were finally dried in an oven at 60 °C for 24 h. The catalytic performance of the synthesized Pd/SiO2 and Pd NPs was compared to commercial Pd/C.
Electrode preparation and electrochemical experiments
Dispersions of Pd/SiO2, Pd and Pd/C NPs were prepared by adding 1.0 mg of NP powder to 1.0 mL water. To prepare the electrodes, an aliquot of the dispersion was deposited onto a 0.2 cm2 glassy carbon (GC) electrode, in order to produce a catalytic surface with 225.0 μg cm−2 loading, taking into account the mass of Pd on the GC electrode. To prepare Pd/C electrodes, we followed the same protocol, adding 30 μL of diluted Nafion® (1 mL 5% Nafion® in 20 mL 2-propanol) to the NPs immobilized on GC. This last step was taken because Pd/C NPs do not adhere as strongly to GC as do the Pd/SiO2 and Pd NPs.The electrochemical measurements were performed in a conventional three-electrode cell in an N2-saturated 0.1 mol L−1 KOH solution. We used a μAutolab potentiostat/galvanostat with current integration. The modified GC was used as a working electrode. A high surface area Pt plate was used as the counter electrode and an Ag/AgCl electrode was used as reference. All potentials were rescaled to a reversible hydrogen electrode (RHE) scale. The current density (j) was calculated as the measured current divided by the electrochemically active surface area (ECSA), considering 420 μC cm−2 as the charge released by the desorption of a Pd oxide monolayer.25 All electrochemical experiments were carried out in triplicate at 25 °C.
Prior to immobilizing the NPs on GC and starting the measurements, we carefully followed an electrochemical protocol to assure reproducibility among the experiments. Briefly, the previously polished and cleaned GC electrode was submitted to three cycles of cyclic voltammetry between −1.0 and 0.3 V (vs. RHE) in 0.1 mol L−1 KOH at 0.05 V s−1. Afterwards, the GC was washed with deionized water and dried with N2 and the NPs were finally deposited.
The electrochemical profiles of the catalysts were registered between 0.0 and 1.3 V in an attempt to investigate the hydrogen region and to monitor the surface orientation of the catalyst.26,27 On the other hand, the glycerol electrooxidation (in 0.2 mol L−1 GlOH + 0.1 mol L−1 KOH) was performed between 0.57 and 1.3 V to avoid successively reaching potentials where hydrogen might absorb in the Pd crystalline net and destroy it accordingly when desorbed. Chronoamperometry experiments were performed by stepping the potential at 0.77 V for 1800 s in the presence of glycerol. The stability of the nanomaterials in an electrochemical environment was investigated by following the current density peak of glycerol electrooxidation during 100 cycles of cyclic voltammetry between 0.47 and 1.3 V at 0.05 V s−1.
Physical characterization of the materials
The physical–chemical structure of the silica was investigated by small-angle X-ray scattering (SAXS), scanning electron microscopy (SEM), transmission electron microscopy (TEM) and N2-adsorption isotherms through the Brunauer–Emmett–Teller (BET) method.The study of pore symmetry was evaluated by SAXS experiments, at line D11A-SAXS of the Brazilian Synchrotron Light Laboratory (LNLS) in Campinas, Brazil. The samples were prepared by filling a metallic ring with the samples and sealed with Kapton® tape. The line used was equipped with an asymmetric slit, monochromator of silicon (111), monochromatic beam (λ = 1.488 Å) and horizontal focus. Vertical and horizontal beam-stoppers were used to absorb direct and reflected X-rays, respectively. SAXS curves were analysed by calculating the values of scattering distances at planes (hkl), indicated as dhkl for each peak, using the equation dhkl = 2π/q, where q is the scattering vector.28 The value of dhkl for the most intense peak corresponds to the mean interplanar distance of pores (d-spacing). Pore symmetries and space groups were determined by calculating the d-spacing/dhkl ratios and comparing these values with the literature.23,29 The unit cell parameter, a0, was calculated by the expression  , as reported by Mesa et al.29
The shape and size of mesoporous silica were analysed by SEM at the Brazilian Nanotechnology Laboratory (LNNano) using a Jeol JSM-6330F microscope operating at 5 kV. The samples were metallized with gold, for 60 s with a current of 10 mA and vacuum of 2.0 × 10⁻⁴ atm.
The arrangement of internal mesopores in the silica samples was investigated by TEM in a Philips CM-30 microscope at the Centre d'Elaboration de Matériaux et d'Etudes Structurales (CEMES) in Toulouse, France. The samples were dispersed in ethanol, submitted to an ultrasonic bath for 5 min and deposited over a carbon-coated copper grid.
The BET method was employed to analyse the specific surface area (SBET) and mean pore diameter (Dp) by experiments of adsorption and desorption of N2 at a constant temperature of −196 °C (77 K).30 The samples were previously degassed at 150 °C (423 K) for 15 h and the experiments were carried using Micromeritics ASAP 2010 equipment. The wall thickness of pores, tw, was estimated by the equation  .29
.29
Pd/lm![[3 with combining macron]](https://www.rsc.org/images/entities/char_0033_0304.gif) m (Pd/SiO2), Pd NPs and commercial Pd/C were investigated through TEM images, dispersive X-ray spectrometry (EDS) and X-ray diffraction (XRD). The chemical composition of the catalysts was determined using a Leica-Zeiss LEO 440 scanning electron microscope at 20 kV connected to a Link Analytical QX2000 energy-dispersive X-ray spectrometer and an SiLi 77 K cooled detector. The morphologies and sizes of the Pd NPs were analysed using a TEM JEOL model JEM2100 with an LaB6 filament operating at 200 kV. All samples were dispersed in 2-propanol and deposited onto a 400-mesh copper grid. AxioVision SE64 Rel. 4.8 software was used to study the images. The crystallographic structures of the Pd catalysts were studied by XRD using a Bruker D2 PHASER powder diffractometer equipped with a monochromatic Cu source with λ = 1.54 Å. The scans were collected with a step size of 0.05° in the range 8–90° and an interval of 5 s between steps.
m (Pd/SiO2), Pd NPs and commercial Pd/C were investigated through TEM images, dispersive X-ray spectrometry (EDS) and X-ray diffraction (XRD). The chemical composition of the catalysts was determined using a Leica-Zeiss LEO 440 scanning electron microscope at 20 kV connected to a Link Analytical QX2000 energy-dispersive X-ray spectrometer and an SiLi 77 K cooled detector. The morphologies and sizes of the Pd NPs were analysed using a TEM JEOL model JEM2100 with an LaB6 filament operating at 200 kV. All samples were dispersed in 2-propanol and deposited onto a 400-mesh copper grid. AxioVision SE64 Rel. 4.8 software was used to study the images. The crystallographic structures of the Pd catalysts were studied by XRD using a Bruker D2 PHASER powder diffractometer equipped with a monochromatic Cu source with λ = 1.54 Å. The scans were collected with a step size of 0.05° in the range 8–90° and an interval of 5 s between steps.
Results
Physical–chemical characterization of the multifaceted mesoporous lm![[3 with combining macron]](https://www.rsc.org/images/entities/h3_char_0033_0304.gif) m silica
m silica
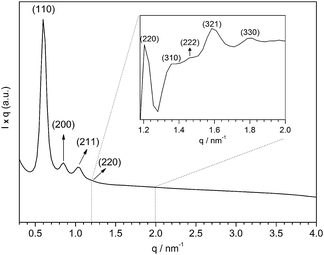
The structural properties of the multifaceted silica were deeply investigated before producing the Pd-based catalyst. Fig. 2 shows the SAXS curve of the synthesized silica. The SAXS profile suggests a highly patterned pore arrangement due to the presence of well-defined peaks, ascribed as X-ray scattering at the planes (110), (200), (211), (220), (310), (222), (321) and (330), characteristic of lm![[3 with combining macron]](https://www.rsc.org/images/entities/char_0033_0304.gif) m spatial groups.31
m spatial groups.31
The dhkl of the X-ray scattering listed in Table 1 are usually used to ascribe the symmetry of the porous arrangement and the spatial group, accordingly. Moreover, the ratio between d110 and the d-spacing provided a sequence of constants  , which corroborates the characteristics of lm
![[3 with combining macron]](https://www.rsc.org/images/entities/char_0033_0304.gif) m spatial groups.31
m spatial groups.31
![[3 with combining macron]](https://www.rsc.org/images/entities/char_0033_0304.gif) m silica obtained from SAXS
m silica obtained from SAXS
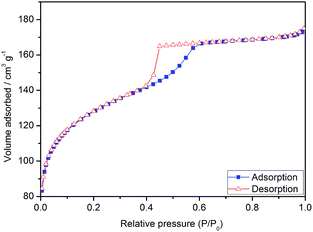
Fig. 3 shows N2-adsorption isotherms of the silica. The isotherms were classified as type IV, according to IUPAC recommendations,32 characteristic of mesoporous materials. We can note a hysteresis loop between the adsorption and desorption curves, characteristic of pores in the form of a fountain pen, as occurs in the cage-like arrangement of pores of a body-centred cubic (bcc) structure.33 This evidence is in line with the SAXS, corroborating the hypothesis of cubic lm![[3 with combining macron]](https://www.rsc.org/images/entities/char_0033_0304.gif) m symmetry of pores. The silica presented a narrow diameter distribution estimated from the N2-desorption isotherm, as shown in Fig. 4. This result proves the success of the synthesis of silica with uniformly sized pores.
m symmetry of pores. The silica presented a narrow diameter distribution estimated from the N2-desorption isotherm, as shown in Fig. 4. This result proves the success of the synthesis of silica with uniformly sized pores.
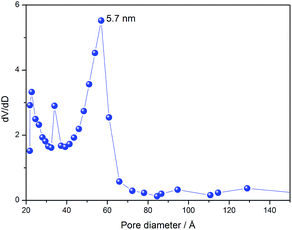 | ||
Fig. 4 Pore diameter distribution of multifaceted lm![[3 with combining macron]](https://www.rsc.org/images/entities/char_0033_0304.gif) m silica. Note: dV/dD is the derivative of desorbed N2 volume over pore diameter. m silica. Note: dV/dD is the derivative of desorbed N2 volume over pore diameter. | ||
Confronting SAXS with BET data, other structure parameters of the silica were estimated (Table 2). Despite the specific surface area, the parameters were very close with those described elsewhere,29 indicating similar structural features to mesoporous lm![[3 with combining macron]](https://www.rsc.org/images/entities/char_0033_0304.gif) m materials. The thickness of the silica walls (tw) and the interplanar distance of pores calculated from d110 were very similar to the literature, while the unit cell parameter (a0) and the mean pore diameter (Dp) were slightly smaller, which might be the reason for the difference between the SBET, as a result of the differences in the experimental procedures. Mesa et al. produced mesoporous silica in 5 days of aging at 95 °C,29 while our procedure only takes 30 h at 20 °C.
m materials. The thickness of the silica walls (tw) and the interplanar distance of pores calculated from d110 were very similar to the literature, while the unit cell parameter (a0) and the mean pore diameter (Dp) were slightly smaller, which might be the reason for the difference between the SBET, as a result of the differences in the experimental procedures. Mesa et al. produced mesoporous silica in 5 days of aging at 95 °C,29 while our procedure only takes 30 h at 20 °C.
![[3 with combining macron]](https://www.rsc.org/images/entities/char_0033_0304.gif) m silica obtained from N2 adsorption/desorption isothermsa
m silica obtained from N2 adsorption/desorption isothermsa
| SBET (m2 g−1) | Dp (nm) | a0 (nm) | d110 (nm) | tw (nm) |
|---|---|---|---|---|
| a SBET = specific surface area by the BET method; Dp = pore size by BET; a0 = unit cell parameter calculated from d-spacing; d110 = interplanar distance between pores; tw = wall thickness of pores.b Data from the literature.29 | ||||
| 446.0 | 5.7 | 15.0 | 10.6 | 7.3 |
| 908.0b | 6.0b | 15.9b | 10.7b | 7.8b |
SEM images revealed that the silica particles had a uniform size distribution, shown in Fig. 5a. The synthesized silica presented an average mean diameter of 0.93 ± 0.14 μm and a narrow size distribution, as shown in Fig. S1.† In Fig. 5b, we can identify some bigger particles, indicating formation of a neck between two of them. This neck formation phenomenon is intimately related with reactions at the solid–liquid interface, due to dissolution of small particles of early nucleation and reprecipitation over bigger particles, known as Ostwald ripening.34
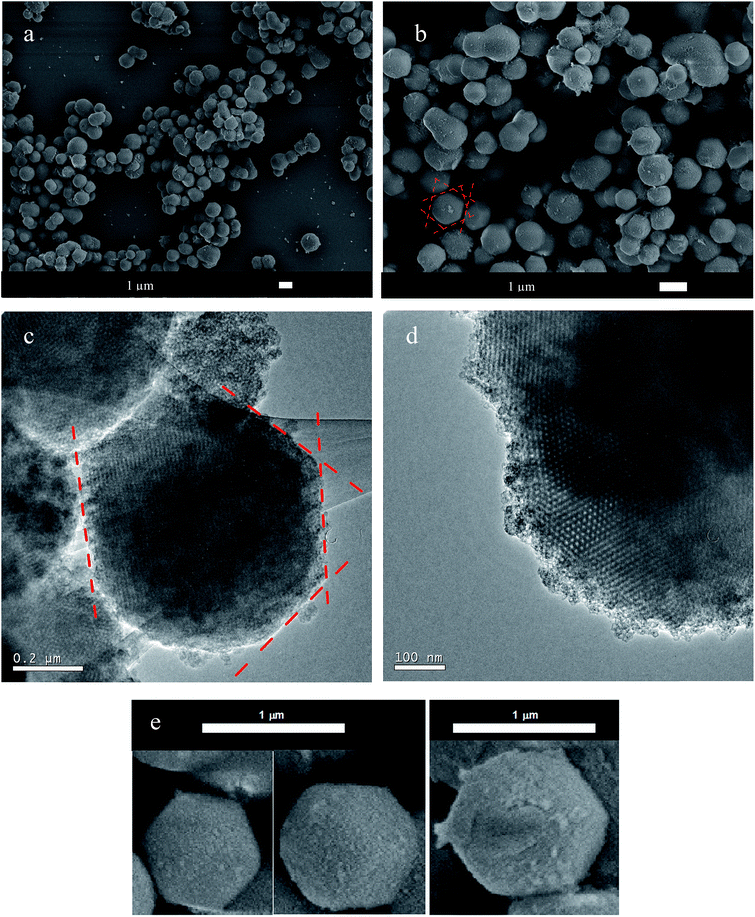 | ||
Fig. 5 Scanning electron micrographs (a, b and e) and transmission electron micrographs (c and d) of the multifaceted mesoporous lm![[3 with combining macron]](https://www.rsc.org/images/entities/char_0033_0304.gif) m silica. The dashed red lines highlight the oriented facets. m silica. The dashed red lines highlight the oriented facets. | ||
SEM images (Fig. 5b and e) clearly showed the pattern of the material, which contained preferentially oriented facets in a polyhedron with smooth corners. Fig. 5e shows some selected well-ordered particles. The TEM images shown in Fig. 5c and d for multifaceted particles confirmed a highly ordered pore network, as suggested by the SAXS measurements.
This set of results proves the success of the synthesis of multifaceted well-ordered mesoporous lm![[3 with combining macron]](https://www.rsc.org/images/entities/char_0033_0304.gif) m silica, which was used to produce patterned Pd NPs. The next section is devoted to the physical–chemical description of the Pd catalysts.
m silica, which was used to produce patterned Pd NPs. The next section is devoted to the physical–chemical description of the Pd catalysts.
Physical–chemical investigation of Pd/SiO2 and Pd NPs based on an lm![[3 with combining macron]](https://www.rsc.org/images/entities/h3_char_0033_0304.gif) m silica template
m silica template
The chemical composition of Pd/SiO2 and Pd NPs was investigated by EDS measurements, as shown in Fig. S2 and S3,† respectively. The acid treatment of Pd/SiO2 with HF solubilized the silica support, which was removed by washing and centrifuging with deionized water. Fig. S2† shows an intense Si signal and small signals for Pd, whereas the Si peak completely vanished in the EDS spectrum of Pd catalyst (Fig. S3†). This result proves the successful removal of the template from the metal catalyst. Moreover, we found by EDS that the metallic loading of Pd/SiO2 was 36 ± 2%, which is close to the nominal composition (40%).
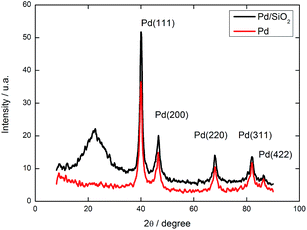
Fig. 6 shows the XRD patterns of Pd/SiO2 and Pd catalysts. Both catalysts showed peaks corresponding to Pd(111), Pd(200), Pd(220), Pd(311) and Pd(422) planes. The broad peak in the range of 2θ = 15–35° is ascribed as amorphous silica,21 which is absent after the removal of the silica (red line in Fig. 6). The most important feature is the high organization of the crystallites to form (111) planes, as depicted by the intense peak at 2θ = 40°. The ratio between the intensities of (111) and (200) peaks (I(111)/I(200)) of Pd/SiO2 was larger than the value for a conventional powder sample (2.81 versus 2.38 (ref. 35)), suggesting that the surface arrangements of Pd were primarily composed of (111). The I(111)/I(200) ratio decayed to 2.27 after the removal of the silica structure, suggesting a slight surface rearrangement, leading to an enrichment of (200) or a decrease of (111) defects.
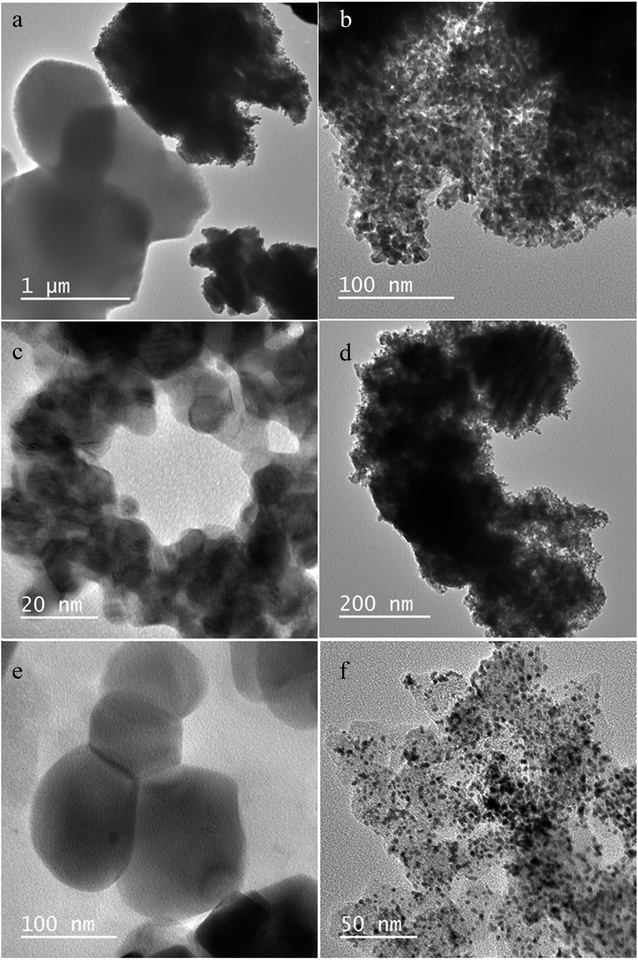
Fig. 7 illustrates the microscopy investigation of the synthesized catalysts. The Pd NPs grew on the surface of the silica particles. Fig. 7a is a representative image of the whole catalyst, where we can find silica particles covered by Pd NPs and some silica completely free of metal. This feature is rationalized as a consequence of seed-mediated growth, where a small cluster might work as a nucleation centre for clustering (NCC).14 Accordingly, the Pd NPs build small clusters, which work as surface defects until complete coverage, while pure silica particles remain free of NPs. Once part of the silica is completely covered by Pd (with coverage degree θPd = 1.0), the θPd keeps increasing and the multiple layers of Pd progress as dendrites, as a consequence of the porous orientation of the multifaceted mesoporous silica. The growth pattern can be seen in Fig. 7b. Furthermore, we found Pd dendrites among SiO2 particles, in which growth took place led by the surface of multiple silica particles.
The use of a weak reducing agent (EG) during the chemical reduction method assisted by PAA allied to the preferentially oriented lm![[3 with combining macron]](https://www.rsc.org/images/entities/char_0033_0304.gif) m silica allowed controlled growth of Pd NPs, yielding geometric organization such as dendritic shapes and a well-ordered atomic arrangement, evidenced in Fig. 7c. The NPs were grouped as clusters over the silica, thus we do not show any histogram of mean size distribution. However, we can clearly identify Pd NPs with sizes in the range of 5–15 nm. These Pd NPs showed fringes due to atomic level organization, resulting in the definition of atomic layers, as depicted in Fig. 7c. Such fringes are ascribed as partial orientation (111) defects, as suggested by the XRD patterns. Therefore, these results show that the Pd macro-orientation and the atomic level organization were induced through the shaped SiO2.
m silica allowed controlled growth of Pd NPs, yielding geometric organization such as dendritic shapes and a well-ordered atomic arrangement, evidenced in Fig. 7c. The NPs were grouped as clusters over the silica, thus we do not show any histogram of mean size distribution. However, we can clearly identify Pd NPs with sizes in the range of 5–15 nm. These Pd NPs showed fringes due to atomic level organization, resulting in the definition of atomic layers, as depicted in Fig. 7c. Such fringes are ascribed as partial orientation (111) defects, as suggested by the XRD patterns. Therefore, these results show that the Pd macro-orientation and the atomic level organization were induced through the shaped SiO2.
The spatial structures built through the Pd growth were kept after SiO2 removal, as shown in Fig. 7d. As a consequence, the Pd catalyst was constructed of several layers and pathways, producing microchannels in the form of a porous catalyst. We could find big particles with sizes close to the silica particles; however, the majority were smaller fragments as that showed in Fig. 7d. Fig. 7e shows some selected well-ordered Pd NPs. The use of an SiO2 template during the synthesis oriented the structure of Pd NPs to some extent but it is far from the level of preferential orientation reported by other groups.26,36,37 On the other hand, the presence of SiO2 in our one-step simple method organized the Pd NP structures leading to new and relevant catalytic properties, as presented in the next section.
The electroactivity of the synthesized nanomaterials was compared to commercial Pd/C, an image of which is shown in Fig. 7f. These NPs were well dispersed over amorphous carbon with an average size of 3 ± 0.3 nm and an approximately spherical shape. It is worth noticing that we found several carbon supports free of Pd NPs in the TEM images. Thus, considering the heterogeneity of Pd/SiO2, Pd and commercial NPs, we performed electrochemical experiments in triplicate and the results are shown as an average or representative.
Electroactivity of Pd/SiO2 and Pd NPs for glycerol electrooxidation
Electrochemical measurements performed in O2-free solution using highly pure reactants and clean electrochemical cells are well known as powerful tools for in situ surface characterization.38 We recorded the electrochemical profile of the catalysts in 0.1 mol L−1 KOH prior to their use in GEOR. Representative profiles are shown in Fig. 8. The formation of palladium oxides started at ∼0.67 V during the forward scan and were reduced during the backward scan, with a peak at 0.70 V for all catalysts (Fig. 8a and b). Hydrogen adsorbed on the Pd surface during the reverse scan and desorbed during the direct scan at a potential lower than 0.6 V, developing evident cathodic and anodic peaks, respectively. The profiles were similar to those described by Bolzán.39 Moreover, the average ECSAs of the catalysts prepared with the same loading were 8.3, 9.1 and 2.2 cm2 for Pd/SiO2, Pd and Pd/C, respectively. Hence, the use of mesoporous silica seems to facilitate the distribution of the Pd particles over the SiO2, which allied to the cleanness of the surface, enhance the ECSA. Additionally, the removal of SiO2 increases the ECSA, probably due to the clearance of active sites.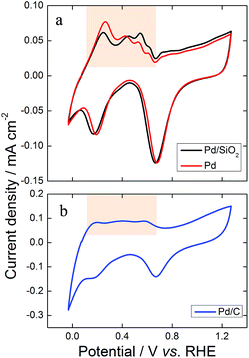 | ||
| Fig. 8 Illustrative cyclic voltammograms recorded in the presence of KOH 0.1 mol L−1 at 0.05 V s−1 in the range −0.03 to 1.27 V (vs. RHE) for (a) Pd/SiO2, Pd and (b) Pd/C nanoparticles. | ||
The hydrogen desorption region highlighted in Fig. 8 can be used to identify the preferential atomic orientation. Such regions were similar for Pd/SiO2 and Pd (Fig. 8a), which were completely different from Pd/C (Fig. 8b). The spherical and very small size of Pd/C maximizes the polycrystalline characteristics of the metallic catalyst. Otherwise, the ordered growth of Pd on SiO2 shown by the microscope images and the XRD patterns is confirmed by the electrochemical profiles through the well-defined hydrogen desorption peaks in Fig. 8a. Comparing the results in Fig. 8a with electrochemical features of Pd single crystals in an alkaline medium27 we could identify a relevant contribution of (111) planes on both synthesized materials, which is in line with the XRD patterns.
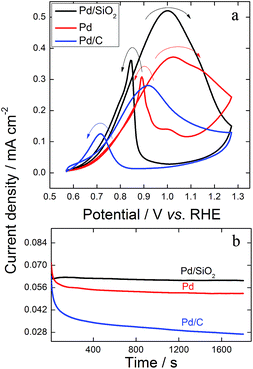
The electrocatalytic performance of Pd/SiO2 and Pd catalysts for GEOR in an alkaline medium was investigated by cyclic voltammetry and compared with that of commercial Pd/C. The potential range 0.57–1.27 V was chosen to avoid hydrogen absorption during the surface reaction, which might result in the degradation of the catalyst when desorbing. An oxidation peak appeared in the positive potential scan direction, starting at ∼0.6 V for all three catalysts (Fig. 9a). The onset potential provides thermodynamic information regarding the influence of the catalyst in the initiation of the surface reaction. Thus, we can conclude that SiO2 used as a support or template to Pd NPs does not change the onset potential significantly. In general, multimetallic catalysts are required to shift the onset potential towards negative values.9,13 In this context, the start potentials of the studied materials were in line with previous reports regarding GEOR in an alkaline medium catalysed by Pd.9,10,13 Worth to note that SiO2 solely does not show any catalytic property.
The potential range and the definition of the anodic current during GEOR are highly dependent on the atomic surface arrangement of the catalyst.40,41 Although the synthesized materials were ordered, the diffusional process of glycerol and of its partially oxidized compounds through the catalysts resulted in a complex and sequential surface reaction with enlargement of the anodic peak accordingly.42 Nevertheless, Pd/SiO2 and Pd showed an additional shoulder at 1.11 and 1.14 V, respectively. These features can be better seen through the first derivative of the voltammogram (dj/dE) in Fig. S4.† The additional shoulders in the forward potential scan are a consequence of the patterned Pd structures of both Pd/SiO2 and Pd catalysts. Here, we attributed the definition of peaks to the partially ordered surfaces, since GEOR on a single crystal would show single peaks instead of broad anodic transients, as found for Pt surfaces.40
Moreover, the backward scans of GEOR on the synthesized catalysts were sharper than those of Pd/C. Interestingly, the removal of the SiO2 resulted in a better definition of the shoulder during both forward and backward scans, the latter with an additional pre-peak. The reactivation ability for the reoxidation of intact glycerol or partially oxidized molecules inferred from the onset potential during the reverse scan followed the order Pd > Pd/SiO2 > Pd/C.
Regarding the catalytic effect in terms of output current, the current densities achieved using Pd/SiO2 were twice those found for commercial Pd/C. GEOR was also improved using Pd after removal of the silica, which generated 1.5 times more current density at the oxidation peak compared with Pd/C.
Potentiostatic chronoamperometry experiments are usually performed to make catalysts experience a scenario closer to a real single fuel cell and, occasionally, these measurements are also used to evaluate the stability of NPs for the production of an electrochemical current over time.43 The output pseudo-stationary output current densities resulting from 1800 s of polarization at 0.77 V in the presence of glycerol were 0.06, 0.05 and 0.025 mA cm−2 for Pd/SiO2, Pd and Pd/C, respectively (Fig. 9b). The catalytic effect of Pd/SiO2 enhanced GEOR by 2.4 times and twice by using Pd.
Therefore, the activity of the catalysts in terms of output current density and pseudo-stationary current density increased as follows: Pd/C < Pd < Pd/SiO2. These characteristics of GEOR on Pd/SiO2 and on Pd catalysts have some influence of their ordered surfaces containing (111) defects, as shown in previous reports concerning enhancement in the activity of an organic molecule led by a controlled (111) surface of NPs.26,44 However, the Pd/SiO2 architecture is the main responsible for the enhancement of GEOR. The mesoporous silica works as a cage, which confines intact glycerol and oxidized molecules so the reactants have an additional chance of colliding with active Pd sites when leaving the porous structure. After removing the SiO2, the current density decreased for Pd compared to Pd/SiO2 catalyst due to the diminishment of reactant confinement. Hence, the mesoporous lm![[3 with combining macron]](https://www.rsc.org/images/entities/char_0033_0304.gif) m silica synthesized for this study works with multiple functions, to build patterned Pd and to trap reactants. In this sense, Pd/SiO2 displayed the highest catalysis for GEOR.
m silica synthesized for this study works with multiple functions, to build patterned Pd and to trap reactants. In this sense, Pd/SiO2 displayed the highest catalysis for GEOR.
To understand, at least initially, how the porous clean structures of Pd/SiO2 and Pd change the pathways of GEOR with improved kinetics (higher current density), we performed exhaustive cyclic voltammetry in the presence of alcohol and right after we transferred the catalyst to a clean electrochemical cell containing only electrolyte. Fig. 10 shows the electrochemical profiles in electrolyte for three successive cycles after exhausting GEOR. Remarkably, the first cycles for Pd/SiO2 and Pd were precisely similar to stripping carbon monoxide (CO), where CO adsorbed to the surface is potentiodynamically removed to form CO2, producing a defined anodic peak.45 The first cycles in Fig. 10a and b showed profiles exactly as for CO stripping, with a hydrogen under potential deposition (HUPD) region hidden due to the presence of adsorbed CO, which was removed after its oxidation starting at 0.71 V. The HUPD region appeared in the second scans, proving that the CO monolayer was completely removed. Finally, the third scans matched exactly with the second ones, suggesting that there were no organic molecules on the catalytic surface. Otherwise, the anodic peak presented in the first cycle of GEOR on Pd/C persisted for the following cycles (Fig. 10c). Additionally, an anodic current appeared during the backward scan as a consequence of surface reactivation.
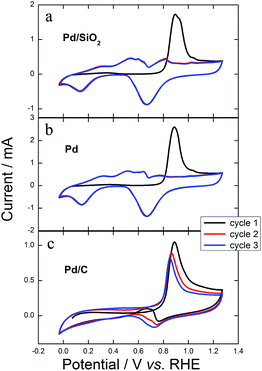 | ||
| Fig. 10 Three successive cyclic voltammograms in 0.1 mol L−1 KOH at 0.05 V s−1 for (a) Pd/SiO2, (b) Pd and (c) Pd/C after exhaustive cycles in the presence of 0.2 mol L−1 GlOH + 0.1 mol L−1 KOH. | ||
These results show that there was no glycerol or any kind of small-chain partially oxidized compound inside the porous architecture or on the surface of Pd/SiO2 and Pd. Only CO remained attached to Pd active sites and was rapidly removed, suggesting CO tolerance. Otherwise, glycerol, products, intermediates and certainly CO remained in the structure and surface of Pd/C.
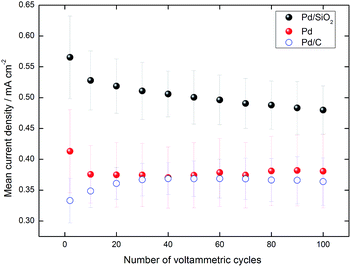
We monitored the current density of peaks for 100 cyclic voltammograms in the presence of glycerol, as shown in Fig. 11. The values monotonously decreased for Pd/SiO2, always maintaining the greatest currents. The current density increased during the first 50 cycles for Pd/C due to a well-known surface cleaning process,45 therefore leading towards values comparable to Pd. However, Pd presented highly stable values after the 60th cycle while the current kept decreasing for Pd/C after a maximum at the 50th cycle.
Fig. S5† evidences that both Pd/SiO2 and Pd catalysts experience surface rearrangement after the 100 potential cycles. Although more investigation is needed, we suggest that the successive cyclic voltammetries in the presence of electrolyte and glycerol, reaching potentials where surface oxides are formed, i.e. 1.27 V, must induce the polycrystalline structure.
Fig. 9b provides equivalent information regarding the stability in potentiostatic measurement. Comparing the current density at 300 s with that after 1800 s under applied potential, we found that Pd/SiO2 and Pd lost 3% and 10% of their initial activity, respectively, while commercial Pd/C lost 45%. These results evidence the outstanding stability provided by the new silica support used for GEOR. The patterned Pd also showed good stability, but the silica contributed more to the maintenance of the catalyst activity.
In summary, Pd/SiO2 synthesized in one step from mesoporous silica improved glycerol electrooxidation in alkaline media by increasing the current density measured both potentiodynamically and potentiostatically. This new catalyst also enhanced the stability of the material. The increased activity is rationalized as the ability to trap reactants in the ordered structure and as an improved CO tolerance, since the electrooxidation of glycerol to CO2 via CO is one of the main pathways. The structure of Pd/SiO2 builds an efficient structure capable of electrooxidizing intact and partially oxidized compounds by increasing the frequency of collision. Moreover, we showed that it is possible to remove SiO2 from the material and keep some of its catalytic benefits, which is important if the researcher chooses to use an oriented Pd catalyst deposited on other carbon or non-carbon supports.
Conclusions
We synthesized highly patterned mesoporous silica with pores in the form of a fountain pen and lm![[3 with combining macron]](https://www.rsc.org/images/entities/char_0033_0304.gif) m symmetry in a cage-like arrangement of bcc structure. Such multifaceted mesoporous silica was used as a support to produce a patterned Pd/SiO2 catalyst and as a template to synthesize a patterned Pd material.
m symmetry in a cage-like arrangement of bcc structure. Such multifaceted mesoporous silica was used as a support to produce a patterned Pd/SiO2 catalyst and as a template to synthesize a patterned Pd material.
Pd/SiO2 NPs showed (111) orientation defects, whereas the surface was rearranged after removing SiO2 to produce Pd catalyst. The organization of the metallic content on silica is a consequence of seed-mediated growth led by the mesopores of the silica particles.
The silica pores in Pd/SiO2 work as a trap that confines glycerol and its partially oxidized compounds, increasing the frequency of collision with Pd active sites while leaving the structure. Hence, the catalytic properties are enhanced, which increases the output current density compared to commercial Pd/C material.
Pd/SiO2 presents values of current density twice those found for Pd/C. The confinement effect leads to a more complete reaction, leaving no carbonyl compounds inside the structure except adsorbed CO. Moreover, the CO is rapidly removed from the Pd/SiO2 surface, which is an additional role of the catalyst to improve GEOR.
Pd/SiO2 showed superior stability to Pd/C. In potentiostatic experiments, the synthesized material lost 3% of its activity while Pd/C lost 45%. Moreover, the activity of Pd/SiO2 was superior to the commercial catalyst for the whole degradation test protocol.
Pd catalysts also displayed improved activity and stability compared to Pd/C; however, Pd/SiO2 reached the best performance. This result evidences that the mesoporous silica plays multiple roles, working as a stable support and as trap to reactants due to the cage-like structure.
Therefore, our results suggest that Pd/SiO2 might be used as active and stable anodes for fuel cells and electrolysers fed by glycerol. Researchers or industrials might also use the patterned Pd catalyst deposited on different carbon or non-carbon supports for glycerol electrooxidation in alkaline media.
Acknowledgements
The authors acknowledge financial assistance from CNPq (Grant # 454516/2014-2), FUNDECT (Grants # 026/2015 and # 099/2016), CAPES and FINEP.References
- C. A. Martins, M. J. Giz and G. A. Camara, Electrochim. Acta, 2011, 56, 4549–4553 CrossRef CAS.
- P. S. Fernández, M. E. Martins, C. A. Martins and G. A. Camara, Electrochem. Commun., 2012, 15, 14–17 CrossRef.
- P. S. Fernández, C. A. Martins, M. E. Martins and G. A. Camara, Electrochim. Acta, 2013, 112, 686–691 CrossRef.
- Y. Kwon and M. T. M. Koper, Anal. Chem., 2010, 82, 5420–5424 CrossRef CAS PubMed.
- O. O. Fashedemi, H. A. Miller, A. Marchionni, F. Vizza and K. I. Ozoemena, J. Mater. Chem. A, 2015, 3, 7145–7156 CAS.
- Y. Kwon, T. J. P. Hersbach and M. T. M. Koper, Top. Catal., 2014, 57, 1272–1276 CrossRef CAS.
- A. C. Garcia, M. J. Kolb, C. van Nierop y Sanchez, J. Vos, Y. Y. Birdja, Y. Kwon, G. Tremiliosi-Filho and M. T. M. Koper, ACS Catal., 2016, 6, 4491–4500 CrossRef CAS.
- R. S. Ferreira Jr, M. Janete Giz and G. A. Camara, J. Electroanal. Chem., 2013, 697, 15–20 CrossRef.
- A. Zalineeva, A. Serov, M. Padilla, U. Martinez, K. Artyushkova, S. Baranton, C. Coutanceau and P. B. Atanassov, J. Am. Chem. Soc., 2014, 136, 3937–3945 CrossRef CAS PubMed.
- A. Zalineeva, S. Baranton and C. Coutanceau, Electrochem. Commun., 2013, 34, 335–338 CrossRef CAS.
- N. Li, W.-Y. Xia, C.-W. Xu and S. Chen, J. Energy Inst. DOI:10.1016/j.joei.2016.07.005.
- L. Su, W. Jia, A. Schempf and Y. Lei, Electrochem. Commun., 2009, 11, 2199–2202 CrossRef CAS.
- X. Zhang and P. K. Shen, Int. J. Hydrogen Energy, 2013, 38, 2257–2262 CrossRef CAS.
- C. A. Martins, P. S. Fernández, F. de Lima, H. E. Troiani, M. E. Martins, A. Arenillas, G. Maia and G. A. Camara, Nano Energy, 2014, 9, 142–151 CrossRef CAS.
- A. K. Sahu, G. Selvarani, S. Pitchumani, P. Sridhar and A. K. Shukla, J. Electrochem. Soc., 2007, 154, B123–B132 CrossRef CAS.
- A. A. Melvin, V. S. Joshi, D. C. Poudyal, D. Khushalani and S. K. Haram, ACS Appl. Mater. Interfaces, 2015, 7, 6590–6595 CAS.
- S. N. Azizi, S. Ghasemi and E. Chiani, Electrochim. Acta, 2013, 88, 463–472 CrossRef CAS.
- J. Shim, J. Lee, Y. Ye, J. Hwang, S.-K. Kim, T.-H. Lim, U. Wiesner and J. Lee, ACS Nano, 2012, 6, 6870–6881 CrossRef CAS PubMed.
- J. Snyder, I. McCue, K. Livi and J. Erlebacher, J. Am. Chem. Soc., 2012, 134, 8633–8645 CrossRef CAS PubMed.
- N. Linares, A. M. Silvestre-Albero, E. Serrano, J. Silvestre-Albero and J. García-Martínez, Chem. Soc. Rev., 2014, 43, 7681–7717 RSC.
- Q. Yao, Z.-H. Lu, Z. Zhang, X. Chen and Y. Lan, Sci. Rep., 2014, 4, 7597 CrossRef CAS PubMed.
- C. M. A. Parlett, D. W. Bruce, N. S. Hondow, A. F. Lee and K. Wilson, ACS Catal., 2011, 1, 636–640 CrossRef CAS.
- M. A. Ballem, J. M. Córdoba and M. Odén, Microporous Mesoporous Mater., 2010, 129, 106–111 CrossRef CAS.
- M. Chen and Y. Xing, Langmuir, 2005, 21, 9334–9338 CrossRef CAS PubMed.
- H. A. Kozlowska, in Comprehensive Treatise of Electrochemistry, ed. E. B. Yeager, J. O. M. Bockris, B. E. Conway and S. Sarangapani, Plenum Press, New York, 1984, vol. 9, p. 2 Search PubMed.
- Q.-S. Chen, Z.-N. Xu, S.-Y. Peng, Y.-M. Chen, D.-M. Lv, Z.-Q. Wang, J. Sun and G.-C. Guo, J. Power Sources, 2015, 282, 471–478 CrossRef CAS.
- N. Hoshi, M. Nakamura, N. Maki, S. Yamaguchi and A. Kitajima, J. Electroanal. Chem., 2008, 624, 134–138 CrossRef CAS.
- M. Klotz, P.-A. Albouy, A. Ayral, C. Ménager, D. Grosso, A. Van der Lee, V. Cabuil, F. Babonneau and C. Guizard, Chem. Mater., 2000, 12, 1721–1728 CrossRef CAS.
- M. Mesa, L. Sierra, J. Patarin and J.-L. Guth, Solid State Sci., 2005, 7, 990–997 CrossRef CAS.
- S. Brunauer, L. S. Deming, W. E. Deming and E. Teller, J. Am. Chem. Soc., 1940, 62, 1723–1732 CrossRef CAS.
- D. Zhao, P. Yang, N. Melosh, J. Feng, B. F. Chmelka and G. D. Stucky, Adv. Mater., 1998, 10, 1380–1385 CrossRef CAS.
- J. Rouquerol, D. Avnir, C. W. Fairbridge, D. H. Everett, J. M. Haynes, N. Pernicone, J. D. F. Ramsay, K. S. W. Sing and K. K. Unger, Pure Appl. Chem., 2009, 66, 1739–1758 Search PubMed.
- P. I. Ravikovitch and A. V. Neimark, Langmuir, 2002, 18, 1550–1560 CrossRef CAS.
- C. J. Brinker and G. W. Scherer, Sol-Gel Science: The Physics and Chemistry of Sol-Gel Processing, Academic Press, 2013 Search PubMed.
- Y. Xiong, H. Cai, B. J. Wiley, J. Wang, M. J. Kim and Y. Xia, J. Am. Chem. Soc., 2007, 129, 3665–3675 CrossRef CAS PubMed.
- M. Jin, H. Zhang, Z. Xie and Y. Xia, Angew. Chem., Int. Ed., 2011, 50, 7850–7854 CrossRef CAS PubMed.
- W. Niu, L. Zhang and G. Xu, ACS Nano, 2010, 4, 1987–1996 CrossRef CAS PubMed.
- F. J. Vidal-Iglesias, R. M. Arán-Ais, J. Solla-Gullón, E. Herrero and J. M. Feliu, ACS Catal., 2012, 2, 901–910 CrossRef CAS.
- A. E. Bolzán, J. Electroanal. Chem., 1995, 380, 127–138 CrossRef.
- P. S. Fernández, J. Fernandes Gomes, C. A. Angelucci, P. Tereshchuk, C. A. Martins, G. A. Camara, M. E. Martins, J. L. F. Da Silva and G. Tremiliosi-Filho, ACS Catal., 2015, 5, 4227–4236 CrossRef.
- P. S. Fernández, C. A. Martins, C. A. Angelucci, J. F. Gomes, G. A. Camara, M. E. Martins and G. Tremiliosi-Filho, ChemElectroChem, 2015, 2, 263–268 CrossRef.
- C. A. Martins, P. S. Fernández, H. E. Troiani, M. E. Martins and G. A. Camara, J. Electroanal. Chem., 2014, 717–718, 231–236 CrossRef CAS.
- L.-N. Zhou, X.-T. Zhang, W.-J. Shen, S.-G. Sun and Y.-J. Li, RSC Adv., 2015, 5, 46017–46025 RSC.
- Y.-W. Lee, S.-B. Han, A.-R. Ko, H.-S. Kim and K.-W. Park, Catal. Commun., 2011, 15, 137–140 CrossRef CAS.
- C. A. Martins, P. S. Fernández, H. E. Troiani, M. E. Martins, A. Arenillas and G. A. Camara, Electrocatalysis, 2014, 5, 204–212 CrossRef CAS.
Footnote |
| † Electronic supplementary information (ESI) available. See DOI: 10.1039/c6ra28864b |
| This journal is © The Royal Society of Chemistry 2017 |

