 Open Access Article
Creative Commons Attribution 3.0 Unported Licence
Ir-phosphate cocatalyst for photoelectrochemical water oxidation using α-Fe2O3†
Ahamed Irshad and
Nookala Munichandraiah*
Department of Inorganic and Physical Chemistry, Indian Institute of Science, Bangalore-560012, India. E-mail: muni@ipc.iisc.ernet.in; Tel: +91-80-2293-3183
First published on 18th April 2017
Abstract
α-Fe2O3 is an ideal photoanode for solar water oxidation owing to its visible light absorbing capability, suitable valence band position, low cost, high abundance, non-toxicity and eco-friendliness. However, the reported efficiencies are very low due to the poor kinetics of water oxidation by photogenerated holes on α-Fe2O3. In the present study, an α-Fe2O3 electrode is obtained by heating a film of Fe which is prepared by the electrochemical reduction of Fe2+ ions. Film thickness and calcination temperature are carefully optimized to get a maximum photoresponse in neutral phosphate solution. In order to improve the water oxidation kinetics and reduce the charge carrier recombination, an iridium-phosphate (Ir-Pi) catalyst is electrodeposited on the surface of α-Fe2O3. Ir-Pi is found to reduce the OER onset potential by 350 mV, and enhances the photocurrent density by 3 times at 1.23 V vs. RHE.
1. Introduction
Solar water splitting requires photons with a minimum energy of 1.23 eV. However, in practice, additional energy is needed to carry out this reaction at reasonable rates, mainly due to kinetic overpotentials.1 Assuming 0.4 V overpotential for the anodic reaction and 0.2 V for the cathodic reaction, a light absorbing material with a band gap energy of 1.83 eV would be needed to split water molecules.2 At the same time, very high bandgap materials such as TiO2, ZnO, etc. are not suitable for practical applications because they can absorb only the ultra-violet portion of solar light. The optimum band gap required is around 2.0 eV as this provides sufficient energy for water splitting by absorbing a major part of the visible region of the solar spectrum.3One of the most interesting semiconductors is hematite (α-Fe2O3) which has the band gap energy close to 2.0 eV, and valence band position positive enough for water oxidation reaction. Furthermore, it is attractive owing to high abundance, low cost, non-toxicity, good stability, and environmental compatibility.4,5 On the other hand, its conduction band is not negative to water reduction potential and hence external bias is needed to drive hydrogen evolution reaction at the cathode. The required bias voltage can be provided by a solar cell connected in a tandem configuration. Despite having favorable light absorbing features and valence band position, the reported efficiencies of photoelectrochemical (PEC) water oxidation at α-Fe2O3 electrodes are extremely low.4–6 The poor efficiency has been attributed to a low rate constant of water oxidation reaction (WOR) by photogenerated holes, and short hole diffusion length (2–4 nm) which allows only holes close to the surface to participate in the reaction.7 Issues related with short hole diffusion lengths have been largely addressed by nanostructuring of the photoelectrodes.8 However, surface and bulk recombination losses still limit the overall performance of hematite based photoanodes. Recent studies suggest that the light driven oxygen evolution reaction (OER) at α-Fe2O3 is sluggish, and most of the photogenerated holes simply undergo recombination with electrons.9 The recombination shifts the photocurrent onset away from the flatband potential, thus, limiting the water splitting efficiency. It has been shown that this loss process can be reduced by interfacing hematite electrodes with OER cocatalysts.9,10
Recently, electrochemical water oxidation at low overpotentials was demonstrated by our group using an amorphous iridium-phosphate (Ir-Pi) catalyst electrodeposited onto carbon paper electrode.11 It is anticipated that the photogenerated holes in α-Fe2O3 are capable of driving water oxidation reaction by Ir-Pi electrocatalyst. Herein, we report the electrodeposition of Ir-Pi catalyst on the surface of α-Fe2O3, which in turn is prepared by heating an electrodeposited Fe film on FTO coated glass. The hybrid Ir-Pi–Fe2O3 is used for the photoelectrochemical water oxidation in neutral phosphate buffer solution. Ir-Pi reduces the onset potential of OER by 350 mV and enhances the photocurrent by three times at 1.23 V vs. RHE.
2. Experimental section
2.1. Reagents, materials and characterization studies
Analytical grade KH2PO4, K2HPO4, FeSO4·7H2O (Merck) and IrCl3 (Aldrich) were used as received. All solutions were prepared using double distilled water. Phosphate buffer solution was prepared by mixing calculated volumes of 0.1 M KH2PO4 and 0.1 M K2HPO4 solutions. The solution pH was maintained at 7.0, unless otherwise stated. The physical characterization studies of the materials were carried out by using scanning electron microscopy (SEM), energy dispersive X-ray analysis (EDXA), X-ray photoelectron spectroscopy (XPS), diffuse reflectance spectroscopy and Raman spectroscopy. For SEM images, Ultra 55 scanning electron microscope equipped with EDXA system at 20 kV was used. Surface compositions of the electrodeposits were analyzed by XPS using SPECS GmbH spectrometer (Phoibos 100 MCD Energy Analyzer) with Mg Kα radiation. Raman spectra were collected using LabRam HR (UV) system at an excitation wavelength of 532 nm. UV-Vis diffuse reflectance spectroscopic studies were carried out by Perkin Elmer Lambda 750 spectrophotometer with pure BaSO4 as the reference. The optical band gap was calculated from Tauc plot for which α value was extracted from reflectance using Kubelka–Munk model. Electrochemical deposition and photoelectrochemical studies were conducted using PARC EG&G potentiostat/galvanostat model Versastat II as the electrochemical measurement unit and Xe lamp as the light source. The light from the source was calibrated to 1 Sun intensity (100 mW cm−2) using a photodiode power meter (Thorlab, S120B) and a standard solar cell. Fe2O3 or Ir-Pi–Fe2O3 (area = 1 cm2) as the working electrode, saturated calomel electrode (SCE) reference and a large area Pt counter electrode were used. Photoelectrochemical studies were carried out by linear sweep voltammetry at 50 mV s−1 in 0.1 M neutral phosphate solution under dark, and illumination from both front and back sides of the coating. Applied bias photon-to-current efficiencies (ABPE) of the electrodes were calculated from voltammograms, assuming 100% faradaic efficiency. Incident photon-to-current efficiency (IPCE) was measured using Oriel IQE 200 equipped with a Xe lamp and Cornerstone monochromator. Electrochemical impedance spectra were recorded by CH Instruments potentiostat/galvanostat model CHI 608C, which was coupled to a frequency response analyzer. An ac perturbation of 10 mV was applied at a frequency of 10 kHz and impedance was measured as a function of applied potential. Mott–Schottky plot generated from the impedance data was used for the determination of flat band potential. Current density values are reported on the basis of geometrical area. Potential values are converted to reversible hydrogen electrode (RHE) scale using the equation, ERHE = ESCE + E0SCE + 0.059 × pH, where ESCE is the measured potential using SCE reference and E0SCE is the standard potential of SCE at 25 °C (0.242 V), unless otherwise stated.2.2. Electrochemical deposition of Fe film
Iron film was electrodeposited onto fluorine doped tin oxide (FTO) coated conducting glass plate (TISXZ006, sheet resistance < 10 Ω sq−1) as reported in the literature.12 Prior to the deposition, FTO glass plates were cleaned thoroughly by sonication for 15 min each in water, acetone and isopropanol. The FTO glass slides were dried in Ar flow and electrical contact was made through a Cu wire attached to the conducting side of FTO glass using Ag paste. The exposed area was 1 cm2 and remaining part of the electrode was covered with PTFE tape. Electrodeposition was carried out in a glass cell with FTO as the working electrode, a large Pt foil as counter electrode and a SCE as the reference. The electrolyte was freshly prepared 10 mM FeSO4·7H2O solution in water. Electrodeposition was carried out at −1.05 V vs. SCE for different time intervals in the range 1–15 min. After deposition, electrodes were gently rinsed with water, dried in Ar flow and stored in vacuum desiccators.2.3. Preparation of α-Fe2O3
The electrodeposited Fe film was converted to α-Fe2O3 by thermal treatment. For this, Fe film coated FTO glass plates were separated from Cu contact wires. Silver paste used for the contact was completely removed using acetone to avoid any possible diffusion of Ag during high temperature heating. The Fe–FTO plate was kept in an alumina boat and heated in air at different temperatures and durations. Temperature was in the range of 300–900 °C and heating time was 1–6 h. Formation of α-Fe2O3 was monitored by XRD and Raman spectroscopy.2.4. Electrodeposition of Ir-Pi on α-Fe2O3
Amorphous iridium-phosphate (Ir-Pi) was deposited onto α-Fe2O3 coated FTO electrodes using electrochemical method as reported in the case of Ir-Pi deposition on carbon electrodes.11 The electrolyte was 0.5 mM IrCl3 in 0.1 M potassium phosphate solution (pH 7.0). Deposition was carried out 1.0 V vs. SCE for different time intervals, typically in the range of 0–40 min without stirring the solution. After deposition, electrodes were thoroughly rinsed with double distilled water, dried at 60 °C for 1 h and stored in a desiccator.3. Results and discussions
3.1. Crystallinity
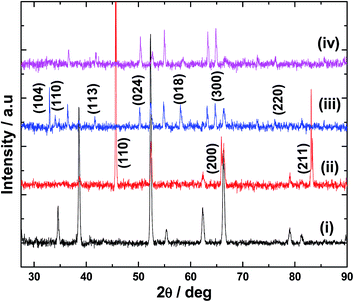
Electrodeposition of Fe film on FTO and its conversion to α-Fe2O3 was confirmed by XRD analysis. In the case of Fe film (Fig. 1(ii)), peaks at 45.8°, 65.8° and 82.9° are observed which differ from the XRD pattern of the bare FTO substrate (Fig. 1(i)). These peaks are due to the reflections from (110), (200) and (211) planes of cubic Fe metal, thus, indicating the formation of Fe deposit by the electrochemical reduction of Fe2+ ions.12 It is to be noted that most of the FTO peaks are absent for Fe–FTO because thick layer of Fe was used for the XRD studies. On heating in air above 300 °C, Fe deposit is converted into α-Fe2O3, and the crystallinity improves with heating temperature and time. The XRD pattern of the Fe film after heating at 600 °C for 2 h is shown in Fig. 1(iii). The peaks from the cubic structure of Fe are absent and new peaks appear. These peaks are assigned to diffractions from (104), (110), (113), (024), (018), (300) and (220) planes of α-Fe2O3.13 No other major peaks can be found indicating the phase purity of α-Fe2O3 film formed by the calcination of electrodeposited Fe. The XRD pattern for Ir-Pi–Fe2O3 (Fig. 1(iv)) shows only the peaks from bare α-Fe2O3 and no other peaks are observed for Ir-Pi, suggesting the amorphous nature of the electrodeposited Ir-Pi. Similarly, very thick Ir-Pi deposited directly onto FTO substrate also shows amorphous feature (Fig. S1 of the ESI†). This is again in accordance with the results reported for the Ir-Pi deposition on carbon paper substrate.113.2. Morphology
The morphology of the electrodeposit was studied by SEM. As it is seen from Fig. 2a, the electrodeposited Fe film has cubic shaped particles. These particles are fused in many regions forming clusters. No preferential growth direction is observed and they are randomly distributed. On the other hand, Fe2O3 formed after heating Fe at 600 °C for 2 h shows entirely different morphology (Fig. 2b) where only lumps are found. These lumps have size in the range of 200 to 800 nm. SEM image after Ir-Pi deposition (Fig. 2c) shows that these Fe2O3 lumps are covered with sheets of Ir-Pi catalyst. These sheets are folded and wrapped on the surface of Fe2O3. However, Ir-Pi on Fe2O3 is slightly different in morphology from the reported Ir-Pi on carbon paper.11 This could be due to large difference in the conductivity as well as surface features of the carbon paper and Fe2O3 substrates. In addition, a relatively higher potential and deposition time was used for Ir-Pi deposition on Fe2O3 in view of large ohmic drop in the film due to poor electronic conductivity of Fe oxides. Similarly, TEM and HRTEM images clearly show a sharp interface between crystalline Fe2O3 particle and amorphous Ir-Pi catalyst layer (Fig. S2†).3.3. Raman spectra
Raman spectra were recorded for all the samples. The as-deposited Fe film doesn't exhibit any Raman active bands (Fig. 3(i)). However, on heating at 600 °C for 2 h, peaks associated with α-Fe2O3 are observed (Fig. 3(ii)). Seven optical modes of even symmetry (2A1g + 5Eg) are expected in the Raman spectrum of α-Fe2O3.14 The peaks located at 225, 245, 292, 408, 495, 610 and 1320 cm−1 correspond to the characteristic peaks of α-Fe2O3. The two peaks at 225 and 495 cm−1 correspond to the A1g mode whereas the peaks at 245, 292, 408 and 610 cm−1 are attributed to the Eg mode.15 There has been considerable controversy regarding the origin of 1320 cm−1 peak. Martin et al.,16 suggested that this mode originates from a secondary magnon–photon interaction whereas Massey et al.,17 proposed a secondary phonon–photon interaction. Notably, there is no peak at 660 cm−1 which is typical of Fe3O4 (ref. 18) and no other peaks due to polymorphs of Fe(III) oxide or oxyhydroxides (such as γ-Fe2O3, α-FeOOH, and γ-FeOOH) are found. This suggests the phase and compositional purity of α-Fe2O3 prepared in the present study. Raman spectra were also recorded for α-Fe2O3 film after Ir-Pi deposition. As it is seen in Fig. 3(iii), no additional peaks for Ir-Pi catalysts are found, and only the peaks corresponding to α-Fe2O3 are present in the spectrum. Moreover, there is no shift in the peaks positions after decorating with Ir-Pi catalyst.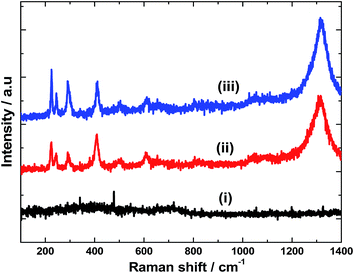 | ||
| Fig. 3 Raman spectra of (i) Fe, (ii) Fe2O3, and (iii) Ir-Pi–Fe2O3 on FTO substrates. Excitation wavelength: 532 nm. | ||
3.4. Chemical composition
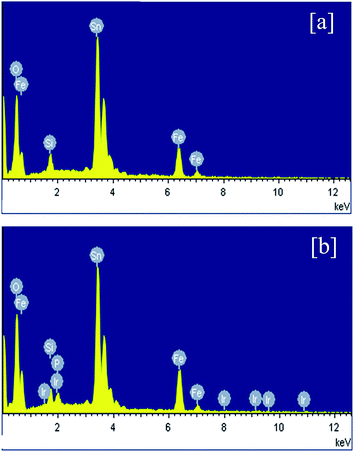
XRD and Raman studies confirm both electrodeposition of Fe film and its conversion to α-Fe2O3 upon heating at 600 °C in air. Hence further physicochemical studies are mainly performed for detecting Ir and P after the electrochemical deposition of Ir-Pi catalyst. Hence, EDXA and XPS measurements were carried out for Fe2O3 before and after Ir-Pi deposition. EDXA spectra are shown Fig. 4. In the case of Fe2O3 (Fig. 4a), major peaks are assigned to Fe, O, Si and Sn. Presence of Fe and O indicate the formation of Fe2O3 whereas Si and Sn peaks are from the underlying FTO coated glass substrate. On the other hand, EDXA spectrum of Fe2O3 after the deposition of Ir-Pi (Fig. 4b), shows the presence of Ir and P along with peaks corresponding to Fe and O. The atomic percentages of Ir, P and Fe are 2.5%, 3.4% and 6.9%, respectively. Thus, Ir-Pi has Ir and P in a ratio 1![[thin space (1/6-em)]](https://www.rsc.org/images/entities/char_2009.gif) :
:![[thin space (1/6-em)]](https://www.rsc.org/images/entities/char_2009.gif) 1.36 which closely matches with the reported chemical composition of Ir-Pi on carbon.11 These studies confirm the formation of Ir-Pi catalyst during the anodic polarization of Fe2O3 electrodes in neutral phosphate buffer solution containing Ir3+ ions.
1.36 which closely matches with the reported chemical composition of Ir-Pi on carbon.11 These studies confirm the formation of Ir-Pi catalyst during the anodic polarization of Fe2O3 electrodes in neutral phosphate buffer solution containing Ir3+ ions.
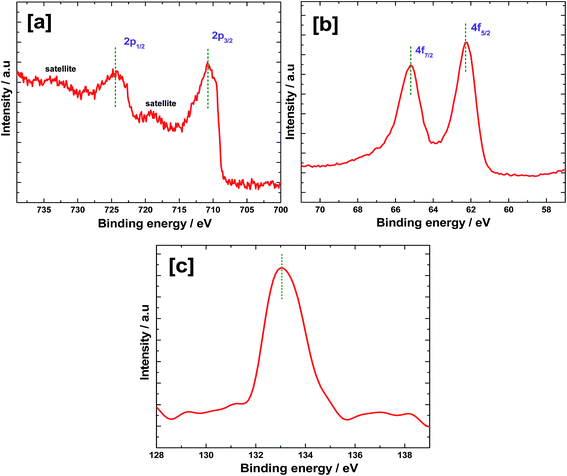
X-ray photoelectron spectra were recorded for Fe2O3 after electrochemically depositing Ir-Pi and the results are shown in Fig. 5. In the Fe 2p region (Fig. 5a), a pair of peaks are present at 724.4 and 710.8 eV, which correspond to Fe 2p1/2 and 2p3/2, respectively.19 Fe 2p3/2 peak appears to be narrower and stronger than Fe 2p1/2. Also, the area of Fe 2p3/2 peak is greater than that of Fe 2p1/2 because Fe 2p3/2 has degeneracy of four states while Fe 2p1/2 has only two, in spin–orbit coupling.20 A satellite peak of Fe 2p3/2 peak is found at 718.9 eV which is 8.1 eV higher than the binding energy of Fe 2p3/2 and this peak does not overlap with main photoelectron peaks. There is another peak at higher energy side of Fe 2p1/2, which may be a satellite peak for Fe 2p1/2. In the Fe 2p spectrum, no characteristic peaks for metallic Fe or other oxides of Fe are found. The results indicate that the Fe is in Fe3+ state and the oxide formed after heat treatment to Fe film is predominantly Fe2O3. In the high resolution spectrum of Ir 4f (Fig. 5b), a doublet is present at 62.2 and 65.2 eV, which correspond to Ir 4f7/2 and 4f5/2, respectively.21 The 4f5/2 peak is more intense than the 4f7/2 signal and the spin–orbit splitting value is 3.0 eV. These results are comparable to the literature values of Ir 4f in the Ir-Pi catalysts on carbon paper.11 The peak at 133.1 eV in P 2p spectrum (Fig. 5c) is assigned to phosphate.22 This is similar to the binding energy of P 2p in the Ir-Pi catalyst on carbon electrode,11 but the binding energy is marginally greater (0.3 eV) than the P 2p peak observed in the case of Co-Pi deposited on carbon.23
3.5. Bandgap measurements
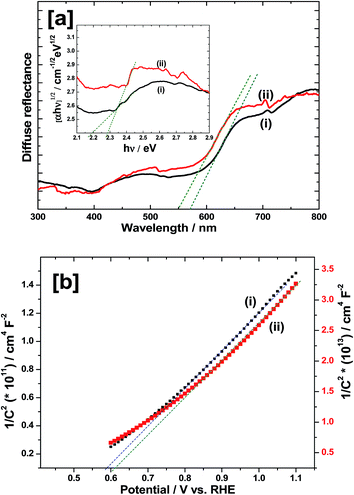
In order to study the optical properties, UV-VIS diffuse reflectance spectroscopy (DRS) measurements were carried out and the results are shown in Fig. 6a. The prepared α-Fe2O3 displays strong light absorption capability both in UV and visible light region (Fig. 6a(i)). The absorption edge is around 567 nm which is close to the values reported in the literature.4–6 However, after depositing Ir-Pi on the surface of α-Fe2O3, the absorption onset is blue shifted to 545 nm (Fig. 6a(ii)), indicating a modified band gap. Also, Ir-Pi deposited Fe2O3 shows higher reflectance than bare Fe2O3 between 450 and 750 nm. To accurately find the band gaps of the materials, Tauc equation was used,24| (αhν) = A(hν − Eg)n | (1) |
Flat band potential (EFB) is an approximate measure of the conduction band position in n-type semiconductors. Moreover, it provides the theoretical onset potential (Eonset) for the photoelectrochemical oxygen evolution reaction. In general, the flatband potential is determined by measuring the capacitance (C) at different electrode potential (E) using the following equation,
| 1/C2 = [2/εrε0eNd][E − EFB − (kBT/e)] | (2) |
3.6. Optimization of Fe film
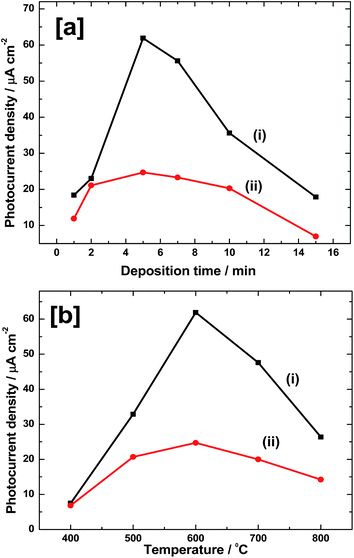
The thickness of Fe film and thus Fe2O3 thickness needs to be optimized for achieving a high photoelectrochemical performance towards water oxidation reaction. For this, several electrodes were prepared by depositing Fe at −1.05 V vs. SCE for 1–15 min. Electrodes were rinsed with water, dried in Ar flow and heated at 600 °C for 2 h in air to form α-Fe2O3. PEC studies were carried out by linear sweep voltammetry at 50 mV s−1 in 0.1 M neutral phosphate buffer solution under illumination from both front and back sides of the coating. The photocurrent density values so obtained at 1.23 V vs. RHE are plotted as a function of Fe deposition time in Fig. 7a. As it is seen from Fig. 7a(i), in the case of front side illumination, a photocurrent density as low as 18 μA cm−2 is obtained for 1 min of deposition. It increases to 23 μA cm−2 for 2 min deposited Fe and reaches maximum of 62 μA cm−2 for 5 min. Further increase in the deposition time has negative effect and photocurrent falls to 56 μA cm−2 for 7 min. It further decreases to 36 and 18 μA cm−2 for 10 and 15 min deposited films, respectively. Similar trend is also observed for back side illuminated electrodes, however with much lower values of photocurrent (Fig. 7a(ii)). In this case, photocurrent density values of 12, 21, 25, 23, 20 and 6 μA cm−2 are obtained for Fe deposition of 1, 2, 5, 7, 10 and 20 min, respectively. Thus, the highest photoresponse is observed for 5 min deposited electrodes in both the cases. The highest photocurrent density values are 62 and 25 μA cm−2, respectively for front and back side illuminated electrodes. The low photoresponse in the case of back side illuminated electrodes could be due to light absorption and scattering by the glass substrate.It is also important to optimize the calcination temperature to get high photoresponse. Very low heating temperature will result in poor crystallinity and very high temperature can cause the degradation of FTO substrate and subsequent loss in conductivity. In order to perform the temperature optimization, several Fe electrodes were prepared by depositing at −1.05 V for 5 min. Then, they were heated at different temperatures in the range of 400–800 °C for 2 h in air, and PEC measurements were carried out as in above case. A plot of photocurrent density at 1.23 V vs. RHE against calcination temperature is shown in Fig. 7b. Results are obtained for both front side (Fig. 7b(i)) and back side (Fig. 7b(ii)) illuminations. In the case of front side illumination (Fig. 7b(i)), a low photocurrent density value of 8 μA cm−2 is obtained when the calcination temperature is 400 °C. Such a poor performance could be due to incomplete conversion of Fe to photoactive Fe2O3 and also due to poor crystallinity of Fe2O3 so formed at this temperature. However, on heating at 500 °C, the photocurrent (33 μA cm−2) is enhanced by nearly 4 times. Highest photocurrent is seen for Fe2O3 heated at 600 °C and the photocurrent density is 62 μA cm−2. On further heating to 700 °C, current falls to 46 μA cm−2 which again drops to 26 μA cm−2 at 800 °C. Similar trend is observed for back side illuminated electrodes (Fig. 7b(ii)). Photocurrent of 6 μA cm−2 for 400 °C sample is increased to 21 μA cm−2 at 500 °C. Maximum activity of 24 μA cm−2 is obtained for 600 °C and on further raising the temperature to 700 °C, current falls to 20 μA cm−2. It again reduces to 14 μA cm−2 for 800 °C sample. Overall, there are two observations. First one is that, both in front side and back side illuminations, maximum photoactivity is obtained for Fe films heated at 600 °C. Secondly, the photocurrent observed for front side illumination is much higher than that for back side illuminated electrodes. For instance, for 5 min deposited and 600 °C heated films, a photocurrent density value of 62 μA cm−2 is obtained during the front side illumination whereas it is only 24 μA cm−2 for the back side illumination.
3.7. Electrodeposition of Ir-Pi on α-Fe2O3
In order to confirm the electrochemical deposition of Ir-Pi on α-Fe2O3 substrate, cyclic voltammetry experiments were carried out. Cyclic voltammograms of α-Fe2O3 coated FTO in 0.1 M phosphate buffer solution (pH 7.0) containing 0.5 mM IrCl3 are shown in Fig. 8. After completing the first cycle (Fig. 8(i)), a broad oxidation peak centered at around 0.50 V vs. SCE is seen. This broad peak region almost covers the observed potentials for Ir3+/4+ and Ir4+/5+ transitions during the deposition of Ir-Pi on carbon paper electrode.11 Hence, it is anticipated that the broad peak in the present study is due to the overlapping of two oxidation peaks, and oxidation state of Ir is +5 after completing a half cycle. During the negative scan (Fig. 8(i)), a weak and broad reduction peak at 0.40 V vs. SCE can be seen. To study the growth process of Ir-Pi, potential cycling was repeated. The cyclic voltammogram after completing the 10th cycle is shown in Fig. 8(ii), which resembles the features of first cycle voltammogram (Fig. 8(i)), but with a large increase in the current above 0.80 V vs. SCE. This is attributed to the electrochemical oxidation of water on thick Ir-Pi catalyst grown on the surface of α-Fe2O3. These studies suggest that Ir-Pi catalyst deposition can be done on α-Fe2O3 above 0.60 V vs. SCE at a reasonable rate from 0.5 mM Ir3+ solutions.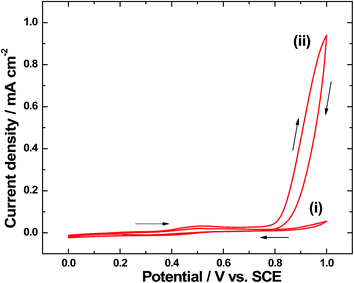 | ||
| Fig. 8 Cyclic voltammograms of α-Fe2O3–FTO electrode in 0.1 M neutral phosphate solution containing 0.5 mM IrCl3 after completing (i) first cycle and (ii) 10th cycle at 5 mV s−1. | ||
3.8. Effect of Ir-Pi deposition on PEC activity
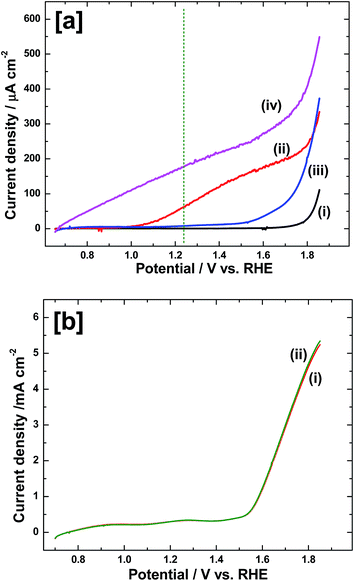
To study the effect of Ir-Pi deposition on α-Fe2O3 for oxygen evolution reaction (OER) under photoelectrochemical condition, Ir-Pi was deposited onto α-Fe2O3 electrode from 0.5 mM IrCl3 + 0.1 M phosphate solution (pH 7.0) at 1.0 V vs. SCE for 25 min. Then, the linear sweep voltammograms were recorded for both Fe2O3 and Ir-Pi–Fe2O3 at 50 mV s−1 in 0.1 M neutral phosphate electrolyte under front side illuminations. Results are shown in Fig. 9a. In the case of bare Fe2O3, only negligibly small current flows in dark till potential reaches 1.80 V, indicating the absence of any electrochemical reaction at this potential range. However, current increases sharply above 1.80 V due to electrochemical OER (Fig. 9a(i)). Upon illumination of Fe2O3 electrode, current starts flowing at potential close to 1.0 V and it reaches 62 μA cm−2 at 1.23 V (Fig. 9a(ii)). The photocurrent onset is around 400 mV higher than the experimentally determined flatband potential of Fe2O3, suggesting a high overpotential for PEC oxygen evolution on as-prepared Fe2O3 electrode. On the other hand, the onset potential is as low as 0.65 V in the case of Ir-Pi–Fe2O3 (Fig. 9a(iv)), which is 350 mV lower than that on bare Fe2O3 electrode under identical conditions. Similar to the present study, IrO2 nanoparticles loaded Fe2O3 was reported for photoelectrochemical water oxidation.28 Around 200 mV cathodic shift in the photocurrent onset was observed after IrO2 deposition. Similarly, photoelectrodeposited Co-Pi caused 170 mV improvement29 whereas FeOOH cocatalyst shifted the onset potential by 120 mV.30 It is also reported that photo or electrochemical deposition of Ni-oxides or Co-oxides on hematite could lower the required bias voltage by 100–300 mV.31 Thus, 350 mV cathodic shift in OER onset potential observed for Ir-Pi deposited Fe2O3 in the present case is superior to the literature reports on similar studies using Co-Pi, IrO2, FeOOH and Co/Ni-oxide catalysts. In addition, a high current density of 180 μA cm−2 is observed at 1.23 V for Ir-Pi loaded Fe2O3 which is 2.9 times higher than the current observed for Fe2O3 electrode alone. Under dark also, onset potential of electrochemical OER is reduced to 1.50 V on Ir-Pi–Fe2O3 from 1.80 V observed for Fe2O3 without Ir-Pi (Fig. 9a(i) and (iii)). This is anticipated owing to high electrochemical activity of Ir-Pi catalyst towards electrochemical OER. Also, applied bias photon-to-current efficiency (ABPE) calculated from LSV curve indicates a maximum value of 0.027% at 0.90 V for Ir-Pi–Fe2O3 whereas it is 10 times less (0.0027%) for bare Fe2O3 at 1.10 V (Fig. S3†). The evolved gas was detected and confirmed as oxygen using Pt electrode sensor (Fig. S4†). These results clearly confirm the electrochemical deposition of Ir-Pi and its positive role towards both electrochemical and photoelectrochemical OER in neutral electrolytes. To rule out the possibility that Ir-Pi itself is photoactive along with Fe2O3 electrode, Ir-Pi was deposited on FTO glass and then, the linear sweep voltammograms were recorded in phosphate solution under dark (Fig. 9b(i)) and light (Fig. 9b(ii)) conditions. It is seen from Fig. 9b that there is no enhancement in the current upon illuminating the Ir-Pi–FTO electrode. This suggests that Ir-Pi alone is inactive towards photooxidation of water, and it merely acts as a cocatalyst for the reaction on Fe2O3 photoelectrode. It is also noted that the incident photon-to-current efficiency (IPCE) at 1.50 V vs. RHE is increased by 1.5 times after interfacing with Ir-Pi catalyst (Fig. S5†).3.9. Optimization of Ir-Pi thickness
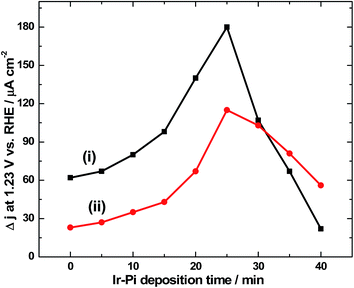
It is necessary to optimize the loading level of Ir-Pi on α-Fe2O3 to achieve maximum photoresponse. For this, Ir-Pi was deposited from 0.5 mM IrCl3 + 0.1 M phosphate solution (pH 7.0) at 1.0 V vs. SCE for different time intervals in the range of 0 to 40 min. PEC water oxidation was studied by linear sweep voltammetry at 50 mV s−1 in 0.1 M neutral phosphate electrolyte both by front side and back side illuminations. The photocurrent density so obtained (after subtracting the dark current) in LSV at 1.23 V is plotted as the function of Ir-Pi deposition time in Fig. 10. As it is seen from Fig. 10(i), the current value for bare α-Fe2O3 is 62 μA cm−2 which increases to 66, 78, 97, 139 and 180 μA cm−2 for 5, 10, 15, 20 and 25 min Ir-Pi deposited electrodes. However, upon further increasing the deposition time to 30, 35 and 40 min, photocurrent falls to 106, 65 and 20 μA cm−2, respectively. This could be due to partial scattering and absorption of incident light by thick layer of Ir-Pi catalyst on the surface of α-Fe2O3. Thus, the maximum photoresponse is obtained for 25 min of Ir-Pi deposition and the resultant photocurrent at 1.23 V vs. RHE is 2.9 times higher than that of bare α-Fe2O3. This indicates the favorable role of Ir-Pi as a cocatalyst for solar water oxidation reaction. Similar studies were repeated in the case of back side illumination (Fig. 10(ii)). Here, the photocurrent density of 24 μA cm−2 for α-Fe2O3 is increased to 27, 35, 41, 67 and 115 μA cm−2, respectively for 5, 10, 15, 20 and 25 min Ir-Pi deposited electrodes. As in the case of front side illumination, deposition over 25 min causes a decrease in photocurrent. Current values of 102, 80 and 55 μA cm−2 are obtained after 30, 35 and 40 min of Ir-Pi deposition. It is worth noticing that, for the deposition time below 30 min, front side illuminated electrodes show higher photocurrent than back side illuminations whereas at higher thickness, back side illuminated electrodes dominate. This is due to the fact that the light absorption by thick Ir-Pi layer is minimum during back side is illumination.3.10. Proposed mechanism
Bandgap measurements using diffuse reflectance spectroscopy suggest only a slight shift in the Eg of Fe2O3 after Ir-Pi loading (Fig. 6a). Similarly, Mott–Schottky plots indicate almost no variation in the conduction band position of Ir-Pi–Fe2O3 compared to Fe2O3 (Fig. 6b). These studies clearly exclude any modification in the optical properties of Fe2O3 by Ir-Pi as a reason for the enhancement in PEC performance. Hence, it is proposed that the Ir-Pi deposit acts as a cocatalyst, and the enhancement in photocurrent is due to fast kinetics of OER at Ir-Pi–Fe2O3 electrode. A similar behavior was also reported for Ir32 and Co33 based catalysts deposited hematite photoanodes. The proposed mechanism of water oxidation reaction on Ir-Pi–Fe2O3 hybrid photoelectrode is illustrated in Scheme 1. In general, illumination of Fe2O3 produces electron–hole pairs. Electrons in the conduction band are transported to external circuit under applied bias. Although, the photogenerated holes in the valence bad of Fe2O3 can directly oxidize water, bare Fe2O3 has poor catalytic activity towards OER. Hence, in the absence Ir-Pi, most of the holes recombine with electrons without causing any reaction. Instead, in the presence Ir-Pi, Ir(IV/V) centers in the catalyst layer rapidly accept the holes before recombining with electrons to form Ir(V/VI) unit and thus the charge carrier separation is improved. Thermodynamically, the oxidation potential of Ir(V/VI) is higher enough for the oxidation of water. Therefore, a high photocurrent due to an immediate evolution of oxygen gas is observed for Ir-Pi–Fe2O3. It is proposed in the OER mechanism on Co-Pi that the catalyst undergoes a reversible one electron, one proton equilibrium step prior to a rate limiting oxygen evolution step.34 In the present case, the equilibrium redox process corresponds to the oxidation of Ir(IV/V) mixed valence cluster to Ir(V/VI) unit along with liberation of a H+,
Ir(IV/V)–OH ![[left over right harpoons]](https://www.rsc.org/images/entities/char_21cb.gif) Ir(V/VI)–O + H+ + e− Ir(V/VI)–O + H+ + e−
| (3) |
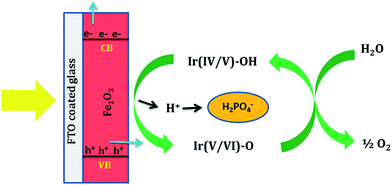 | ||
| Scheme 1 Schematic illustration for the proposed mechanism of oxygen evolution reaction (OER) on Ir-Pi deposited Fe2O3 photoelectrode. | ||
4. Conclusions
Photoelectrochemical water oxidation in neutral phosphate electrolyte was studied using α-Fe2O3 as a photoanode and Ir-Pi as a cocatalyst. Electrochemical deposition of Fe film by the reduction of Fe2+ ions and its subsequent calcination above 400 °C in air resulted in the formation α-Fe2O3 film. Under the optimized conditions, the as-prepared α-Fe2O3 provided 62 μA cm−2 for front side illumination and 24 μA cm−2 for back side illumination, at 1.23 V vs. RHE in 0.1 M neutral phosphate solution. After 25 min of Ir-Pi deposition at 1.0 V vs. SCE from 0.5 mM IrCl3 + 0.1 M phosphate solution (pH 7.0), there was an increase in the photocurrent density at 1.23 V vs. RHE by 2.9 and 4.8 times, respectively for front and back side illuminated electrodes. The results of these studies indicate the favorable role of Ir-Pi as a cocatalyst for solar assisted water oxidation process in neutral solutions.Acknowledgements
The authors thank CSIR, India for the financial support and CeNSe at IISc, Bangalore for the instrumental facilities. Special thanks to Ms Krishna for the technical assistance during IPCE measurement.References
- X. Li, J. Yu, J. Low, Y. Fang, J. Xiao and X. Chen, J. Mater. Chem. A, 2015, 3, 2485–2534 CAS.
- M. G. Walter, E. L. Warren, J. R. McKone, S. W. Boettcher, Q. Mi, E. A. Santori and N. S. Lewis, Chem. Rev., 2010, 110, 6446–6473 CrossRef CAS PubMed.
- J. Gan, X. Lu and Y. Tong, Nanoscale, 2014, 6, 7142–7164 RSC.
- T. W. Hamann, Dalton Trans., 2012, 41, 7830–7834 RSC.
- P. S. Bassi, Gurudayal, L. H. Wong and J. Barber, Phys. Chem. Chem. Phys., 2014, 16, 11834–11842 RSC.
- O. Zandi and T. W. Hamann, Phys. Chem. Chem. Phys., 2015, 17, 22485–22503 RSC.
- D. K. Bora, A. Braun and E. C. Constable, Energy Environ. Sci., 2013, 6, 407–425 CAS.
- J. J. Wang, Y. Hu, R. Toth, G. Fortunatoc and A. Braun, J. Mater. Chem. A, 2016, 4, 2821–2825 CAS.
- B. Iandolo, B. Wickman, I. Zoric and A. Hellman, J. Mater. Chem. A, 2015, 3, 16896–16912 CAS.
- J. Yang, D. Wang, H. Han and C. Li, Acc. Chem. Res., 2013, 46, 1900–1909 CrossRef CAS PubMed.
- A. Irshad and N. Munichandraiah, ACS Appl. Mater. Interfaces, 2015, 7, 15765–15776 CAS.
- G. Rahman and O. S. Joo, Mater. Chem. Phys., 2013, 140, 316–322 CrossRef CAS.
- T. K. Townsend, E. M. Sabio, N. D. Browning and F. E. Osterloh, Energy Environ. Sci., 2011, 4, 4270–4275 CAS.
- D. Bersani, P. P. Lottici and A. Montenero, J. Raman Spectrosc., 1999, 30, 355–360 CrossRef CAS.
- Q. Wei, Z. Zhang, Z. Li, Q. Zhou and Y. Zhu, J. Phys. D: Appl. Phys., 2008, 41, 202002 CrossRef.
- T. P. Martin, R. Merlin, D. R. Huffman and M. Cardona, Solid State Commun., 1977, 22, 565–567 CrossRef CAS.
- M. J. Massey, U. Baier, R. Merlin and W. H. Weber, Phys. Rev. B, 1990, 41, 7822–7827 CrossRef CAS.
- P. Kumar, P. Sharma, R. Shrivastav, S. Dass and V. R. Satsangi, Int. J. Hydrogen Energy, 2011, 36, 2777–2784 CrossRef CAS.
- F. Zhang, X. Li, Q. Zhao, Q. Zhang, M. Tade and S. Liu, J. Colloid Interface Sci., 2015, 457, 18–26 CrossRef CAS PubMed.
- G. Rahman and O. S. Joo, Int. J. Hydrogen Energy, 2012, 37, 13989–13997 CrossRef CAS.
- A. Korotcov, Y. S. Huang, D. S. Tsai and K. K. Tiong, J. Phys.: Condens. Matter, 2006, 18, 1121–1136 CrossRef CAS.
- S. Cobo, J. Heidkamp, P. A. Jacques, J. Fize, V. Fourmond, L. Guetaz, B. Jousselme, V. Ivanova, H. Dau, S. Palacin, M. Fontecave and V. Artero, Nat. Mater., 2012, 11, 802–807 CrossRef CAS PubMed.
- A. Irshad and N. Munichandraiah, Phys. Chem. Chem. Phys., 2014, 16, 5412–5422 RSC.
- E. B. Ledesmaa, M. L. G. Benjumea, I. E. Cabrerab, M. O. Gutierrezc, F. J. E. Beltrand, J. Mostaghimie and M. E. C. Garcia, Mater. Sci. Eng., B, 2010, 174, 71–73 CrossRef.
- R. Dholam, N. Patel, A. Santini and A. Miotello, Int. J. Hydrogen Energy, 2010, 35, 9581–9590 CrossRef CAS.
- P. Kubelka, J. Opt. Soc. Am., 1948, 38, 449–457 Search PubMed.
- A. Hankin, J. C. Alexander and G. H. Kelsall, Phys. Chem. Chem. Phys., 2014, 16, 16176–16186 RSC.
- S. D. Tilley, M. Cornuz, K. Sivula and M. Gratzel, Angew. Chem., Int. Ed., 2010, 49, 6405–6408 CrossRef CAS PubMed.
- D. K. Zhong, M. Cornuz, K. Sivula, M. Gratzel and D. R. Gamelin, Energy Environ. Sci., 2011, 4, 1759–1764 CAS.
- J. Y. Kim, D. H. Youn, K. Kang and J. S. Lee, Angew. Chem., Int. Ed., 2016, 55, 10854–10858 CrossRef CAS PubMed.
- L. Halaoui, J. Phys. Chem. C, 2016, 120, 22766–22776 CAS.
- L. B. Bou, E. M. Marza, P. Rodenas, E. M. Barea, F. F. Santiago, S. Gimenez, E. Peris and J. Bisquert, J. Phys. Chem. C, 2013, 117, 3826–3833 Search PubMed.
- A. Irshad and N. Munichandraiah, J. Electrochem. Soc., 2015, 162, H235–H243 CrossRef CAS.
- Y. Surendranath, M. W. Kanan and D. G. Nocera, J. Am. Chem. Soc., 2010, 132, 16501–16509 CrossRef CAS PubMed.
Footnote |
| † Electronic supplementary information (ESI) available. See DOI: 10.1039/c7ra00102a |
| This journal is © The Royal Society of Chemistry 2017 |

