 Open Access Article
Cost-effective fabrication of graphene-like nanosheets from natural microcrystalline graphite minerals by liquid oxidation–reduction method†
Wei Xie *abcd,
Xukun Zhuab,
Shang Xuab,
Shihe Yic,
Zhanhu Guo
 d,
Jiacai Kuangab and
Yingjun Denga
aHunan Province Key Laboratory of Safety Design and Reliability Technology for Engineering Vehicle, Changsha University of Science & Technology, Changsha 410114, China. E-mail: cslggncl@163.com
bHunan Province Higher Education Key Laboratory of Modeling and Monitoring on the Near-Earth Electromagnetic Environments, Changsha University of Science & Technology, Changsha 410114, China
cCollege of Aerospace Science and Engineering, National University of Defense Technology, Changsha 410073, China
dChemical and Biomolecular Engineering Department, University of Tennessee, Knoxville, TN 37996, USA
First published on 22nd June 2017
Abstract
It is a challenge to prepare graphene-like nanosheets (GNs) with desired electrical properties from natural microcrystalline graphite minerals (NMGM) since the impurities in NMGM are always hard to eliminate and the grain size of NMGM is much smaller than that of flake graphite (FG). The morphology, structure, surface chemistry, and compositions of the GNs prepared from NMGM using a liquid oxidation–reduction approach were investigated in this study. GNs with layer number ranging from 3 to 7, thickness of 1.1 nm, and sizes up to 1 μm × 2 μm were obtained and confirmed from scanning electron microscopy, transmission electron microscopy and atomic force microscopy images. The results of Fourier transform infrared spectroscopy and X-ray photoelectron spectroscopy analysis show that, during the whole fabrication process, the generation and elimination of oxygen-containing groups or reestablishment of the conjugated graphene network occur. The results of Raman spectroscopy and X-ray diffraction measurements show that the GNs possess an amorphous nanostructure. The as-produced GNs with adjustable electrical resistivity can be easily transferred into well distributed bulk materials by freeze-dried strategy. This cost-effective synthesis strategy of GNs from abundant NMGM provides great potential for the commercialization of GN production.
1. Introduction
Graphene is a monolayer of carbon atoms in a closely packed honeycomb two-dimensional (2D) lattice, and has attracted tremendous scientific attention in recent years. Especially this 2D material exhibits unique physical, chemical, electrical and mechanical properties, which make graphene and its derivatives promising for potential applications in many technological fields, such as chemical screening, sensors, low density structural materials, quantum effects, thermal interface materials, electronic materials, energy storage and energy conversion.1–3 Graphene can be prepared through numerous methods, such as chemical oxidation reduction, mechanical exfoliation, thermal exfoliation of graphite oxide, liquid-phase exfoliation and supercritical CO2 processing techniques.4–10 Among the various methods, chemical reduction of graphene oxide (GO) to reduced graphene oxide (RGO) is unique and attractive because of its capability of producing single-layer graphene in a large scale and at a relatively low cost. Furthermore, GO and RGO are processible and they can be fabricated or self-assembled into macroscopic materials with controlled compositions and microstructures for practical applications.11–14Current commercialized graphene fabricated by chemical oxidation reduction is mainly produced from natural graphite, which is found widely throughout the world and is a kind of frequently used natural material. On earth there is a massive storage of natural graphite minerals, including flake graphite (FG) and microcrystalline graphite (MG). The grain size of FG is usually larger than 10 μm, however, the concentration of carbon is very low. In contrast, the MG usually has a small grain size of <1 μm but a high carbon content. There are large and widespread deposits of natural microcrystalline graphite minerals (NMGM) in China. The largest mine, with a reserve of 30 million tons, is located in the Lutang area of Chenzhou, Hunan province. Other major deposits are known in the provinces of Inner Mongolia (Bayan Nur), Hubei (Shiyan), Fujian (Sanming), Jilin (Panshi), and Heilongjiang (Yichun). The grade of some European deposits is about 55%, while the counterpart of some MG deposits in China is 50–85%.15,16
However, NMGM was inefficiently utilized and seriously wasted due to the low-level technical process. The utilization of NMGM is currently confined to a preliminary level such as raw materials for pencil lead, crucible, and carburant for steel making. Investigations into further applications of NMGM will greatly promote the development of the MG industry. Recently MG has been applied as anode material of lithium-ion battery, refractory, supercapacitor, isotropic graphite and microwave absorbing materials as a cheap and abundant resources.17–26 Therefore, a large number of submicron or nano-carbon sources with high processability, large surface area, high activity, and reasonable electrical conductivity should be developed to meet the demand of the industrial applications aforementioned.
Up to now, the research on preparation of graphene-like nanosheets (GNs) is mainly related to FG, a kind of frequently used natural material. However, NMGM, which is a type of resourceful and cheap natural graphite with high degree of graphitization and consists of many microcrystals of different orientations, should be a potential raw material to produce GNs, however, there's few research has been conducted on preparation of GNs from NMGM. The main reason is that the impurities in NMGM are always hard to be eliminated and the grain size of MG is much smaller than that of FG. The carbon content of NMGM can be higher than 99% as the development of the purification technology goes on, and the smaller grain size of NMGM may lead to higher reactivity, so MG should be oxidized more easily than FG and graphene can be fabricated from NMGM. Fortunately, a few studies on the preparation of GNs by NMGM have initiated. Wang Junying and coworkers produced high-quality GNs at a high yield of >70% through a scalable electrochemical & mechanical exfoliation approach using NMGM directly.27 Xian Haiyang and coworkers prepared GNs from MG by a low-temperature exfoliation method, and the supercapacitive behaviors of the GNs have also been investigated.28,29 Lin Shaofen and coworkers reported a facile and effective technique for the large-scale production of nano-sized graphene sheets via subjecting the MG to ball milling. The products consist of single- or few-layer graphene with lateral dimensions concentrated in the range of 100–200 nm.30 Among them, explanations on the decrease of impurities within NMGM as well as the transformation of both structure and composition of GNs have not been found. However, methods of liquid oxidation–reduction can compensate the disadvantages of methods including electrochemical & mechanical exfoliation, low-temperature exfoliation and ball milling due to the ease of eliminating the impurities deposited in the raw materials. Furthermore, the fabrication of graphene via liquid oxidation–reduction methods is the most promising approach towards large scale production.
Mass production of GNs from graphite at a low cost and a high efficiency is essential for its practical application since there is huge storage of natural graphite minerals on earth. To the best of our knowledge, most of the GNs presented were obtained based on the FG instead of NMGM since it has great difficulty removing the impurities of NMGM through purification technology. Therefore, if the low-cost NMGM can directly be utilized for preparing GNs with good performance and without going through the purification treatment from graphite minerals, it can provide an economic way to realize the comprehensive utilization and widely usage of NMGM. The aim of this study is to use a cost-effective method to prepare graphene with microcrystalline graphite mineral resources that are of low utilization rate, low level of deep processing technology but rich reserves, which will effectively improve the additional value of microcrystalline graphite and provide the basis for the utilization for high value of microcrystalline graphite. And the waste can be changed into resources. In the present work, we prepared GNs from NMGM by liquid oxidation–reduction method, and the microstructure, morphology, layers and compositions of the as-prepared GNs have also been investigated and the formation mechanisms for the liquid oxidation–reduction of GNs from NMGM was also discussed.
2. Experimental
2.1 Chemicals and materials
NMGM (chemical compositions presented in Table 1) with approximately 83.08 wt% fixed carbon content was used as raw material, obtained from Chenzhou, Hunan province, China.16 Concentrated sulfuric acid (H2SO4, 98%), potassium permanganate (KMnO4), hydrochloric acid (HCl, 36%), sodium nitrate (NaNO3) and hydrogen peroxide (H2O2, 30%) were purchased from Hengyang Kaixin Chemical Reagent Co. Ltd. Sodium borohydride (NaBH4), sodium hydroxide (NaOH) and polyvinylpyrrolidone (PVP) were provided by Guangfu Fine Chemical Research Institute, Fengchuan Chemical Reagent Technology Co. Ltd. and Aladdin Industrial Corporation respectively. Distilled water was processed by our lab. These chemicals were used without further purification.| Index | C | SiO2 | Al2O3 | Fe2O3 | CaO | MgO | TiO2 | Na2O | K2O | MnO2 |
|---|---|---|---|---|---|---|---|---|---|---|
| Content (%) | 83.08 | 5.95 | 3.39 | 0.44 | 0.40 | 0.30 | 0.043 | 0.26 | 0.41 | 0.0097 |
2.2 Fabrication of GNs
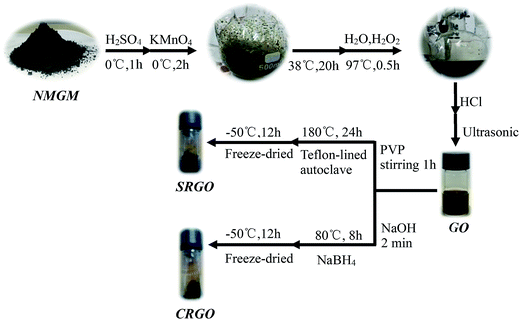
Large pieces of NMGM were crushed and dry-grounded by jaw crusher. The ground mineral particles were dry-screened using the standard sieve (200 mesh) and the NMGM with narrow particle size distribution were used as reagents in the chemical fabrication process. There are three stages in the fabrication process of GNs from NMGM by liquid oxidation–reduction method, including the oxidation of NMGM, the stripping of natural microcrystalline graphite oxide and the reduction of GO. The illustration for the fabrication process can be seen in Fig. 1.2.3 Instruments and characterizations
The field emission scanning electron microscopy (FE-SEM) and transmission electron microscopy (TEM) images were obtained with the TESCAN MIRA3 LMU type and JEM-2100F type, respectively. The usage of the TESCAN MIRA3 LMU type scanning electron microscope is equipped with Oxford X-Max20 Energy spectrum system. The atomic force microscopic (AFM) images of GNs were measured using a scanning probe microscope (PicoPLws, Molecularlmaging). The samples used for SEM, TEM and AFM characterizations were deposited on silicon wafers, mica sheets and copper mesh and screen, respectively. Fourier transform infrared spectroscopy-attenuated total reflectance (FTIR-ATR) spectra were recorded on a Fourier transform infrared spectrometer (WQF-510A). X-ray diffraction (XRD) patterns were recorded on D/max2550VB+ X-ray diffractometer using Cu Kα radiation (k = 0.154178 nm) with 40 kV scanning voltage, 40 mA scanning current and scanning range from 5° to 80°. Raman spectra were recorded on a LabRAM HR800 multichannel confocal microspectrometer with 514.5 nm Ar2 laser excitation. X-ray photoelectron spectra (XPS) were measured on a K-Alpha 1063 photoelectron spectrometer using Al Kα (hν 1486.6 eV) X-ray as the excitation source. A four-probe resistivity meter (RTS-8, Four-probe TECH, China) was used to measure the electrical resistivity of the samples.3. Results and discussion
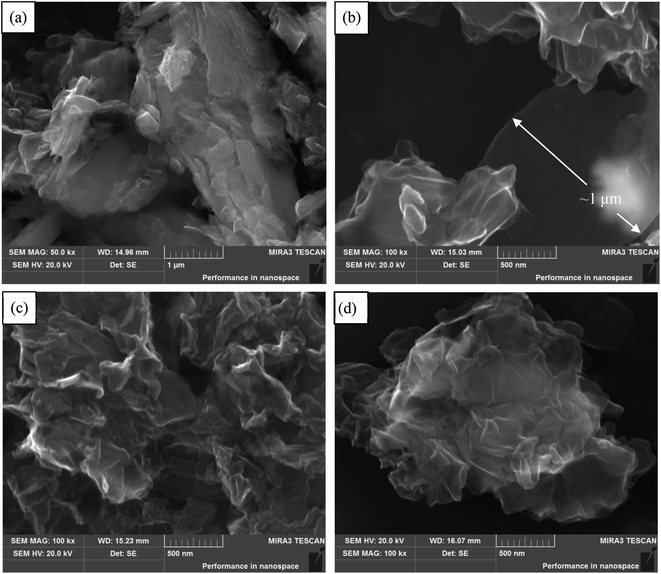
Our strategy for improving comprehensive utilization and broadening usage of NMGM is different from the published ones since producing high-quality graphene from low cost graphite minerals does not involve serious environmental pollution and complicated purification process. For example, highly toxic hydrogen fluoride (HF) was often adopted to remove the complex silicate impurities of the minerals to purify NMGM at the cost of sacrificing the environment.16 The advantages of the liquid oxidation–reduction method is that the reduction process enable the defects to be repaired and oxygen-containing groups to be removed, and π-conjugation to be reestablished, compared with the electrochemical & mechanical exfoliation, low-temperature exfoliation and ball milling method preparing GNs from NMGM. The as-produced GNs can be easily transferred into well distributed bulk materials by freeze-dried approach for further processing and thus applications. We believe these are the reasons the present fabrication can produce graphene sheets with excellent qualities in terms of sizes, purity, and morphology.We have found that the size of the GNs produced from NMGM is around 1 μm × 2 μm, which is larger than the GNs from FGs. The size of graphene sheets were characterized with SEM. The morphologies of NMGM, GO, SRGO, and CRGO were analyzed by SEM (Fig. 2). As seen in Fig. 2(a), when SEM photo is enlarged by 50![[thin space (1/6-em)]](https://www.rsc.org/images/entities/char_2009.gif) 000 times, the image shows that microscopic particles of NMGM are in laminar shape, and larger particles are composed of tiny laminar particles, and the smaller particles of graphite are absorbed onto the surface of the larger sized graphite particles with arbitrary direction. The smaller graphite particle, after oxidation, is stripped from the larger sized graphite particle. The thick layer graphite is ripped from the flake with curled edges, and the lateral dimensions of the flakes are about 1 μm × 2 μm, as shown in Fig. 2(b). Fig. 2(c) shows that the tiny GO flakes are connected with each other to present a random network structure, and the curled edges become less than GO after solvothermal reduction. As seen in Fig. 2(d), the area of CRGO flakes becomes larger and the edge is much curlier when using NaBH4 as a reducing agent. The lateral dimensions of the obtained GNs are about 1 μm × 2 μm. Compared with GO, the thickness of CRGO has been increased since the graphene layers reestablished an orderly stack due to the removal of oxidized functional groups.32,33 Fig. S1† also show the SEM photo of CRGO with different area. As we all know, the sheet size of GNs prepared from NMGM is smaller than that of GNs prepared from FG. The sheet size of GNs obtained by liquid oxidation–reduction is larger than that of GNs prepared from NMGM by electrochemical & mechanical exfoliation, low-temperature exfoliation and ball milling. These results all indicate that graphene sheets with up to 1 μm × 2 μm were fabricated from NMGM by liquid oxidation–reduction method.
000 times, the image shows that microscopic particles of NMGM are in laminar shape, and larger particles are composed of tiny laminar particles, and the smaller particles of graphite are absorbed onto the surface of the larger sized graphite particles with arbitrary direction. The smaller graphite particle, after oxidation, is stripped from the larger sized graphite particle. The thick layer graphite is ripped from the flake with curled edges, and the lateral dimensions of the flakes are about 1 μm × 2 μm, as shown in Fig. 2(b). Fig. 2(c) shows that the tiny GO flakes are connected with each other to present a random network structure, and the curled edges become less than GO after solvothermal reduction. As seen in Fig. 2(d), the area of CRGO flakes becomes larger and the edge is much curlier when using NaBH4 as a reducing agent. The lateral dimensions of the obtained GNs are about 1 μm × 2 μm. Compared with GO, the thickness of CRGO has been increased since the graphene layers reestablished an orderly stack due to the removal of oxidized functional groups.32,33 Fig. S1† also show the SEM photo of CRGO with different area. As we all know, the sheet size of GNs prepared from NMGM is smaller than that of GNs prepared from FG. The sheet size of GNs obtained by liquid oxidation–reduction is larger than that of GNs prepared from NMGM by electrochemical & mechanical exfoliation, low-temperature exfoliation and ball milling. These results all indicate that graphene sheets with up to 1 μm × 2 μm were fabricated from NMGM by liquid oxidation–reduction method.
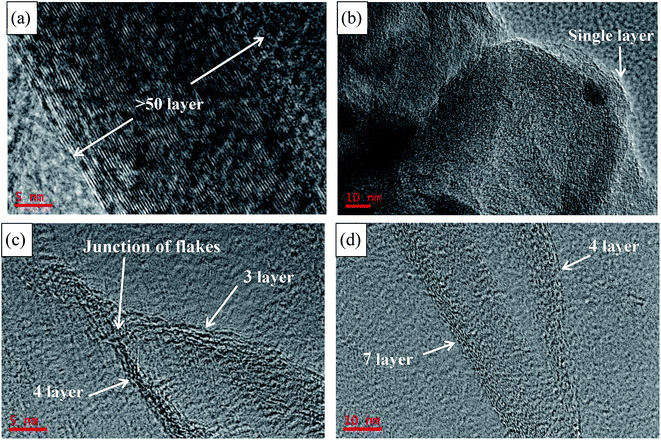
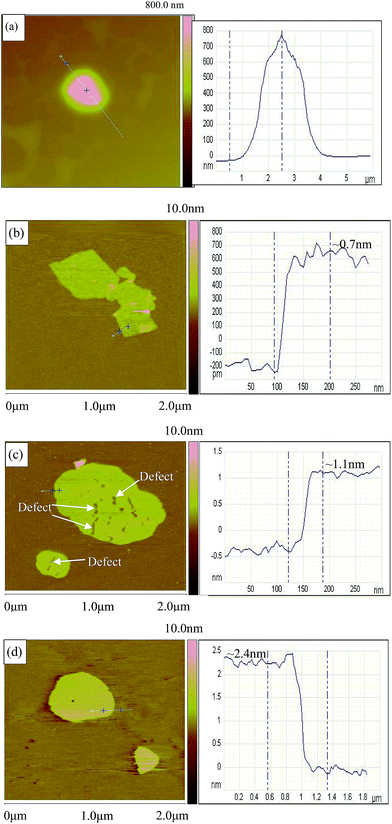
TEM and AFM clearly show that GNs consist of thin graphene-based sheets on the nanoscale. High-resolution TEM images of NMGM, GO, SRGO and CRGO present the enlarged wrinkles of graphene layers, shown in Fig. 3. Analysis of the edges of graphene in TEM shed light on the thickness of the graphene layers. The layer thickness, which was more than fifty layers in the NMGM, decreased to single layer after oxidation. The number of layer increased slightly but was still approximately 3–7 wrinkled monolayer graphene after reduction, and it can be seen clearly in Fig. 3(c) that the atoms were not arranged layer by layer at the junction of flakes. The reason for the increasing of layers has been explained in the discussion of SEM. The low-magnification TEM images of samples (Fig. S2†) indicate that these ultrathin nanosheets have wrinkled paper-like structures. AFM characterization has been one of the most direct methods of measuring the degree of exfoliation to graphene level after the dispersion of the powder in a solvent. The detailed thickness of GO, SRGO and CRGO sheets were measured by AFM, and Fig. 4(a)–(d) present AFM images of low concentrate NMGM, GO, SRGO and CRGO ethanol solution with ultrasonic dispersed for 2 hours, respectively. NMGM is granular and has a particle size of several hundred nanometers. The thickness of GO sheet is ∼0.7 nm, indicating the GO sheet is a single layer graphene oxide, as suggested by previous research.34 The thickness of SRGO sheet and CRGO sheet, are ∼1.1 nm and ∼2.4 nm, and the surface size of them are larger than GO sheet. Also, the defects which are probably formed by connection of graphene sheets and PVP molecules can be seen in Fig. 4(b), which agree well with the analysis results of SEM and TEM images.35
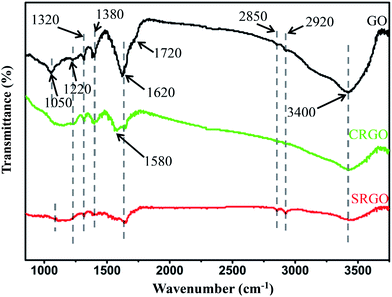
Fewer layers, larger size, and thinner thickness are the important features to measure the quality of graphene. Combined with SEM, TEM and AFM analysis, few-layers (<7 layers) GNs with sizes up to 1 μm × 2 μm and ∼1.1 nm thickness were fabricated from NMGM by liquid oxidation–reduction method. In order to gain further insight into the chemical structure changes, FTIR was employed to analyze the existence of most functional groups. Fig. 5 shows the FTIR spectra of GO, SRGO, and CRGO, and Table 2 summarizes the peak positions and their assignments. The peaks of GO centered at 1050, 1220 (1320), 1620, 1720, and 3400 cm−1 were attributed to the C–O–C, C–OH, C![[double bond, length as m-dash]](https://www.rsc.org/images/entities/char_e001.gif) C, C
C, C![[double bond, length as m-dash]](https://www.rsc.org/images/entities/char_e001.gif) O, O–H functionalities, respectively, which are consistent with their characteristic vibration absorption peaks.36 After reduction, the peaks for all of the oxygen-containing groups become weak or nearly absent for SRGO and CRGO compared with GO, indicating massive elimination of the oxygen-containing groups during the reduction treatment.
O, O–H functionalities, respectively, which are consistent with their characteristic vibration absorption peaks.36 After reduction, the peaks for all of the oxygen-containing groups become weak or nearly absent for SRGO and CRGO compared with GO, indicating massive elimination of the oxygen-containing groups during the reduction treatment.
| Assignment | GO | SRGO | CRGO |
|---|---|---|---|
| C–O–C str vibr | 1050 | 1060 | — |
| C–OH (COOH) str vibr | 1220, 1320 | 1220, 1320 | 1220, 1320 |
C![[double bond, length as m-dash]](https://www.rsc.org/images/entities/char_e001.gif) C str vibr C str vibr |
1620 | 1630 | 1580, 1620 |
C![[double bond, length as m-dash]](https://www.rsc.org/images/entities/char_e001.gif) O str vibr O str vibr |
1720 | — | 1710 |
| C–H bend vibr/str vibr | 1380/2850, 2920 | 1380/2850, 2920 | 1380/2850, 2920 |
| O–H str vibr | 3400 | 3420 | 3400 |
The purity of the GNs product compared with the NMGM was also analyzed by elemental analysis, SEM with energy dispersive X-ray spectrometry (EDS), as shown in Fig. S3 and S4.† Elemental analysis showed that the carbon content of the NMGM is around 49.84 wt% accompanying with 50 wt% of other elements such as Al, Si and O (silicate/silica). The carbon content of GNs product from NMGM increases to 60.48 wt%. Furthermore, XPS was further used to probe the chemical compositions of NMGM and GNs sample. Existence of the oxygen functional groups and nitrogen doping and other elements were also confirmed by XPS. Full spectrum in Fig. 6(a) indicates the existence of Al, Si, C, O and Na elements in NMGM. Compared to the original ore, the Al2p and the Si2p disappear and the intensities of C1s and O1s in the GO, SRGO and CRGO are seriously weakened, suggesting the removal of impurities in the fabrication process involving oxidation and reduction. The reduction effect can be quantitatively characterized by the atomic ratio of carbon to oxygen (Table 3). After oxidation, the C/O ratio decreased from 4.5 for NMGM to 1.4 for GO, manifesting the introduction of massive oxygen-containing functional groups in GO. After reduction, the C/O ratio increased from 1.4 for GO to 6.5 for SRGO, which is higher than that of CRGO (3.4).
 | ||
| Fig. 6 XPS spectra of NMGM, GO, CRGO and SRGO (a) and C1s XPS spectra of NMGM (b), GO (c), CRGO (d) and SRGO (e) and N1s XPS spectrum of SRGO (f). | ||
| Samples | C (at%) | O (at%) | C/O | C–C/C![[double bond, length as m-dash]](https://www.rsc.org/images/entities/char_e001.gif) C (at%) C (at%) |
C–O (at%) | C![[double bond, length as m-dash]](https://www.rsc.org/images/entities/char_e001.gif) O (O–C O (O–C![[double bond, length as m-dash]](https://www.rsc.org/images/entities/char_e001.gif) O) (at%) O) (at%) |
C–O–C (at%) | C–C/C–N (at%) |
|---|---|---|---|---|---|---|---|---|
| NMGM | 77.94 | 17.36 | 4.5 | 92.85 | — | 7.15 | — | — |
| GO | 57.44 | 40.93 | 1.4 | 44.41 | 25.39 | 20.19 | — | — |
| SRGO | 82.40 | 12.65 | 6.5 | 66.08 | — | — | 13.72 | 20.20 |
| CRGO | 67.71 | 19.95 | 3.4 | 90.82 | — | 9.18 | — | — |
The high-resolution C1s spectra of NMGM were deconvoluted into four different peaks that correspond to carbon atoms assuming different binding states [Fig. 6(b)–(e)]. The peaks centered at 284.7, 285.5 and 285.7 eV can be assigned to C–C functional groups, 289 eV to O–C![[double bond, length as m-dash]](https://www.rsc.org/images/entities/char_e001.gif) O functional groups. In the case of C1s spectra of GO, four peaks can be fitted, corresponding to the sp2 C
O functional groups. In the case of C1s spectra of GO, four peaks can be fitted, corresponding to the sp2 C![[double bond, length as m-dash]](https://www.rsc.org/images/entities/char_e001.gif) C at 283.3 eV, C–C at 284.8 eV, C–O at 286.8 eV and C
C at 283.3 eV, C–C at 284.8 eV, C–O at 286.8 eV and C![[double bond, length as m-dash]](https://www.rsc.org/images/entities/char_e001.gif) O at 288.3 eV. The attendance of these peaks indicate that various types of oxygen functionalities exist in the structure of GO. In contrast, the C1s spectra of SRGO revealed that the intensities of the bands corresponding to oxygen-containing groups were dramatically reduced, confirming the success of the reduction process. The peaks centered at 284.7, 285.9 and 287.2 eV can be assigned to the C–C, C–N, C–O–C functional groups, respectively. The C1s spectra of CRGO indicated that the C–O almost disappeared and most of C
O at 288.3 eV. The attendance of these peaks indicate that various types of oxygen functionalities exist in the structure of GO. In contrast, the C1s spectra of SRGO revealed that the intensities of the bands corresponding to oxygen-containing groups were dramatically reduced, confirming the success of the reduction process. The peaks centered at 284.7, 285.9 and 287.2 eV can be assigned to the C–C, C–N, C–O–C functional groups, respectively. The C1s spectra of CRGO indicated that the C–O almost disappeared and most of C![[double bond, length as m-dash]](https://www.rsc.org/images/entities/char_e001.gif) O were removed effectively. The peaks centered at 283.6 and 285.7 eV can be assigned to the sp2 C
O were removed effectively. The peaks centered at 283.6 and 285.7 eV can be assigned to the sp2 C![[double bond, length as m-dash]](https://www.rsc.org/images/entities/char_e001.gif) C and C–C functional groups.37–41 XPS O1s spectra in Fig. S5 and Table S1† depict the detail of the oxygen functionalities for NMGM, GO, SRGO and CRGO. It can be concluded that the oxidation, and exfoliation and reduction processes have changed the number of surface species. The results of O1s spectra are corroborated by C1s spectra.
C and C–C functional groups.37–41 XPS O1s spectra in Fig. S5 and Table S1† depict the detail of the oxygen functionalities for NMGM, GO, SRGO and CRGO. It can be concluded that the oxidation, and exfoliation and reduction processes have changed the number of surface species. The results of O1s spectra are corroborated by C1s spectra.
The full XPS spectra for SRGO shows a distinguished N signal at about 400.0 eV [Fig. 6(a)], confirming the nitrogen-doping of graphene. The N1s spectrum of SRGO exhibits only one peak at ∼400.0 eV, and deconvolution of the N1s spectra [Fig. 6(f)] for the exhausted samples shows two peaks with their binding energy equal to 399.8 eV and 401.9 eV. The first peak represents nitrogen involved in C–N (from amines or amides), whereas the second peak can be assigned to C–N+ (from quaternary nitrogen) or NH4+, further demonstrating that the nitrogen atoms came from PVP.
It is obvious that the process of GNs fabricated from NMGM using liquid oxidation–reduction method can be divided into oxidation, stripping, and reduction stages. As shown in Tables 2 and 3, analyses from both FTIR and XPS clearly suggest that considerable changes of oxygen-containing groups, chemical states and element compositions, such as C, Al, Si and O (complex silicate and silica) occurred in the three stages. The C/O atomic ratios for raw mineral and GO calculated from the corresponding peak areas of the XPS are determined as 4.5 and 1.4, respectively, showing a complete oxidation degree of the GO. The reason is that, in the oxidation stage of NMGM, oxidation attack initiates on the carbon atoms at the edges or defects of NMGM, forming the hydroxyl groups. With the progress of oxidation, more hydroxyl groups are generated on the basal planes. Simultaneously, the formed hydroxyl groups at the edges are continuously oxidized to the carbonyl groups in the forms of the ketone and/or quinone groups, and the neighboring hydroxyl groups on the basal planes condense to the epoxy groups by dehydration in the strong acid environment. The relative atomic concentrations of C–O and C![[double bond, length as m-dash]](https://www.rsc.org/images/entities/char_e001.gif) O (O–C
O (O–C![[double bond, length as m-dash]](https://www.rsc.org/images/entities/char_e001.gif) O) in GO is 25.39% and 20.19%, indicating the complete oxidation of the edges that form hydroxyl and carbonyl groups. Then, the ketone groups at the edges are further oxidized to the carboxyl groups with the six-member carbon ring opening in the presence of excess KMnO4 and concentrated H2SO4.42 Therefore, the oxygen-containing groups of NMGM oxide formed in the oxidation stage.
O) in GO is 25.39% and 20.19%, indicating the complete oxidation of the edges that form hydroxyl and carbonyl groups. Then, the ketone groups at the edges are further oxidized to the carboxyl groups with the six-member carbon ring opening in the presence of excess KMnO4 and concentrated H2SO4.42 Therefore, the oxygen-containing groups of NMGM oxide formed in the oxidation stage.
Solvothermal and chemical reduction strategy were used to obtain GNs. The C/O atomic ratios of SRGO is 6.5, which is significantly higher than those of the raw minerals and RGO.27,28 The relative atomic concentrations of C–O–C and C–C/C–N in SRGO is 13.72% and 20.20%. Results show that oxygen-containing groups of GO were remarkably deoxygenated owing to their poor thermal stability in the solvothermal reduction reactions. During the reduction stage of GO, we tentatively speculate the deoxygenation reaction as follow. First, autogenic pressure at 180 °C facilitates large amounts of free hydrogen radicals divorced from PVP, which is a dehydrogenation reaction process. Then, the deoxygenation of epoxide, carbonyl, carboxyl and hydroxyl on GO is promoted by the high temperature and the self-generated pressure in the sealed reaction autoclave. The superheated PVP under the hydrothermal conditions behaves like a strong electrolyte with a high diffusion coefficient and dielectric constant, and facilitates the bond cleavage of oxygen functional groups.41,43 The subsequent annealing step would remove most of the functional groups, partially restoring π-conjugation. Besides, the introduction of PVP can assemble the wonderful 2D graphene sheets into bulk 3D state, which further confirmed random network structure in Fig. 2(c). In addition, NaBH4, a common reducing agent, can reduce carboxyl, carbonyl and epoxy groups into hydroxyl group. However, it is difficult to eliminate the hydroxyl group.41 The C/O of CRGO (3.4) also confirmed this mechanism. Obviously, solvothermal reduction is more effective than that of NaBH4.
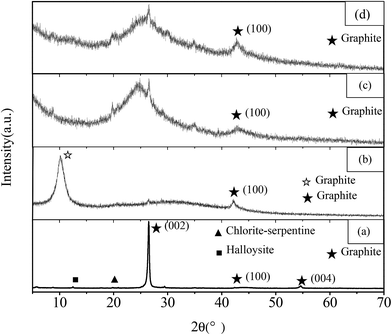
We also monitored the structural deformation during the preparation process of GNs by X-ray diffraction, which demonstrates that amorphous structure is achieved during the fabrication process of GNs from NMGM. The powder XRD patterns of NMGM, GO, SRGO and CRGO are presented in Fig. 7. The (002), (100) and (004) diffraction peaks of graphite in Fig. 7(a) reveal that the NMGM has a typical graphite-2H structure. The calculation of the NMGM particle size by Scherrer formula [D = Kγ/B![[thin space (1/6-em)]](https://www.rsc.org/images/entities/char_2009.gif) cos
cos![[thin space (1/6-em)]](https://www.rsc.org/images/entities/char_2009.gif) θ, for the C (002) crystal plane reflection peak] gives the value of 23.56 nm. It can be deduced that the NMGM consists of 69 atom layers (a single layer of carbon atom in a closely packed honeycomb two dimensional lattice is about 0.34 nm). The results of XRD are in agreement with the SEM and TEM analyses. Besides, the NMGM ore contains impurities such as halloysite and chlorite–serpentine. The disappearance of the graphite peaks and the appearance of the graphite oxide peak (2θ = 9.5°) in XRD pattern of GO [Fig. 7(b)], demonstrates that the graphite is oxidated completely. In Fig. 7(b) and (c), the disappearance of the graphite (002) peak shows that the stacking structure of the graphite layer has disappeared, which indicates that the graphite layer has been stripped away. Compared with Fig. 7(b)–(d) show that the graphite oxide peak, as indicated by the broad peak between 2θ of 20° and 30°, which is the (100) diffraction peaks of graphite.44,45
θ, for the C (002) crystal plane reflection peak] gives the value of 23.56 nm. It can be deduced that the NMGM consists of 69 atom layers (a single layer of carbon atom in a closely packed honeycomb two dimensional lattice is about 0.34 nm). The results of XRD are in agreement with the SEM and TEM analyses. Besides, the NMGM ore contains impurities such as halloysite and chlorite–serpentine. The disappearance of the graphite peaks and the appearance of the graphite oxide peak (2θ = 9.5°) in XRD pattern of GO [Fig. 7(b)], demonstrates that the graphite is oxidated completely. In Fig. 7(b) and (c), the disappearance of the graphite (002) peak shows that the stacking structure of the graphite layer has disappeared, which indicates that the graphite layer has been stripped away. Compared with Fig. 7(b)–(d) show that the graphite oxide peak, as indicated by the broad peak between 2θ of 20° and 30°, which is the (100) diffraction peaks of graphite.44,45
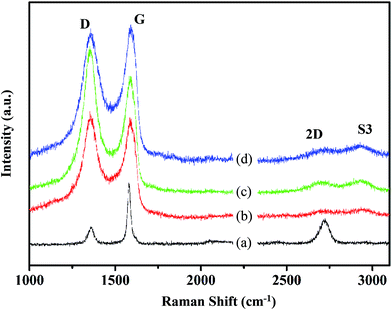
Raman spectroscopy was used to obtain more information about the structure of the synthesized graphene. The Raman spectra of NMGM, GO, SRGO and CRGO are associated with a typical D band and G band around 1360 cm−1 and 1580 cm−1, respectively (as shown in Fig. 8). The D band is due to the breathing mode of κ-point photons of A1g symmetry, and the G band is due to the first-order scattering of E2g phonons by sp2 carbon atoms. The presence of the D-band indicates defects in the graphene layer, primarily attributed to the presence of sp3-bonded carbon atoms. The G-band resulted from sp2-bonded carbon atoms in the graphene layer. Furthermore, the average crystallite size (La) of the defect-free domains within the graphene was calculated using the equation43,46,47
| La = 2.4 × 10⁻¹⁰ × λlaser4 × IG/ID | (1) |
| Samples | ID/IG | La (nm) |
|---|---|---|
| NMGM | 0.239 | 4.004 |
| GO | 1.280 | 21.442 |
| SRGO | 1.420 | 23.788 |
| CRGO | 1.150 | 19.265 |
The electrical properties of the samples are shown in Table 5. The electrical resistivity of GO is 0.76 × 10⁵ Ω cm, which is much higher than that of NMGM (7.1 Ω cm), SRGO (3.2 Ω cm) and CRGO (9.0 Ω cm). This indicates that lots of oxygen-containing groups were introduced into GO. The results also indicate that solvothermal reduction is more effective in restoring the π-conjugated structure of graphene than chemical reduction.48 Therefore, the electrical properties of GNs can be adjusted by controlling the oxidation degree of NMGM and also the reduction degree of GO.
| Sample | NMGM | GO | SRGO | CRGO |
|---|---|---|---|---|
| Resistivity (Ω cm) | 7.1 | 0.76 × 10⁵ | 3.2 | 9.0 |
The disperse and homogeneous graphene dispersion we prepared is 500 mL, taking 5 mL to freeze drying and the data obtained is shown in Table 6. After taking the arithmetic average, every 5 mL graphene dispersion contains 14 mg graphene, and the productivity:
| η = MSRGO/MNMGM = 14 mg × 100/1500 mg = 93.3%. |
| Samples | 1 | 2 | 3 | 4 | 5 | 6 | 7 | 8 | 9 | 10 |
|---|---|---|---|---|---|---|---|---|---|---|
| Weight (mg) | 14 | 13 | 13 | 14 | 15 | 14 | 15 | 14 | 14 | 14 |
In this study, 1.4 g graphene is fabricated from 1.5 g graphite.
According to the above investigation, the preparation process can be divided into oxidation, stripping, and reduction stages. Among them, chemical reaction occurs in the oxidation, and reduction stages, while the stripping stage is a physical process. Therefore, the critical stages are the oxidation and reduction process of GO. The schematic structure evolutions of the GNs prepared from NMGM is portrayed in Fig. 9 and S6.†
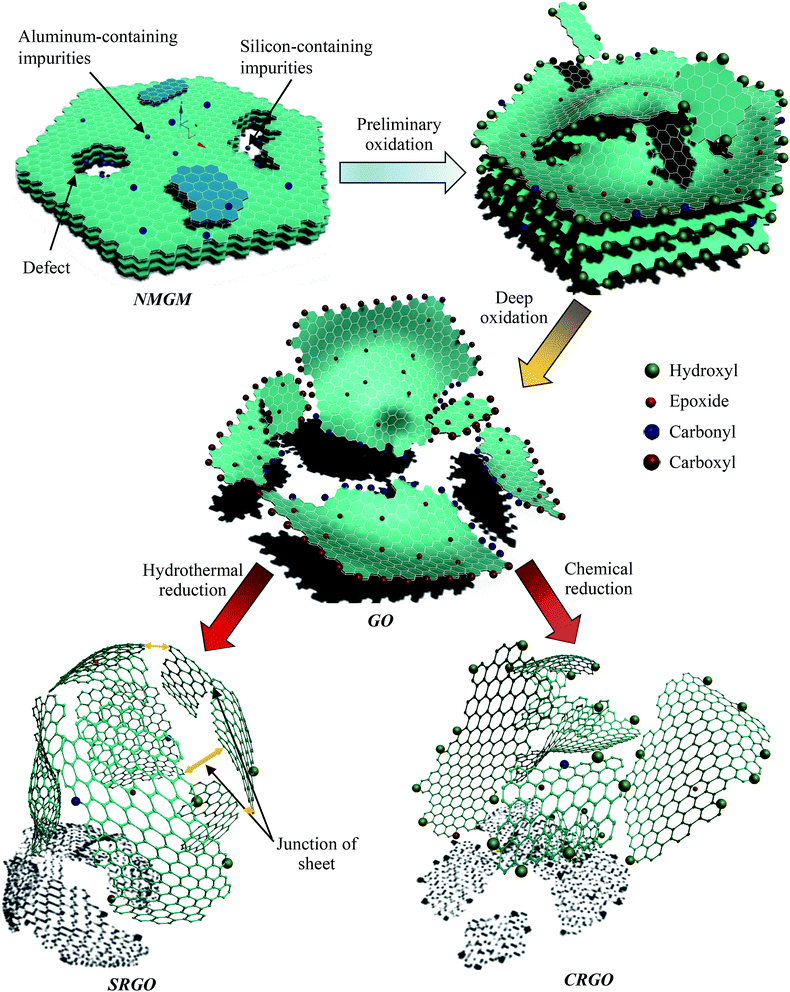 | ||
| Fig. 9 The schematic structure evolutions of GNs prepared by the liquid oxidation–reduction method from NMGM. The oxidation stage of NMGM. Hydroxyl group, carbonyl and carboxyl group and epoxy group formed in this stage. In general, the electron donating groups (i.e., hydroxyl and epoxy) form before the electron withdrawing groups (i.e., the carbonyl and carboxyl groups). It is important to note that the formation process of carboxyl groups is relatively slower compared with that of the carbonyl groups, because the oxidant is consumed by the precedent fast oxidation process. Parallel to the sequential oxidation is the dehydration that forms the epoxy groups once the neighboring hydroxyl groups emerge.37 Moreover, metal oxides (Fe2O3, CaO, K2O, Na2O, TiO2, MgO and MnO) in the NMGM would react with H2SO4 and most of metallic oxides in complicated silicate minerals were dissolved in the solutions as salt during the treatment. The complicated silicate structures of the impurities were destroyed by the interaction of NMGM with H2SO4, and the metal oxides in it were removed in form of soluble salts as reactions proceeded. Most of the impurities can be removed by washing with water after the oxidation reaction, but the reaction mainly took place on the interface of the sulphuric acid and graphite particles. The reduction stage of GO. The deoxygenation of epoxide, carbonyl, and hydroxyl on GO is removed by chemicals or the high temperature and the self-generated pressure. Partial explanation has been displayed in the analysis of FTIR and XPS. The complete reduction from GO to GNs is hard to achieve because the GO sheets with a high concentration of defects are difficult to fully deoxygenate and the defects themselves are difficult to heal by post-treatment. | ||
We compare the differences between natural flake graphite (FG) and natural microcrystalline graphite (MG), as well as the graphene oxide (GO) and the reduced graphene oxide (RGO) prepared by the same method. We label the graphene oxide prepared with FG and MG as the raw material with F-GO and M-GO, the solvothermal reduced graphene oxide with F-SRGO and M-SRGO, and the chemical reduced graphene oxide with F-CRGO and M-CRGO, respectively. In the SEM image and the AFM image (shown in Fig. S6 and S7†) comparing FG with MG, it is found that FG crystal has a sheet structure with a particle size of tens of micrometers, while MG has a granular structure with a particle size of several micrometers. Meanwhile, the surface of FG crystal is more smooth and has obvious anisotropy, which directly lead to the difference in the morphology of the graphene prepared. The sheet of F-GO is larger with a lateral dimension of tens of microns, but the thickness of the sheet is much thinner than that of FG. While the lateral dimension of the sheet of M-GO is only a fraction of a micron, and the thickness is thinner than that of F-GO which is only 1.1 nm with a more obvious edge curl. It can be seen from the figure that the sheet area of the graphene prepared with microcrystalline graphite as the raw material is smaller, and the thickness is thinner with a higher curl degree. From the XRD graph (shown in Fig. 8 and 9) comparing both, it is found that MG contains a variety of impurities, including chlorite–serpentine and halloysit, while the purity of FG graphite is higher. Compared to MG, the peak of the graphite oxide slightly moves to left, and all the graphene prepared produce the broad peak which should be create by the reduced graphene oxide at a temperature near 2θ = 45°, and The GO and RGO prepared with microcrystalline graphite as the raw material have the (100) diffraction peak of the graphite crystal.
4. Conclusions
GNs were fabricated using NMGM instead of FG by liquid oxidation–reduction method. The GNs with layer numbers ranges from 3 to 7, thickness of 1.1 nm, and sizes up to 1 μm × 2 μm are obtained. The graphene products exhibit the features of large amounts of defects and possess an amorphous nanostructure. Most impurities of the NMGM were removed in the oxidation process and the carbon content increased after reduction of GO. The formation mechanism of GNs is mainly the generation and eliminating of oxygen-containing groups or re-establishing the conjugated graphene network. The GNs products fabricated by both the chemical and solvothermal reduced methods are similar in their dispersibility, chemical structures, thicknesses, and lateral dimensions. Furthermore, the exclusion of chemicals could affect the efficiency of the overall reaction. This facile approach without any purification greatly facilitates preparation of high-quality graphene from abundant graphite minerals for the commercialization of graphene production.Acknowledgements
This work is supported by National Natural Science Foundation of China (No. 51201022), China Postdoctoral Science Foundation (No. 2013M542555), the Science & Technology Program of Changsha (No. K1508005-11), open Fund of Hunan Province Key Laboratory of Safety Design and Reliability Technology for Engineering Vehicle (No. KF1509) and open Research Fund of the Hunan Province Higher Education Key Laboratory of Modeling and Monitoring on the Near-Earth Electromagnetic Environments (No. 20150109) in Changsha University of Science & Technology, and Hunan Provincial Innovation Foundation For Postgraduate (CX2016B399). W. X. appreciates the great effort of Jiaqi Wang (The University of Tennessee, Knoxville) for the helpful discussion and proofreading for improving the English writing quality of the manuscript.References
- K. Hu, D. D. Kulkarni, I. Choi and V. V. Tsukruk, Prog. Polym. Sci., 2014, 39, 1934–1972 CrossRef CAS.
- S. Shin and M. Kaviany, Phys. Rev. B: Condens. Matter Mater. Phys., 2011, 84, 4319–4322 Search PubMed.
- L. Ma, H. Niu, J. Cai, P. Zhao, C. Wang, Y. Lian, X. Bai and W. Wang, J. Mater. Chem. C, 2014, 2, 2272–2282 RSC.
- S. Stankovich, D. A. Dikin, R. D. Piner, K. A. Kohlhaas, A. Kleinhammes, Y. Jia, Y. Wu, S. T. Nguyen and R. S. Ruoff, Carbon, 2007, 45, 1558–1565 CrossRef CAS.
- J. Chen, B. Yao, C. Li and G. Shi, Carbon, 2013, 64, 225–229 CrossRef CAS.
- A. M. Dimiev and J. M. Tour, ACS Nano, 2014, 8, 3060–3068 CrossRef CAS PubMed.
- S. Dubln, S. Gilje, K. Wang, V. C. Tung, K. Cha, A. S. Hall, J. Farrar, R. Varshneya, Y. Yang and R. B. Kaner, ACS Nano, 2010, 4, 3845–3852 CrossRef PubMed.
- B. Shen, D. Lu, W. Zhai and W. Zheng, J. Mater. Chem. C, 2013, 1, 50–53 RSC.
- C. Nethravathi and M. Rajamathi, Carbon, 2008, 46, 1994–1998 CrossRef CAS.
- S. Stankovich, D. A. Dikin, G. H. Dommett, K. M. Kohlhaas, E. J. Zimney, E. A. Stach, R. D. Piner, S. T. Nguyen and R. S. Ruoff, Nature, 2006, 442, 282–286 CrossRef CAS PubMed.
- Y. Wu, N. Yi, L. Huang, T. Zhang, S. Fang, H. Chang, N. Li, J. Oh, J. A. Lee, M. Kozlov, A. C. Chipara, H. Terrones, P. Xiao, G. Long, Y. Huang, F. Zhang, L. Zhang, X. Lepro, C. Haines, M. D. Lima, N. P. Lopez, L. P. Rajukumar, A. L. Elias, S. Feng, S. J. Kim, N. T. Narayanan, P. M. Ajayan, M. Terrones, A. Aliev, P. Chu, Z. Zhang, R. H. Baughman and Y. Chen, Nat. Commun., 2015, 6, 6141 CrossRef CAS PubMed.
- D. He, Z. Peng, W. Gong, Y. Luo, P. Zhao and L. Kong, RSC Adv., 2015, 5, 11966–11972 RSC.
- Y. Zhang, Y. Huang, T. Zhang, H. Chang, P. Xiao, H. Chen, Z. Huang and Y. Chen, Adv. Mater., 2015, 27, 2049–2053 CrossRef CAS PubMed.
- F. Wu, A. Xie, M. Sun, Y. Wang and M. Wang, J. Mater. Chem. A, 2015, 3, 14358–14369 CAS.
- K. Shen, Z.-H. Huang, K. Hu, W. Shen, S. Yu, J. Yang, G. Yang and F. Kang, Carbon, 2015, 90, 197–206 CrossRef CAS.
- W. Xie, Z. Wang, J. Kuang, H. Xu, S. Yi, Y. Deng, T. Cao and Z. Guo, Int. J. Miner. Process., 2016, 155, 45–54 CrossRef CAS.
- S. Li, L. Ma, H. Long, X. Yu, H. Luo, Y. Wang, H. Zhu, Z. Yu, M. Ma and Q. Wei, Appl. Surf. Sci., 2016, 367, 473–479 CrossRef CAS.
- Y. Wei, Y. Jiang, N. Li, Z. Hu, X. He and X. Ouyang, Adv. Appl. Ceram., 2015, 114, 423–428 CrossRef CAS.
- H. Wang, Y. Li, T. Zhu, S. Sang and Q. Wang, Ceram. Int., 2014, 40, 11139–11148 CrossRef CAS.
- H. Wang, Y. Li, S. Sang, S. Jin, Y. Xu, K. Yang and S. Yu, Ceram. Int., 2014, 40, 15783–15793 CrossRef CAS.
- T. Wenmao, P. Qun, L. Yanyan and W. Nan, Int. J. Electrochem. Sci., 2012, 7, 11578–11587 Search PubMed.
- C. Sole, N. E. Drewett and L. J. Hardwick, Faraday Discuss., 2014, 172, 223–237 CAS.
- K.-J. Kim, T.-S. Lee, H.-G. Kim, S.-H. Lim and S.-M. Lee, Electrochim. Acta, 2014, 135, 27–34 CrossRef CAS.
- D. Deýlová, V. Vyskočil and J. Barek, J. Electroanal. Chem., 2014, 717–718, 237–242 CrossRef.
- K. Li, K. Shen, Z.-H. Huang, W. Shen, G. Yang, J. Yang and F. Kang, Fuel, 2016, 180, 743–748 CrossRef CAS.
- W. Xie, X. Zhu, S. Yi, J. Kuang, H. Cheng, W. Tang and Y. Deng, Mater. Des., 2016, 90, 38–46 CrossRef CAS.
- J. Wang, J. Huang, R. Yan, F. Wang, W. Cheng, Q. Guo and J. Wang, J. Mater. Chem. A, 2015, 3, 3144–3150 CAS.
- H. Xian, T. Peng, H. Sun and J. Wang, J. Mater. Sci., 2015, 50, 4025–4033 CrossRef CAS.
- S. F. Lin, F. X. Liu and G. H. Chen, RSC Adv., 2014, 4, 45885–45889 RSC.
- H. Xian, T. Peng, H. Sun and J. Wang, J. Mater. Sci.: Mater. Electron., 2014, 26, 242–249 CrossRef.
- W. S. Hummers and R. E. Offeman, J. Am. Chem. Soc., 1958, 80, 1339 CrossRef CAS.
- Y. Huang, Y. Qin, Y. Zhou, H. Niu, Z. Z. Yu and J. Y. Dong, Chem. Mater., 2010, 22, 4096–4102 CrossRef CAS.
- C. Liu, Z. Yu, D. Neff, A. Zhamu and B. Z. Jang, Nano Lett., 2010, 10, 4863–4868 CrossRef CAS PubMed.
- G. Shao, Y. Lu, F. Wu, C. Yang, F. Zeng and Q. Wu, J. Mater. Sci., 2012, 47, 4400–4409 CrossRef CAS.
- S. Pei and H.-M. Cheng, Carbon, 2012, 50, 3210–3228 CrossRef CAS.
- A. Kumar and M. Khandelwal, New J. Chem., 2014, 38, 3457 RSC.
- J. Zhu, R. Duan, Y. Zhang and J. Zhu, Ceram. Int., 2016, 42, 334–340 CrossRef CAS.
- P. Dong, Y. Wang, L. Guo, S. Xin, J. Zhang, Y. Shi, W. Zeng and S. Yin, Nanoscale, 2012, 4, 4641–4649 RSC.
- Y. Shen, H.-B. Zhang, H. Zhang, W. Ren, A. Dasari, G.-S. Tang and Z.-Z. Yu, Carbon, 2013, 56, 132–138 CrossRef CAS.
- C. Petit, M. Seredych and T. J. Bandosz, J. Mater. Chem., 2009, 19, 9176–9185 RSC.
- C. K. Chua and M. Pumera, Chem. Soc. Rev., 2014, 43, 291–312 RSC.
- Z. Liu, X. Duan, X. Zhou, G. Qian, J. Zhou and W. Yuan, Ind. Eng. Chem. Res., 2014, 53, 253–258 CrossRef CAS.
- Z. Sofer, O. Jankovský, P. Šimek, D. Sedmidubský and J. Šturala, ACS Nano, 2015, 9, 5478–5485 CrossRef CAS PubMed.
- A. Kumar and M. Khandelwal, New J. Chem., 2014, 38, 3457 RSC.
- M. Seredych and T. J. Bandosz, J. Phys. Chem. C, 2007, 111, 15596–15604 CAS.
- V. Barbarossa, F. Galluzzi, R. Tomaciello and A. Zanobi, Chem. Phys. Lett., 1991, 185, 53–55 CrossRef CAS.
- H. Wang, J. T. Robinson, X. Li and H. Dai, J. Am. Chem. Soc., 2009, 131, 9910–9911 CrossRef CAS PubMed.
- R. Wang, Y. Wang, C. Xu, J. Sun and L. Gao, RSC Adv., 2013, 3, 1194–1200 RSC.
Footnote |
| † Electronic supplementary information (ESI) available. See DOI: 10.1039/c7ra02171b |
| This journal is © The Royal Society of Chemistry 2017 |

