
 Open Access Article
 This Open Access Article is licensed under a
 Creative Commons Attribution 3.0 Unported Licence
Microstructure, morphology and electrochemical properties of Co nanoflake water oxidation electrocatalyst at micro- and nanoscale
Naimeh Naseri*a,
Shahram Solaymani *b,
Atefeh Ghaderic,
Miroslaw Bramowiczd,
Slawomir Kuleszae,
Ştefan Ţăluf,
Mohammad Pourrezaa and
Shahnaz Ghasemig
*b,
Atefeh Ghaderic,
Miroslaw Bramowiczd,
Slawomir Kuleszae,
Ştefan Ţăluf,
Mohammad Pourrezaa and
Shahnaz Ghasemig
aDepartment of Physics, Sharif University of Technology, Tehran 11155-9161, Iran. E-mail: naseri@sharif.edu; Tel: +98 66164565
bDepartment of Physics, Science and Research Branch, Islamic Azad University, Tehran, Iran. E-mail: shahram22s2000@yahoo.com; Fax: +98 2144805410; Tel: +98 9194947717
cDepartment of Physics, West Tehran Branch, Islamic Azad University, Tehran, Iran
dUniversity of Warmia and Mazury in Olsztyn, Faculty of Technical Sciences, Oczapowskiego 11, 10-719 Olsztyn, Poland
eUniversity of Warmia and Mazury in Olsztyn, Faculty of Mathematics and Computer Science, Sloneczna 54, 10-710 Olsztyn, Poland
fTechnical University of Cluj-Napoca, Faculty of Mechanical Engineering, Department of AET, Discipline of Descriptive Geometry and Engineering Graphics, 103-105 B-dul Muncii St., Cluj-Napoca 400641, Cluj, Romania
gWater and Energy Research Center, Sharif University of Technology, Tehran 11155-9161, Iran
First published on 24th February 2017
Abstract
Nowadays, fossil fuel limitations and environmental concerns push researchers to find clean and renewable energy resources. Solar hydrogen production via water splitting reactions in electrochemical and/or photo-electrochemical systems has been accepted as a promising route and efficient electrocatalysts are involved in both. Here, cobalt nanoflakes with an oxide/hydroxide surface and a conductive metallic core are grown on commercially available steel mesh modified with carbon based nanocomposites as a support layer. The portion of reduced graphene oxide sheets was changed from 0 to 100 wt% and the correlation of this concentration with the surface morphology and electro-catalytic activity of the final electrode was studied systematically for the first time. Obtained results revealed the least over potential (224.2 mV) for the sample with 50 wt% rGO in the water splitting reaction which is promising for use in alkaline electrolysis devices.
Introduction
In the last few decades, by considering the limited resources of fossil fuels and increasing demand of energy, attention to clean energy resources is unavoidable. Photosynthesis plays a key role in nature to convert solar energy into clean fuels,1 inspiring water splitting for hydrogen production in water oxidation and reduction half reactions (WOR and WRR, respectively). Reduction of hole transfer overpotential (OP) is one of the main criteria to enhance the water splitting efficiency. As a result, developing efficient, low cost and environmentally friendly oxygen evolution electrocatalysts with long term stability remains a great challenge to decrease the required overpotential to initial water oxidation on the surface.2–5 Although Ru and Ir have shown the best reported performance, their rarity keeps them out of practical plans and hence, it is necessary to replace them with some earth abundant candidates which are potentially suitable for commercial uses like Ni, Co, Cu etc.1–5Increase of surface interface between WOR electrocatalysts by approaching to nanoscale and facilitation of charge transport in the fabricated nanostructures are two main strategies to enhance efficiency of the mentioned catalysts. In this regard, introducing carbon nanomaterials like graphene and carbon nanotubes (CNT) as a host for electrocatalyst growth is a promising choice. These carbonaceous support layers not only provide conductive backbone for electron transfer, but also provide significant effective surface for catalytic sites and improve their mechanical strength as well.2 Despite of published related reports, the optimum composition of such carbon based supporting layer and correlation between surface structure and performance of final grown electrocatalysts are still open questions.
One systematic and informative way to investigate surface structure is analyzing the sample morphology based on SEM technique and obtaining structural functions and fractal dimensions in micro and nano scales.
Recently, it has been clear that the 3D surface morphology plays a major role in nanotribology, chemical reactions and thermodynamics of surfaces at micro and macro scales.6,7 Fractal/multifractal geometry is useful for understanding the 3D nanoscale architecture and phenomena of 3D surface roughness.8–10 Also, it is known that the 3D engineering surface can be divided into isotropic (Gaussian or non-Gaussian) or anisotropic textures.11–14 In general, fractal approach in the surface morphology analysis makes use of the similarity law that governs the behavior of data series of height samples at different scale lengths which is beneficial to reveal 3D nanoscale specific patterns and their special performances.15
Here, for the first time, we used carbon based supporting layer including reduced graphene oxide (rGO) nanosheets and CNTs with different mass ratios as substrate to deposit cobalt nanoflakes for water oxidation reaction. We tried to find a correlation between composition of supporting layer, surface morphology parameters and electro catalytic performance of the grown Co species.
Surface topography of the samples was characterized using statistical, fractal and functional parameters determined from SEM images. Numerical procedure that was carried out to perform that task has been described elsewhere.16 Obtained results established a bridge between specific geometry of residual surface and its tribological and physical characteristics.
Experimental details
Fabrication of rGO-CNT paste
GO nanoflakes were synthesized using modified Hummers' method in which 3.00 g of graphite powder were added into a mixture of concentrated H2SO4 (12 mL), K2S2O8 (2.50 g) and P2O5 (2.50 g). The mixture was heated at 80 °C and stirred for 5 h in an oil bath. The suspension was diluted with 500 mL of deionized water. The product was obtained by filtering the solution using 0.2 μm Nylon film, washed with deionized water several times and dried under ambient condition. The oxidized graphite was added to the 460 mL of H2SO4 in an ice bath. Then, 60 g of KMnO4 was put slowly with controlling the temperature below 10 °C. Stirring was continued for 2 h at 35 °C. Then, 920 mL of deionized water was added drop wise keeping the temperature below 50 °C. After 2 h, 2.8 L of deionized water and 50 mL of H2O2 30% were added to the mixture. The mixture was centrifuged and washed with 5 L of HCl 10% solution followed by adding 5 L of deionized water to remove the acid. The resulting solid was subjected to dialysis for a week. Finally, the product was dried under the vacuum condition at ambient temperature.17To make the paste, commercially available multiwall CNT with 20–30 nm diameter and 30 μm length and carbon black (CB) were added to GO solution.
Because GO and CNTs have not enough adherence to steel mesh (SM; applied substrate), solved PVDF in NMP was added as binder and CB was also used for compensating the conductivity. It the final mixture, various ratios of GO to CNT (100, 75, 50, 40, 0 wt%) were considered while total active material (GO + CNT) was fixed at 85 wt% in the paste.
To cast the final paste on the substrate, a hot plate at 70 °C was used. The paste was dropped with a micropipette on the steel mesh first and then the layer was placed in the oven at 80 °C for 1 h.
To benefit high electrical conduction of rGO flakes in the carbonaceous nanostructured paste, electrodes were electrochemically reduced to turn GO flakes into rGO ones. For this purpose, under continuous flow of N2 gas in a three-electrode equipped sealed reactor with sodium sulfate as electrolyte (pH = 7), GO was reduced in a cyclic voltammetric method changing the applied bias from 0 to −1.6 V for 30 cycles.
Fabrication of Co electrocatalysts
To growth cobalt electrocatalysts, modified steel mesh with carbon paste, Ag/AgCl and Pt sheet were utilized as working, reference and counter electrodes, respectively. Electro-deposition of Co species in a conventional three electrode system was performed by chronopotentiometry technique applying a constant current density of 7 mA cm−2 for 2000 s. Then, all samples were immersed in 1 M KOH for 24 h.Instrumentals
Morphology of the samples and their crystalline structures were investigated by field emission scanning electron microscope (FESEM; TESCANVEGA3-SB) and X-ray diffraction spectrometer (XRD; PEN analytical with Cu source), respectively. Electro-catalytic tests were carried out in 1 M KOH in a three-electrode contained glassy cell with Ag/AgCl and Pt rod as reference and counter electrodes, respectively. Surface chemical state of the samples was investigated by X-ray photoelectron spectroscopy (XPS). In the later technique, AlKα was used as monochromatic radiation source (1486.6 eV). All binding energies were calibrated by fixing Au(4f) peak at 84.0 eV with accuracy of ±0.1 eV. Chemical state analysis was performed by deconvoluting all peaks to different possible states using SDP software (version 4.1) with 80% Gaussian–20% Lorentzian peak fitting.Surface texture analysis
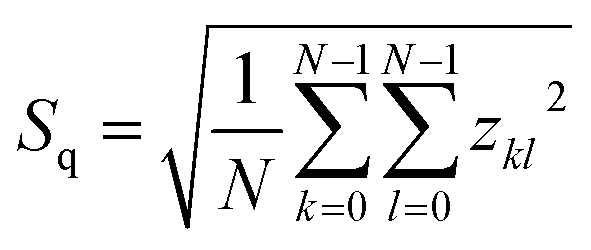
SEM technique provides gray-scale images representing planar projections of investigated surface along its normal.18 Upon conversion of intensity values of each pixel into a series of surface heights, obtained samples z scale, z(x,y), can be characterized in terms of monofractal9,19 as well as multifractal8 surface geometry.Statistical analysis started from computation of the root-mean-square deviation of the surface roughness Sq:
 | (1) |
 | (2) |
 | (3) |
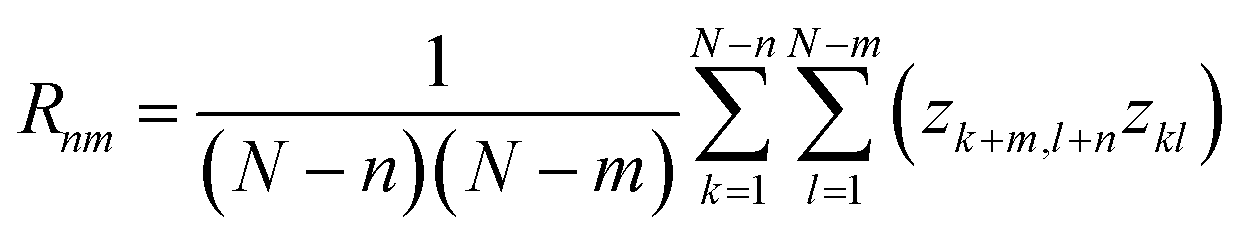
In order to gain an insight into fractal properties, the autocorrelation function was required to be converted into the structure function using the following formula:21
| S(m,n) = 2Sq2(1 − R(m,n)) | (4) |
It was shown22 that the mean profile of the structure function averaged around its central point exhibits specific scaling behavior that can be expressed in terms of the fractal parameters:
| S(τ) = Kτ2(2−D) | (5) |
Results and discussions
Crystalline structure
To study crystalline structure of the prepared samples, XRD analysis was done for Co nanoflakes grown on carbonaceous paste containing 50 wt% graphene in both forms of oxide (GO, before electrochemical reduction) and reduced (rGO). Resulted XRD spectra revealed complex patterns due to multicomponent structure of the samples under study. In order to determine the relative contributions of each crystalline component, the Rietveld method was used that enables quantitative phase analysis of crystalline materials by fitting the XRD data with pseudo-Voigt profiles.23,24 Performed XRD measurements revealed diffraction peaks from both electrocatalytic Co films as well as steel substrate. Two crystalline phases were found: hexagonal Co with P63/mmc symmetry (space group no 194) (01-089-7373 JCPDS card), and austenitic steel of Feγ structure (96-900-8470 JCPDS card). These obtained results are shown in Fig. 1.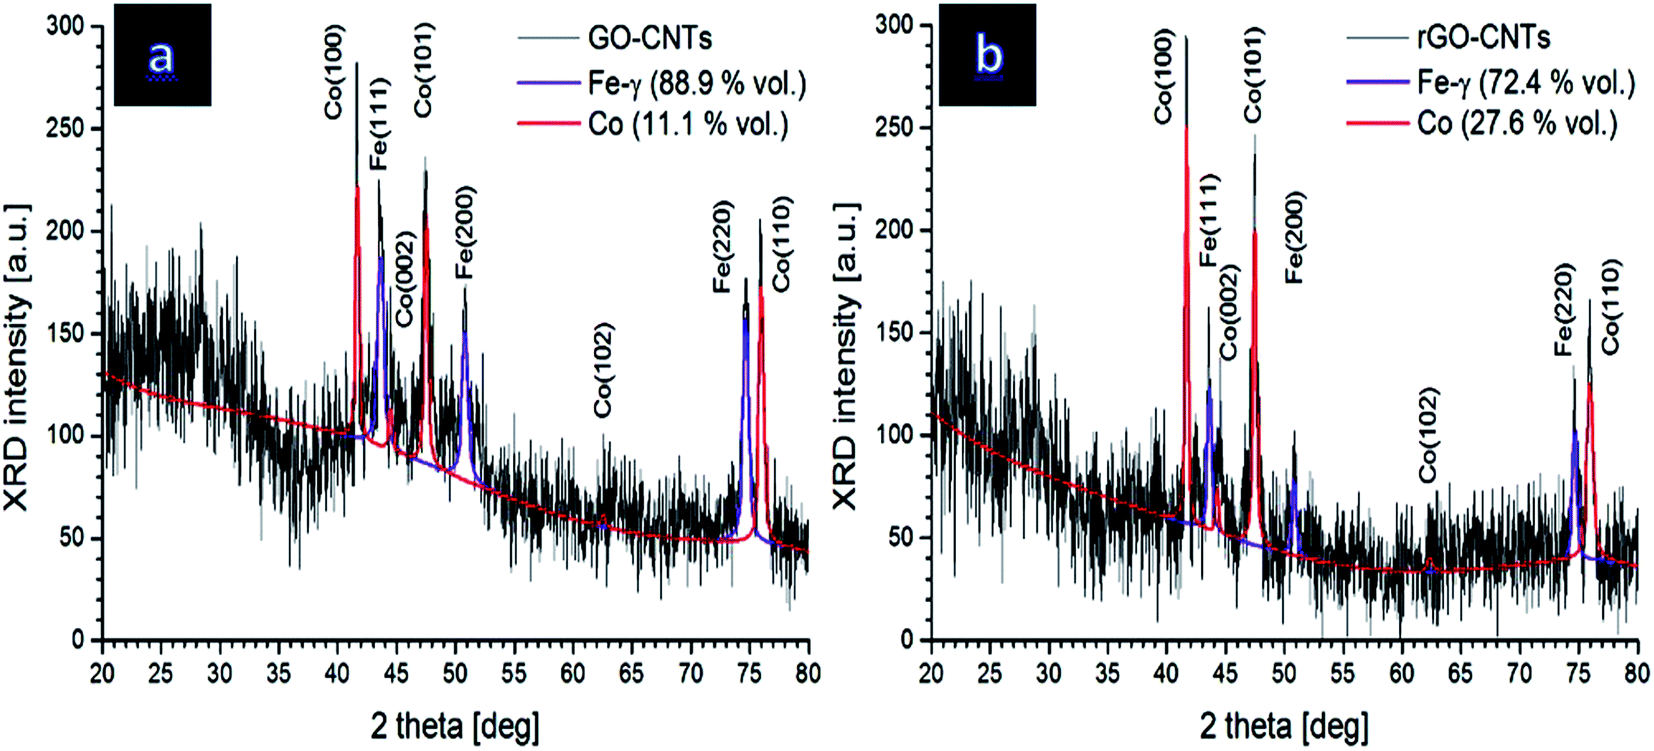 | ||
| Fig. 1 XRD spectra of the Co nanoflake electrocatalysts grown on the carbonaceous paste with 50 wt% (a) GO and (b) rGO in the carbonaceous paste. | ||
Additionally, numerical analysis of XRD spectra and related estimation of the lattice parameters of respective crystalline phases as well as their contributions can be seen in Table 1.
| Sample | Co (hexagonal) | Feγ (face-centred) | |||
|---|---|---|---|---|---|
| Lattice constants | Phase contribution | Lattice constant | Phase contribution | ||
| a0 [Å] | c0 [Å] | [vol%] | a0 [Å] | [vol%] | |
| Co on 50% GO-CNT | 2.51 | 4.08 | 11.10 | 3.60 | 88.90 |
| Co on 50% rGO-CNT | 2.51 | 4.10 | 27.62 | 3.60 | 72.38 |
Rietveld analysis clearly shows that the Co contribution in rGO-CNT sample is more than twice of that in the GO-CNT sample. It is likely due to the fact that crystalline growth of Co species on the more conductive substrate (rGO-CNT paste) is more preferred and facilitated in comparison with Co/GO-CNT sample. It is widely known that the penetration depth into metals depends on several parameters: wavelength of the incident beam, atomic number of the material under study and diffraction angle. Here, penetration depth into the Co film varies between 0.5 and 7.0 μm. Hence, it can be concluded that electrochemically reducing GO species to rGO facilitated crystalline structure formation of Co nanoflakes during electro-deposition step, which is beneficial for their electro-catalytic activities.
For the samples grown on carbonaceous pastes with other graphene contents, crystalline structure was same due to similarity in Co electro-deposition conditions.
Morphological analysis
Fig. 2 shows SEM images of the structures under investigation containing various weight percent of rGO: 0, 40, 50, 75 and 100% as well as an example plot of the profile structure function of the sample 75% (Fig. 2(f)). The images revealed complex morphology of the samples composed of larger extended objects with tens of micrometers in length and only around one micrometer wide while their surface covered with much smaller regular flakes. As a rule, it gave rise to cluster structures that can be characterized using bifractal characteristics. However, SEM images also provide interesting observation on the changes in the specific shape of the clusters. Samples deposited on a carbonaceous paste with 0, 50 and 100% wt of rGO represented sharp and well-established surface features whereas the remaining two showed flatter and fluffy shape.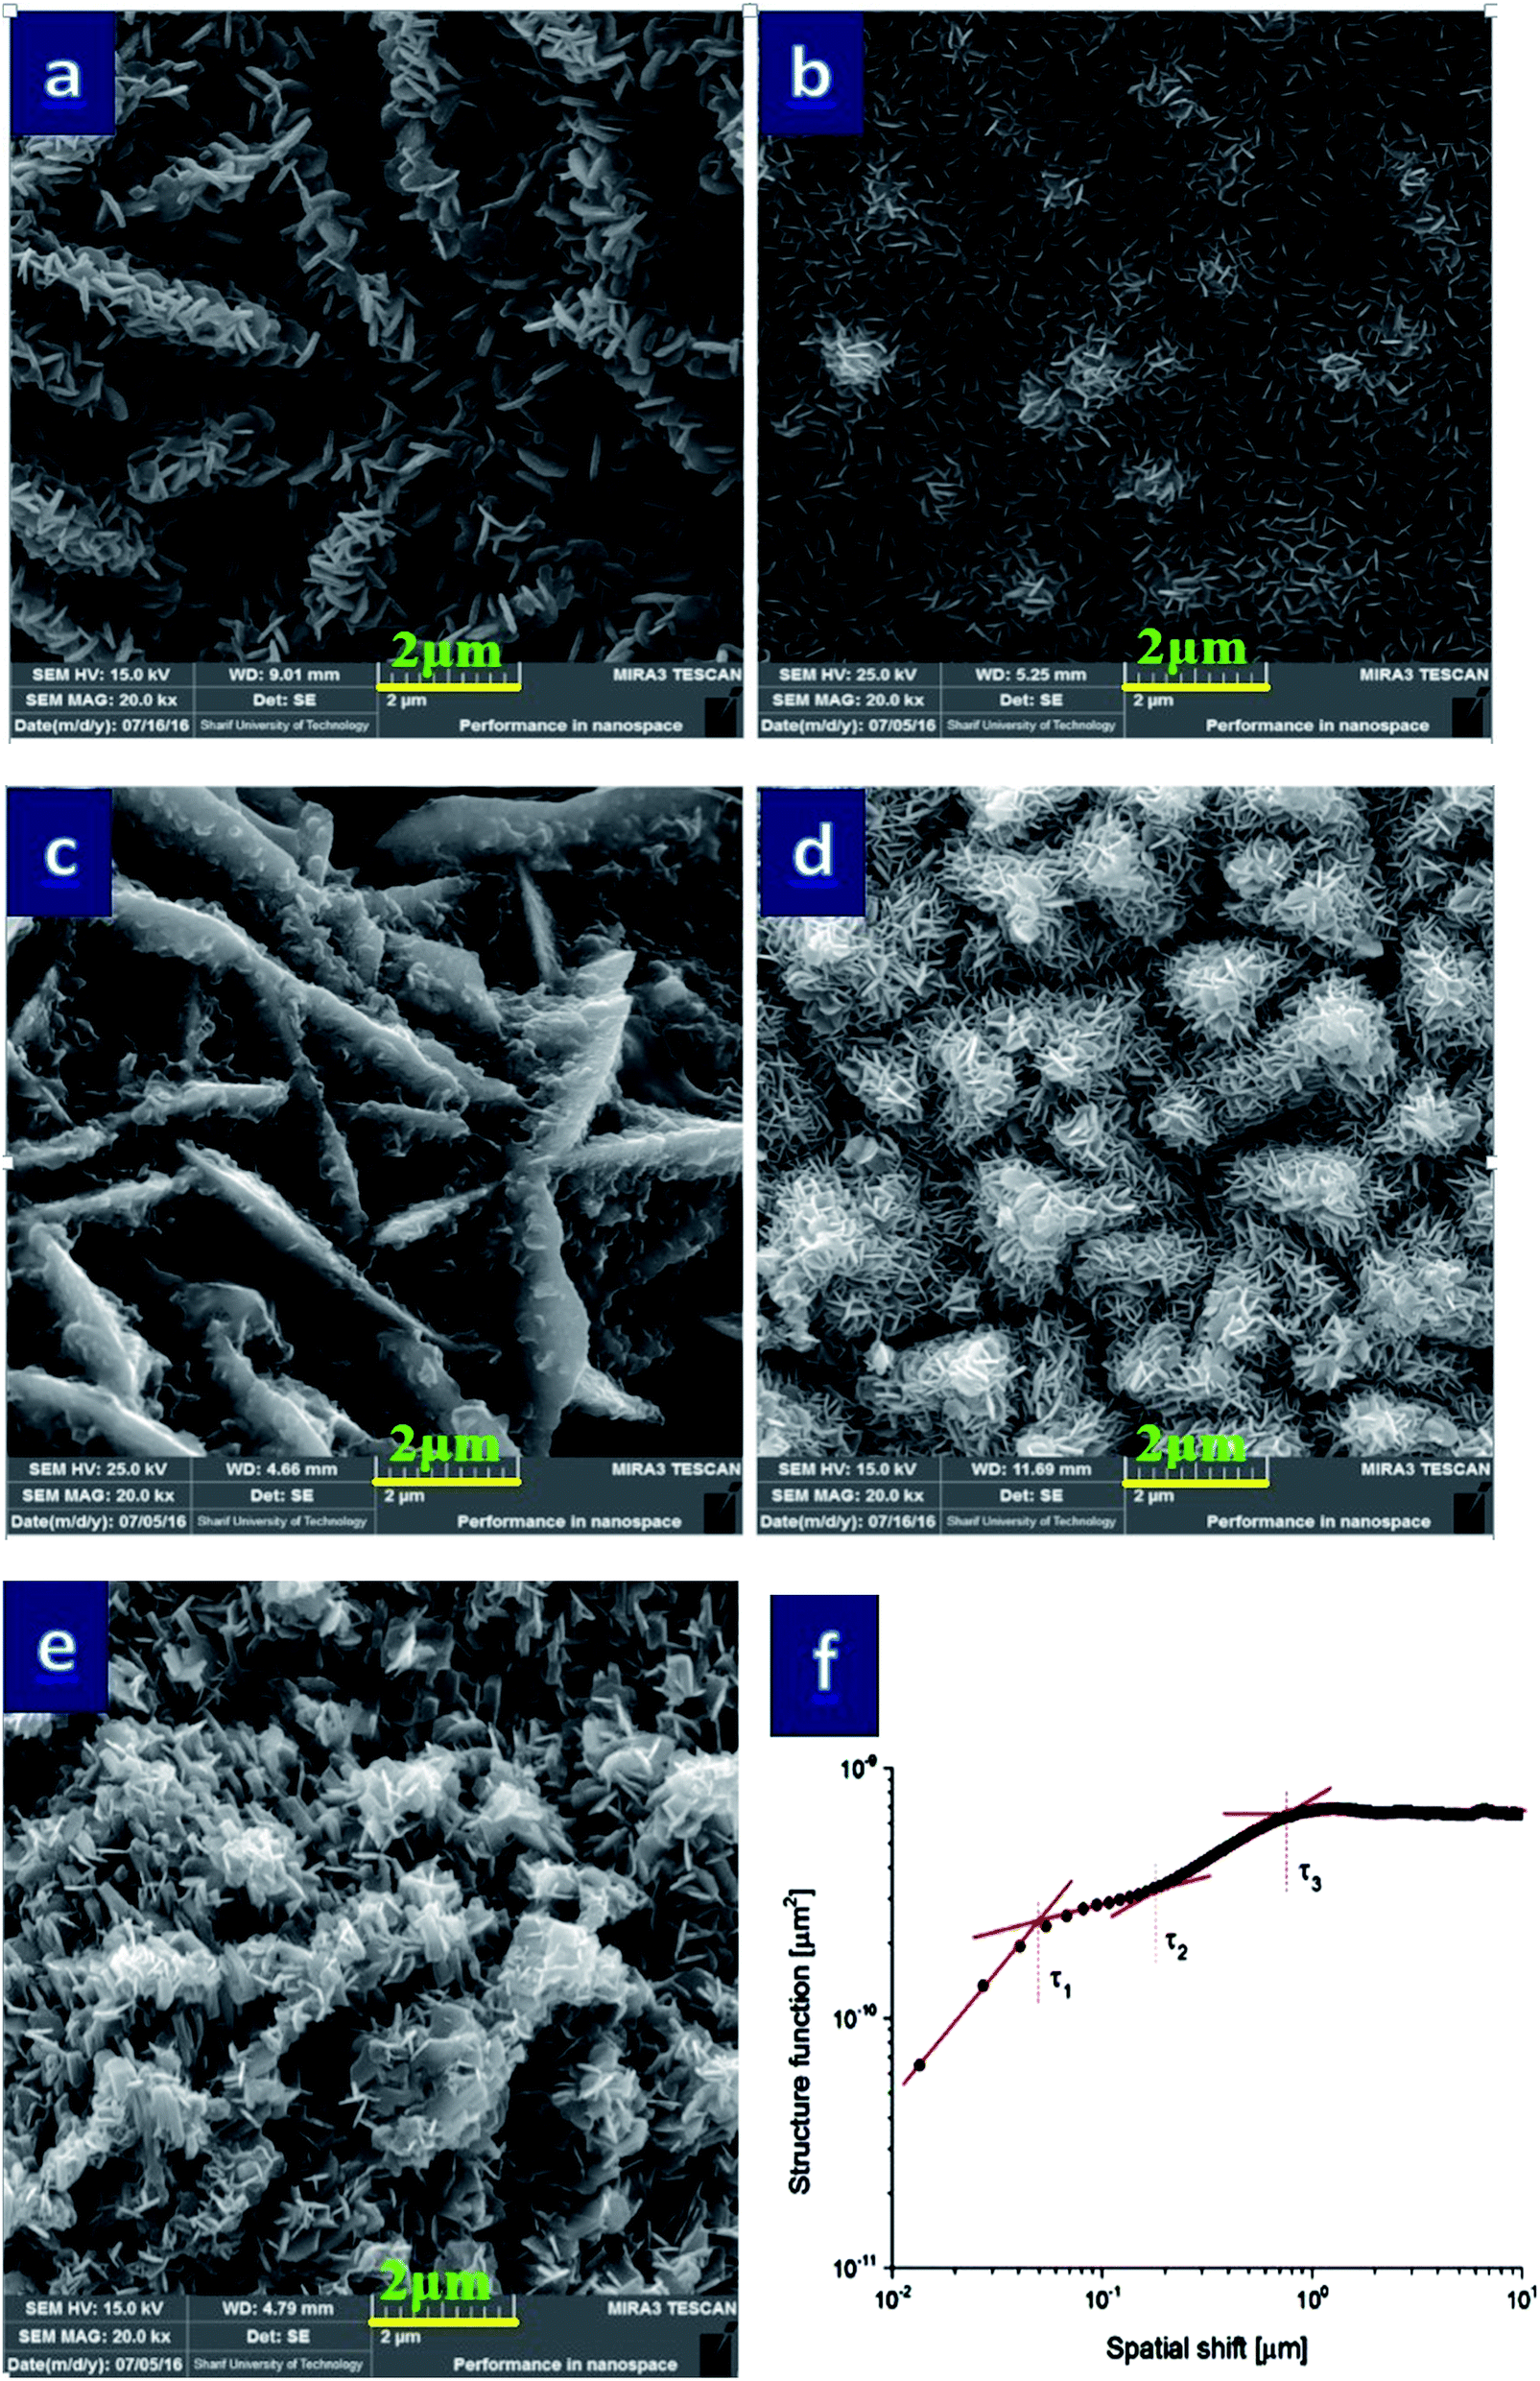 | ||
| Fig. 2 SEM images (ca. 10 × 10 μm2) of the cobalt nanoflakes deposited on carbonaceous support layer with different rGO wt%: (a) 0, (b) 40, (c) 50, (d) 75%, (e) 100% and (f) example plot of the profile structure function calculated for the sample with 75 wt% rGO. Note the multifractal scaling behavior with three different corner frequencies and fractal dimensions was observed. | ||
Results presented in Table 2 generally confirmed bifractal structure of the samples under study while in the case of samples deposited on carbonaceous support layer containing 40 and 75 wt% of rGO their characteristics became in fact even more complex exhibiting tri-fractal structure. Fig. 2(f) exhibits an example of such a behavior with three different fractal dimensions, i.e. three different inclinations of the log–log plot of the structure function (flat, asymptotic part of the curve did not count).
| GO/CNT [% wt] | D1 | τ1 [nm] | D2 | τ2 [nm] | D3 | τ3 [nm] | Str | Dav |
|---|---|---|---|---|---|---|---|---|
| 0 | 2.5 | 81 | 2.8 | 980 | N.A. | N.A. | 0.82 | 2.71 |
| 40 | 2.5 | 61 | 3.0 | 240 | 2.9 | 1100 | 0.88 | 2.86 |
| 50 | 2.5 | 95 | 2.6 | 900 | N.A. | N.A. | 0.56 | 2.63 |
| 75 | 2.5 | 54 | 2.9 | 180 | 2.8 | 810 | 0.99 | 2.77 |
| 100 | 2.5 | 67 | 2.7 | 760 | N.A. | N.A. | 0.85 | 2.68 |
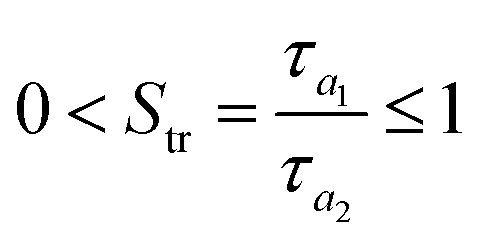
Table 2 shows several interesting trends. At first, the fractal dimension determined for the shortest wavelengths D1 was constant for the all samples and equaled to 2.5. The threshold for this scaling exponent (corner frequency τ1) extended up to 81 and 95 nm for the samples with 0 and 50 wt% of rGO, respectively, which were significantly larger than other ones. Moreover, different behavior was found concerning the second fractal dimension D2, which took the lowest value (2.6) for the sample contained 50 wt% rGO. As can be seen, the values of τ2 were much larger for the samples with 0, 50 and 100 wt% of rGO (760–980 nm) than the remaining ones (180–240 nm). However, the latter samples (with 40 and 75 wt% rGO) had fluffy surface structures which were found tri-fractal whereas the former were only bifractal. In addition, the fluffy samples were described by the third fractal dimension D3, which approached the value close to the topological dimension, 2.8–2.9, and was valid for the scale lengths lower than the corner frequency τ3 (800–1100 nm). Finally, considering the anisotropy ratio Str varying in the range from 0.82 to 0.99 for the samples with 0, 40, 75 and 100 wt% rGO, all of these samples were highly isotropic while this parameter fell down to 0.56 for one with 50 wt% rGO represented more anisotropic surface in this case.
Surface chemical composition
Because presence of any undesired impurities or chemisorbed species on the surface leads to toxicity and passivation of the grown electrocatalysts, studying their surface chemical composition is an important issue. In this regard, XPS technique was applied to reveal surface elements and their chemical states. Few nanometers of the surface were detected in this method and hence, XPS spectra of the all samples deposited on different carbonaceous layer were same. Consequently, the result for electrocatalyst grown on the support layer with 50 wt% of graphene oxide was presented here as an example.Fig. 3(a) shows wide range XPS spectra of the sample in which just gold (deposited is some parts of the surface for calibrating the spectrum), carbon (due to surface adsorbed CO/CO2 before the test), cobalt and oxygen were observed with no impurity and/or toxic compounds. Considering that XPS analysis was performed after the electrocatalytic tests, this result also revealed pristine and fresh surface even after long time activity.
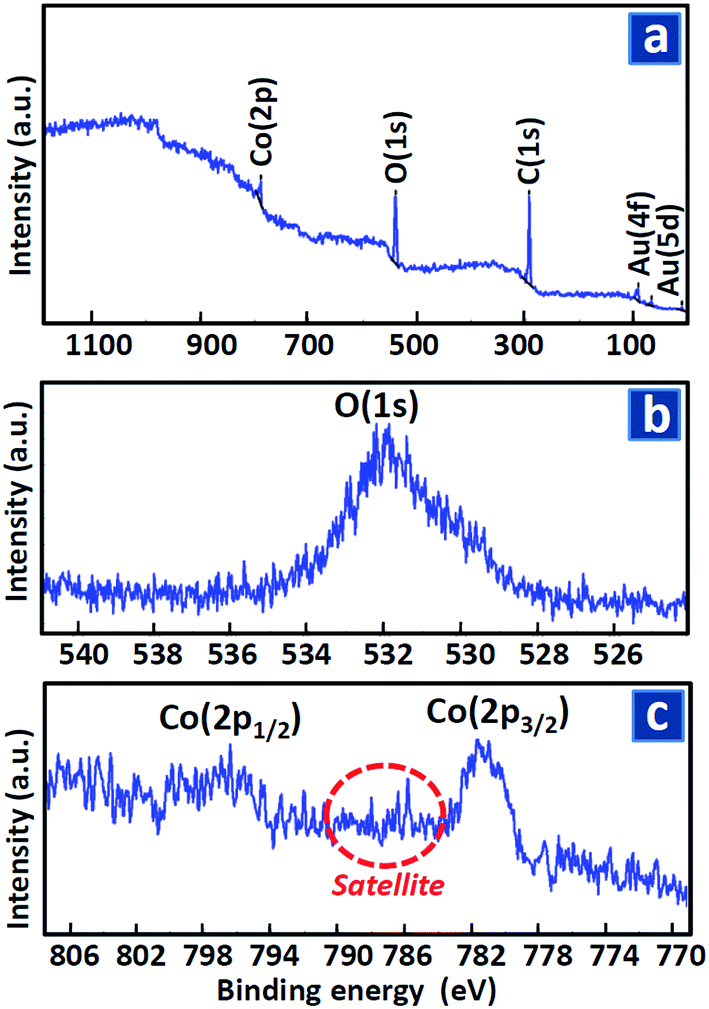 | ||
| Fig. 3 XPS spectra of the sample deposited on carbonaceous paste containing 50 wt% of GO in (a) wide, (b) O(1s) and (c) Co(2p) binding energy range. | ||
Fig. 3(b) presents high resolution XPS spectrum in the range of O(1s) core level peak. Position of the peak at 532.0 eV determined coexistence of the surface oxygen atoms bounded in metal oxide lattice (∼530 eV) and hydroxide –OH groups (∼532 eV) as well as H2O or other surface chemisorbed species (∼533 eV).
Fig. 3(c) shows the result for Co(2p) peak in which two distinguishable peaks at around 781.6 and 797.1 eV are related to Co(2p3/2) and Co(2p1/2) core energy levels, respectively. Considering the cobalt XPS peak in metallic zero valent form, oxide and hydroxide phases at 778.0–779.0, 780.0–781.0 and 785.0–786.0 eV range, respectively, the observed surface Co atoms were completely in oxide/hydroxide phases and the portion of metallic state was less than 1%. Based on data extracted from Co(2p3/2) peak deconvolution, the portion of oxide and hydroxide states were nearly same. These detected Co surface compositions were in coincidence with the observed coexistence of OLattice and OOH in O(1s). Moreover, the satellite in Co(2p) spectra was attributed to CoII and CoIII on the surface.
Electro-catalytic performance
To compare electrocatalytic activity of the synthesized Co nanostructures, several determinant parameters were studied based on their measured electrochemical responses. The first is overpotential (OP) which is the main characteristic of a WOR electro-catalyst and it means that how low is the required bias to obtain a certain anodic current density (here, 1 mA cm−2) in water oxidation reaction. The less OP value introduces the more active and efficient electro-catalyst. This quantity can be simply extracted from linear-sweep voltammograms which is shown for the sample with 100 wt% graphene oxide, as an example, in Fig. 4(a). The all recorded OP values are listed in Table 3 revealing that the lowest overpotential was obtained for Co nanoflakes grown on the carbonaceous paste containing 50 wt% rGO-50 wt% CNTs. By increasing (decreasing) graphene portion from this amount to 100 (0) wt%, OP value increased to 244.0 (244.4) mV.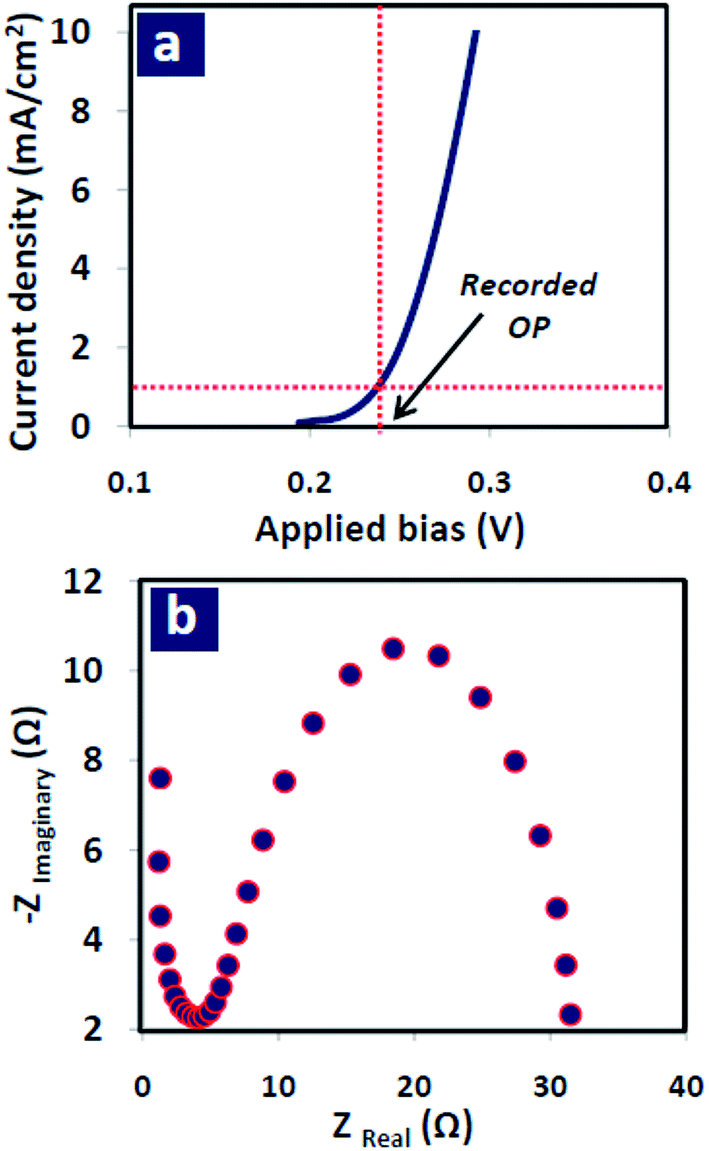 | ||
| Fig. 4 (a) LSV with the scan rate of 1 mV s−1 and (b) Nyquist plots at +0.5 V for the sample deposited on carbonaceous paste containing 50 wt% of GO. The tests were performed in 1 M KOH in the absence of light source. | ||
| GO wt% | 0 | 40 | 50 | 75 | 100 |
|---|---|---|---|---|---|
| OP (mV) | 266.0 | 244.4 | 224.2 | 234.3 | 244.0 |
| RCT (Ω) | 24.4 | 21.8 | 20.2 | 24.7 | 27.3 |
| CDL (mF cm−2) | 3.6 | 4.4 | 4.7 | 7.0 | 7.8 |
The second parameter is charge transfer resistance (RCT) which was obtained from EIS technique in which electrochemical impedance of the layer measured by applying sinusoidal bias perturbation in a frequency range of 1 mHz to 100 kHz. The resulted Nyquist plot (imaginary versus real part of the obtained impedance) is shown in Fig. 4(b) for the sample with 100 wt% graphene oxide. Diameter of the plot reflects how large the resistance of charge transfer at the electrocatalyst/electrolyte interface is. The less RCT attributes to more active and efficient electrocatalyst. As can be seen, the sample containing 50 wt% of graphene oxide in the support layer showed the lowest RCT and hence, the best kinetic and most facility in surface reactions.
The third parameter is the electrode effective surface interface exposing to the electrolyte. Large surface area cause more available active sites for catalytic reaction. In addition of previous discussion about surface structure and morphology, evaluation of the effective surface interface of fabricated electro-catalysts was also possible using an electrochemical approach reported in the literature25,26 in which surface double layer capacitance (CDL) calculated from cyclic voltammetry (CV) technique in a suitable window potential. Based on classical point of view for capacitors, the higher CDL value resulted from the larger surface interface. These measured capacitances for fabricated carbonaceous pastes are also presented in Table 3. From the obtained results, it can be seen that CDL of the samples increased with increasing rGO content in the paste due to incorporation of these 2D materials exposing high surface area.
To make a correlation between surface structure and the data obtained from electrochemical performance of the samples it should be noted that samples with high (>50%) and low (<50%) concentrations of rGO in the support layer showed higher fractal dimensions with more isotropic surface as compared with the sample with half rGO, half CNTs (50%). However, although the later sample revealed lowest D value and the most anisotropic surface, but formation of hierarchical roughness on its surface including large shoulder with small nano size flakes on them was beneficial for electro-catalytic performance.25 As verified by electrochemical analysis, such a starfish like surface structure exposes more active sites at the electrode/electrolyte interface which facilitate charge transfer phenomenon on the surface lading to decrease in the required overpotential for water oxidation. Moreover, according to XPS and XRD analysis, these flakes are in oxide/hydroxide phase on the surface (few surface layers as detected by XPS technique) while inside of each is in the hexagonal metallic form. Hence, water oxidation process initialized and facilitated by CoII and CoIII sites on the surface while electron transport conducted from metallic core of each flake, simply to the back contact. Schematic of this proposed mechanism is shown in Fig. 5.
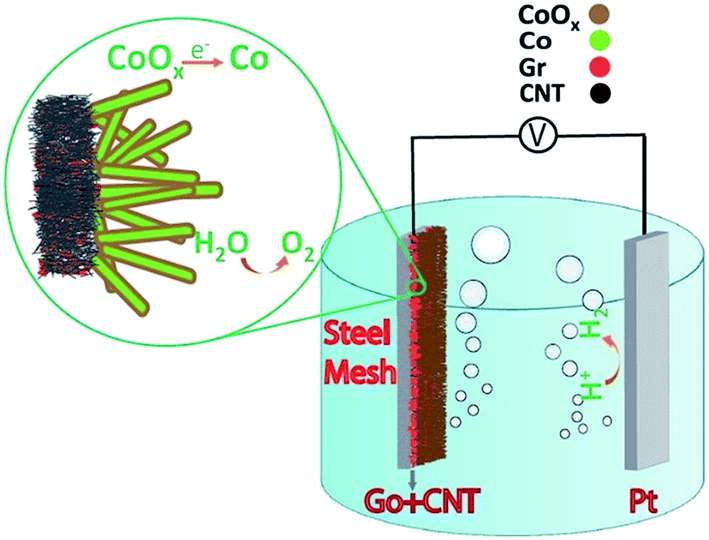 | ||
| Fig. 5 Schematic of electrochemically water splitting reactions on cobalt–cobalt oxide nanoflakes grown on rGO-CNT carbonaceous support layer. | ||
Conclusion
In summary, flexible steel mesh was modified with carbonaceous paste containing electrochemically reduced graphene oxide nanosheets and carbon nanotube with different rGO/CNT mass ratios. Then, cobalt based nanoflakes were grown on this support layer by electro-deposition technique and applied as electro-catalyst for water oxidation reaction. Systematic study of 3D surface morphology of the samples and its correlation with their electro-catalytic performance revealed that incorporation of such nanosized carbon structures, CNTs and rGO sheets in carbon paste with equal parts (50–50%) led to a starfish like Co oxide/hydroxide final structure with hierarchical roughness. This sample showed the best performance as water splitting device. Confirmed by XRD and XPS results, such an engineered catalyst with metallic core and oxide/hydroxide surface could be an ideal nanostructure for water oxidation devices. In the later structure, holes transferred easily on the surface and electron's transport facilitated via conductive cores as well, leading to the lowest required overpotential and charge transfer resistance (224.2 mV and 20.2 Ω, respectively).Conflict of interest
The authors report no conflict of interests. The authors alone are responsible for the content and writing of the paper.Acknowledgements
Financial supports granted by Niroo Research Institute (NRI) are gratefully acknowledged.References
- J. Li and N. Wu, Semiconductor-based photocatalysts and photoelectrochemical cells for solar fuel generation: a review, Catal. Sci. Technol., 2015, 5, 1360–1384 CAS.
- Y. Qiu, C. Yang, J. Huo and Z. Liu, Synthesis of Co–N–C immobilized on carbon nanotubes for ethylbenzene oxidation, J. Mol. Catal. A: Chem., 2016, 424, 276–282 CrossRef CAS.
- X. Deng and H. Tuysuz, Cobalt–Oxide-Based Materials as Water Oxidation Catalyst: Recent Progress and Challenges, ACS Catal., 2014, 4, 3701–3714 CrossRef CAS.
- M. Giannouri, M. Bidikoudia, M. P. Martínez, M. T. Silva and P. Falarasa, Reduced graphene oxide catalysts for efficient regeneration of cobalt-based redox electrolytes in dye-sensitized solar cells, Electrochim. Acta, 2016, 219, 258–266 CrossRef CAS.
- Y. Liang, Y. Li, H. Wang, J. Zhou, J. Wang, T. Regier and H. Dai, Co3O4 nanocrystals on graphene as a synergistic catalyst for oxygen reduction reaction, Nat. Mater., 2011, 10, 780–786 CrossRef CAS PubMed.
- S. Solaymani, S. M. Elahi, N. B. Nezafat, H. Zahrabi, A. Boochani and M. Naseri, Characterization of microroughness parameters in Cu–C nanocomposite prepared by co-deposition of RF-sputtering and RF-PECVD, Eur. Phys. J.: Appl. Phys., 2013, 64, 11301 CrossRef.
- Ş. Ţălu, Micro and nanoscale characterization of three dimensional surfaces, Basics and applications, Napoca Star Publishing House, Cluj-Napoca, Romania, 2015 Search PubMed.
- Ş. Ţălu, S. Stach, S. Solaymani, R. Moradian, A. Ghaderi, M. R. Hantehzadeh, S. M. Elahi, Z. Garczyk and S. Izadyar, Multifractal Spectra of Atomic Force Microscope Images of Cu/Fe Nanoparticles Based Films Thickness, J. Electroanal. Chem., 2015, 749, 31–41 CrossRef.
- Ş. Ţălu, S. Stach, J. Zaharieva, M. Milanova, D. Todorovsky and S. Giovanzana, Surface roughness characterization of poly(methylmethacrylate) films with immobilized Eu(III) β-Diketonates by fractal analysis, Int. J. Polym. Anal. Charact., 2014, 19(5), 404–421 CrossRef.
- Ş. Ţălu, S. Solaymani, M. Bramowicz, N. Naseri, S. Kulesza and A. Ghaderi, Surface micromorphology and fractal geometry of Co/CP/X (X = Cu, Ti, SM and Ni) nanoflake electrocatalysts, RSC Adv., 2016, 6, 27228–27234 RSC.
- S. Kulesza and M. Bramowicz, A comparative study of correlation methods for determination of fractal parameters in surface characterization, Appl. Surf. Sci., 2014, 293, 196–201 CrossRef CAS.
- Ş. Ţălu, M. Bramowicz, S. Kulesza, A. Ghaderi, S. Solaymani, H. Savaloni and R. Babaei, Micromorphology analysis of specific 3-D surface texture of silver chiral nanoflower sculptured structures, J. Ind. Eng. Chem., 2016, 43, 164–169 CrossRef.
- G. Dobrescu, F. Papa, R. State, I. Fangli and I. Balint, Particle size distribution of Pt–Cu bimetallic nanoparticles by fractal analysis, Powder Technol., 2015, 269, 532–540 CrossRef CAS.
- Ş. Ţălu, S. Solaymani, M. Bramowicz, S. Kulesza, A. Ghaderi, S. Shahpouri and S. M. Elahi, Effect of electric field direction and substrate roughness on three dimensional self-assembly growth of copper oxide nanowires, J. Mater. Sci.: Mater. Electron., 2016, 27, 9272–9277, DOI:10.1007/s10854-016-4965-8.
- Ş. Ţălu, M. Bramowicz, S. Kulesza, V. Dalouji, S. Solaymani and S. Valedbagi, Fractal features of carbon–nickel composite thin films, Microsc. Res. Tech., 2016, 79(12), 1208–1213 CrossRef PubMed.
- M. Bramowicz, S. Kulesza, T. Lipiński, P. Szabracki and P. Piątkowski, Fractal analysis of AFM data characterizing strongly isotropic and anisotropic surface topography, Solid State Phenom., 2013, 203–204, 86–89 CrossRef.
- Y. Li and Y. Wu, Co assembly of graphene oxide and nanowires for large-area nanowire alignment, J. Am. Chem. Soc., 2009, 131, 5851–5857 CrossRef CAS PubMed.
- M. Bramowicz, S. Kulesza and K. Rychlik, Comparison between contact and tapping AFM modes in surface morphology studies, Technical Sciences, 2012, 15(2), 307–318 Search PubMed.
- Ş. Ţălu, M. Bramowicz, S. Kulesza, A. Ghaderi, V. Dalouji, S. Solaymani, M. Fathi Kenari and M. Ghoranneviss, Fractal features and surface micromorphology of diamond nanocrystals, J. Microsc., 2016, 264(2), 143–152 CrossRef PubMed.
- W. P. Dong, P. J. Sullivan and K. J. Stout, Comprehensive study of parameters for characterizing 3-dimensional surface topography. 4. Parameters for characterizing spatial and hybrid properties, Wear, 1994, 178, 45–60 CrossRef CAS.
- R. S. Sayles and T. R. Thomas, Spatial representation of surface roughness by means of structure function – practical alternative to correlation, Wear, 1977, 42, 263–276 CrossRef.
- A. Thomas and T. R. Thomas, Digital analysis of very small scale surface roughness, J. Wave Mater. Interact., 1988, 3, 341–350 Search PubMed.
- K. Ståhl, Powder diffraction and the Rietveld method, Lyngby, 2008 Search PubMed.
- L. B. McCusker, R. B. Von Dreele, D. E. Cox, D. Louer and P. Scardi, Rietveld refinement guidelines, J. Appl. Crystallogr., 1999, 32, 36–50 CrossRef CAS.
- N. H. Chou, P. N. Ross, A. T. Bell and T. D. Tilley, Comparison of Cobalt-based Nanoparticles as Electrocatalysts for Water Oxidation, ChemSusChem, 2011, 133, 14431–14442, DOI:10.1002/cssc.201100075.
- N. Naseri, A. Esfandiar, M. Qorbani and A. Z. Moshfegh, Selecting Support Layer for Electrodeposited Efficient Cobalt Oxide/Hydroxide Nanoflakes to Split Water, ACS Sustainable Chem. Eng., 2016, 4, 3151–3159 CrossRef CAS.
| This journal is © The Royal Society of Chemistry 2017 |