 Open Access Article
Creative Commons Attribution 3.0 Unported Licence
Controlled synthesis of perovskite lanthanum ferrite nanotubes with excellent electrochemical properties
Zijiong Li *,
Weiyang Zhang,
Chaosheng Yuan and
Yuling Su
School of Physics & Electronic Engineering, Zhengzhou University of Light Industry, Zhengzhou, 450002, PR China. E-mail: zijiongli@zzuli.edu.cn
First published on 24th February 2017
Abstract
In this work, we have fabricated a series of perovskite-type oxide LaFeO3 samples using a simple sol–gel method and further calcination treatment. We investigated the morphologies, structures and electrochemical performances of the fabricated samples in detail by controlling the calcination temperature and time. The morphology characterization indicates that when the calcination temperature and time are 700 °C and 3 h, respectively, LaFeO3 presents as a large number of nanotubes with a diameter of 25 nm. Electrochemical performance testing indicates that the tubular LaFeO3 shows excellent electrochemical performance. When 2 M KOH is used as the electrolyte, the LaFeO3 nanotubes exhibit a high specific capacitance of 313.21 F g−1 at a current density of 0.8 A g−1. In addition, the electrode maintains 86.1% of the initial specific capacitance after 5000 cycles at a scan rate of 100 mV s−1, indicating good long-cycle stability. These results indicate that LaFeO3 nanotubes are a novel pseudocapacitance electrode material for application in energy storage devices.
1. Introduction
Facing with the problems of energy shortage, energy storage and conversion, and environmental pollution, the need to develop sustainable, environmentally friendly and efficient energy storage devices has become a priority.1–3 Supercapacitors, a new type of energy storage device with the potential to ensure economic and environmental protection with characteristics of both traditional capacitors and batteries, have broad and important applications in portable electronics, new energy, and other high-tech fields on account of their particular attributes, which include large capacity, high power density, long cycle life, high charge and discharge efficiency, freedom from maintenance, and economic and environmental protection; consequently, they have become a hot research topic in the field of ‘new energy’ worldwide.4–9 As an important part of a pseudocapacitor, the pseudocapacitance electrode material has been a key research topic because of its large specific capacity and high energy density.10–15Transition metal oxides are an important type of pseudocapacitance electrode material and have been studied extensively in recent years because of their high capacitance, excellent redox properties and good electrical conductivity.16,17 Lu et al. prepared a novel ternary ordered electrode consisting of a Co3O4 nanosheet, Ni–Co–O nanorod and nickel foam array in a bottom-up manner; they obtained an excellent electrochemical performance of 2098 F g−1 at 5 mA cm−2 and 72% of the specific capacitance was retained after 1000 charge–discharge cycles.18 Zhang et al. synthesized an Fe2O3–Ni(OH)2/graphene nanocomposite using a simple one-step hydrothermal method; the nanocomposite demonstrated outstanding electrochemical properties, including a specific capacitance of 857 F g−1 and excellent cycling stability (100% retention after 5000 cycles).19 Perovskite-type oxides have attracted great interest as energy conversion materials for hybrid solar cells and metal–air batteries because of their unique structures and physical and chemical properties.20,21 Having the common formula ABO3, where A is a lanthanide or alkali earth element and B is a transition metal, they are an important type of functional nanomaterial, owing to a stable crystal structure, good thermal stability and inherent property of containing oxygen vacancies. In addition, their electrochemical properties have been studied in the electrodes of supercapacitors.22–25 However, it is not sufficient only to study the properties of LaBO3 electrode materials in supercapacitors.20,26 Perovskite-type oxides (LaBO3) merit future study as potential candidate materials for the next generation of supercapacitors and other electrochemical energy storage devices. Esaka T et al.27 showed that the storage of electrochemical energy in perovskite oxides is mainly due to the valence change of B sites caused by hydrogen absorbed in the form of protons. Moreover, Fe is a promising electrode material, as it has many valence states, good electrochemical activity, and high discharge capacity.
In this paper, we prepare perovskite-type oxides (LaFeO3) using a simple sol–gel method and further calcination treatment. The analysis results show that the calcination temperature and time have a great impact on the structure, morphology and electrochemical performance of LaFeO3. We obtain a high yield of perovskite LaFeO3 nanotubes when the calcination temperature and time are 700 °C and 3 h, respectively. Furthermore, the perovskite LaFeO3 nanotubes obtained under these calcination conditions have the best specific capacitance of 313.21 F g−1 at a current density of 0.8 A g−1 and retain 86.1% of their original capacitance after 5000 charge–discharge cycles at a scan rate of 100 mV s−1. This excellent electrochemical performance is mainly due to the large specific surface area and small resistance attributed to their special structure and morphology. These results indicate that the perovskite LaFeO3 nanotubes show potential as pseudocapacitance electrode materials and are worthy of further investigation.
2. Experimental section
2.1 Material preparation
Lanthanum nitrate hexahydrate (La(NO3)3·6H2O), iron(III) nitrate nonahydrate (Fe(NO3)3·9H2O) and polyvinylpyrrolidone (K-30; analytical grade) were purchased from Aladdin-China. N,N-Dimethylformamide (≥99.5%; analytical grade) was purchased from Tianjin Kermel Chemical Reagent Co., Ltd.2.2 Characterization
The nanostructures and crystal phases of the prepared samples were characterized by X-ray diffraction (XRD; Bruker D8 Advance diffractometer) using Cu Kα radiation (λ = 1.5418 Å) operated at 50 kV with a scan rate of 0.2° s−1. The morphologies and sizes of the resulting nanotubes were characterized by field-emission scanning electron microscopy (FESEM; Quanta 250 FEG). Nitrogen adsorption–desorption isotherms were obtained at 77 K using a micromeritics ASAP 2020 analyzer. Before adsorption, the samples were degassed at 150 °C under a vacuum of 10−4 Torr for 6 h. The Brunauer–Emmett–Teller (BET) specific surface area (SBET) and the pore size distributions were evaluated using a multipoint BET method and the Barret–Joymer–Halender method, respectively. X-ray photoelectron spectroscopy (XPS) was performed on a Thermo Scientific ESCALAB 250 Xi using Al Kα radiation (USA).2.3 Electrochemical measurements
The electrochemical performances of the prepared samples were measured on a RST electrochemical workstation (Zhengzhou Shiruisi Technology Co., Ltd). The working electrodes were fabricated by mixing together the prepared materials, conductive carbon black (BP 2000, CABOT, USA), and polytetrafluoroethylene binder in a mass ratio of 8![[thin space (1/6-em)]](https://www.rsc.org/images/entities/char_2009.gif) :
:![[thin space (1/6-em)]](https://www.rsc.org/images/entities/char_2009.gif) 1
1![[thin space (1/6-em)]](https://www.rsc.org/images/entities/char_2009.gif) :
:![[thin space (1/6-em)]](https://www.rsc.org/images/entities/char_2009.gif) 1. A small amount of isopropyl alcohol was added into the mixture to produce a homogeneous paste. The soft paste mixture produced was coated onto Ni foam and pressed together (∼0.1 mm thick). Surplus material was then removed from the electrode so formed. Finally, the electrode was dried in a vacuum oven at 80 °C for 10 h. After weighing and calculating, the active material on nickel foam was found to be about 2.4 mg.
1. A small amount of isopropyl alcohol was added into the mixture to produce a homogeneous paste. The soft paste mixture produced was coated onto Ni foam and pressed together (∼0.1 mm thick). Surplus material was then removed from the electrode so formed. Finally, the electrode was dried in a vacuum oven at 80 °C for 10 h. After weighing and calculating, the active material on nickel foam was found to be about 2.4 mg.
Electrochemical measurements [cyclic voltammetry (CV), galvanostatic charge/discharge (GCD) and electrochemical impedance spectroscopy (EIS)] were carried out in a conventional three-electrode system with 2 M KOH aqueous solution as the electrolyte. The prepared electrode served as the working electrode, a platinum foil electrode was used as the counter electrode, and Ag/AgCl was used as the reference electrode. EIS measurements were carried out in the frequency range from 100 kHz to 0.01 Hz with an alternating current amplitude of 5 mV. Before electrochemical testing, the working electrode was soaked for 6 h in 2 M KOH aqueous solution to create better contact between the active electrode material and the electrolyte.
The specific capacitance (Sc) of each electrode was calculated from the following equation:
 | (1) |
3. Results and discussion
Fig. 1a shows the typical crystal phases of LaFeO3 at different calcination temperatures and times, based on the XRD spectra. The obvious diffraction peaks at 2θ = 22.6°, 32.2°, 39.7°, 46.1°, 57.4°, 67.6° and 76.6° can be indexed to the (101), (121), (220), (202), (240), (242) and (204) crystal planes, respectively, of orthorhombic LaFeO3 with lattice constants a = 5.567 Å, b = 7.855 Å and c = 5.553 Å (JCPDS no: 37-1493). We find that sample crystallinity increases with increasing calcination temperature for the same calcination time. Simultaneously, by comparing the samples calcined at 700 °C for 2, 3 and 4 h, we find that the calcination time has little effect on the crystallinity of the sample. Notably, there are no additional diffraction peaks in the XRD spectra of any of the samples, indicating that changing the calcination temperature and time does not affect the purity of the sample. Moreover, it shows that the prepared samples are of high purity.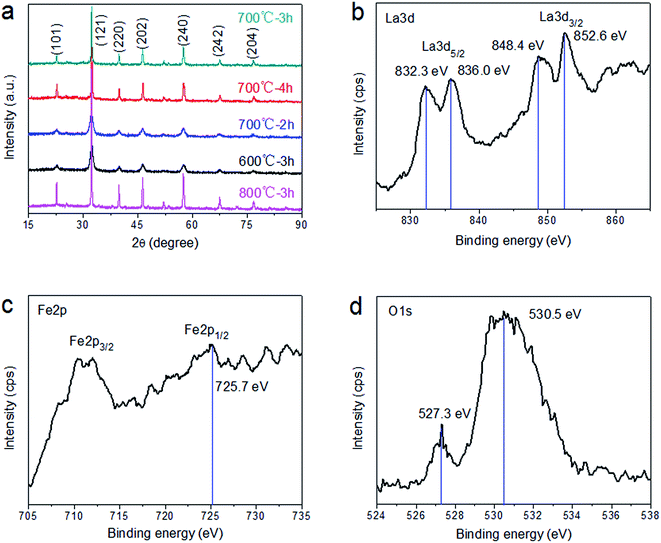 | ||
| Fig. 1 (a) XRD patterns of LaFeO3 at different calcination temperatures and times. XPS spectra of the (b) La3d, (c) Fe2p and (d) O1s peaks of the LaFeO3 sample prepared at 700 °C for 3 h. | ||
The surface state of the LaFeO3 sample prepared at 700 °C for 3 h was further investigated using XPS (Fig. 1b–d). As shown in Fig. 1b, the shape and position of the La3d peak indicate the presence of La(III) compounds, in agreement with previous literature reports.30 In addition, the two peaks located at around 832.3 and 836.0 eV correspond to La3d5/2, while the peaks at 848.4 and 852.6 eV correspond to La3d3/2. The Fe2p peaks are presented in Fig. 1c. The peaks at around 712.0 and 725.7 eV correspond to Fe2p3/2 and Fe2p1/2, respectively, indicating the presence of Fe3+ ions in the LaFeO3 sample.31 An obvious peak at around 530.5 eV and a satellite peak at 527.3 eV are observed in the O1s spectrum shown in Fig. 1d. The binding energy of 530.5 eV is attributed to weakly bound oxygen on the surface (e.g., surface hydroxyl groups and adsorbed oxygen). The satellite peak at 527.3 eV is mainly due to lattice oxygen in LaFeO3. Additionally, the O1s peak asymmetry indicates that the obtained LaFeO3 samples exhibit oxygen vacancies resulting in a slight shift in the main peak.
The morphology and microstructure will have a great effect on the electrochemical performance of the material for practical application in energy storage devices, mainly reflected in the effective contact area and electron/ion transport resistance.32–34 To demonstrate the effects of calcination temperature and time on the specific surface area, pore volume and size of LaFeO3 materials, we characterized the BET surface areas and pore size distributions of the prepared LaFeO3 samples using N2 adsorption–desorption measurements. As shown in Fig. 2a, the typical type-IV isotherm of LaFeO3 with a hysteresis loop at a P P0−1 of 0.75–0.9 indicates the presence of mesoporous structures in the materials.35 This result can be further verified from Fig. 2b, which exhibits a large number of smaller mesoporous in LaFeO3 materials. Moreover, we can clearly observe that when the calcination temperature and time are 700 °C and 3 h, the sample has a greater volume change and small pore diameter of about 6.8 nm, indicating that the sample has a larger specific surface area. The textural parameters of the obtained LaFeO3 samples at different calcination temperatures and times are listed in Table 1. Compared to other samples under different calcination conditions, the sample obtained at 700 °C and 3 h possesses the largest specific surface area (45.09 m2 g−1) and total pore volume (0.111 cm3 g−1), thereby providing more reaction sites and less ion transfer resistance for electrode materials. Therefore, the experimental data show that the calcination temperature and time have a great influence on the structure of the LaFeO3 material, and the material produced at 700 °C for 3 h has the best electrochemical performance.
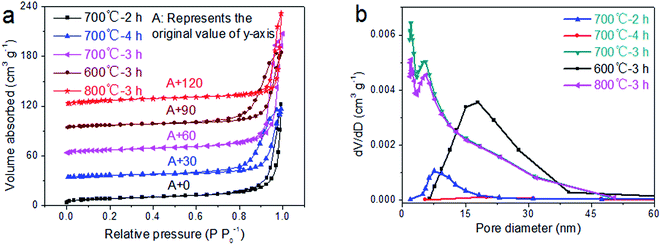 | ||
| Fig. 2 (a) N2 adsorption–desorption isotherms and (b) pore size distributions of the LaFeO3 samples prepared at different calcination temperatures and times. | ||
| Sample | SBET (m2 g−1) | DDFT (nm) | V (cm3 g−1) |
|---|---|---|---|
| a SBET represents the BET surface area; DDFT is the DFT desorption average pore diameter; V stands for the total pore volume. | |||
| 700 °C, 2 h | 40.26 | 7.548 | 0.092 |
| 700 °C, 4 h | 22.37 | 13.312 | 0.068 |
| 700 °C, 3 h | 45.09 | 6.797 | 0.111 |
| 600 °C, 3 h | 26.62 | 16.855 | 0.044 |
| 800 °C, 3 h | 38.80 | 6.636 | 0.087 |
Fig. 3 presents scanning electron microscopy (SEM) images of LaFeO3 samples prepared at different calcination temperatures and times. As shown in Fig. 3a–c, calcination time has a great influence on the morphology of the material when the calcination temperature is 700 °C. When the calcination time is 2 or 3 h, a large number of tubular LaFeO3 particles are observed. In addition, when the calcination time is 3 h, the quantity of tubular LaFeO3 in the material is higher, and the diameters of the nanotubes are finer (about 25 nm). Similarly, by comparing Fig. 3b, d and e, we find that a large number of tubular LaFeO3 particles are found when the calcination temperature is 800 °C. Nevertheless, a small number of tubular LaFeO3 particles appear at the calcination temperature of 600 °C, and the fracturing of the nanotubes is more serious. The results show that calcination temperature has a large effect on the morphology and nanostructure of LaFeO3. In summary, we find that changing the temperature and time of calcination greatly affects the morphology and structure of the material, which is consistent with the N2 adsorption–desorption measurements. This has important implications for the electrochemical performance of electrode materials, such as the effects on the capacitance of the electrode of the number of sites for the redox reaction and of the surface area for ion adsorption, and the effects of nanostructures on the electron/ion transmission resistance.
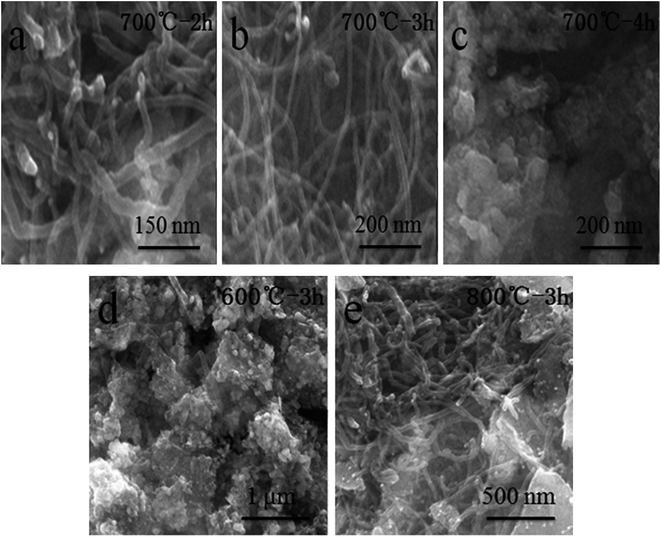 | ||
| Fig. 3 SEM images of LaFeO3 samples prepared at different calcination temperatures and times: (a) 700 °C, 2 h; (b) 700 °C, 3 h; (c) 700 °C, 4 h; (d) 600 °C, 3 h; and (e) 800 °C, 3 h. | ||
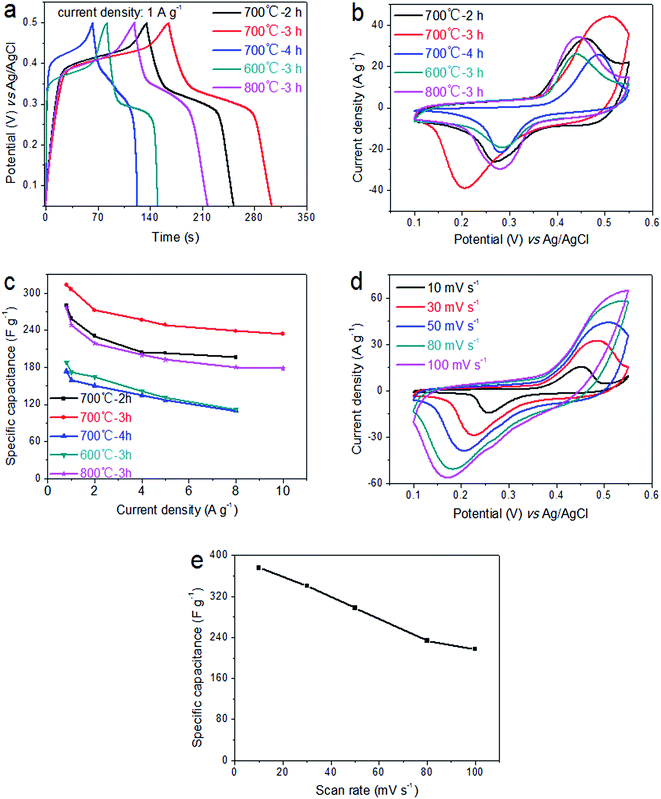
The electrochemical performances of the fabricated LaFeO3 electrodes were investigated by CV curves, GCD curves and EIS measurement in 2 M KOH electrolyte. As illustrated in Fig. 4a, the typical GCD curves at different calcination temperatures and times demonstrate that the specific capacitance for the sample fabricated at 700 °C for 3 h is obviously higher than those of other samples, at a current density of 1 A g−1. Moreover, the GCD curves for the different calcination conditions are all approximately symmetrical, which indicate ideal capacitive properties and excellent reversible redox reactions. Remarkably, according to the slope of the curve, the charging curve and discharge curve can be divided into three parts. Taking the discharge curve as an example, the straight lines of the potential regions from 0.05 to 0.28 V and 0.35 to 0.5 V have large slopes, indicating that the charge storage comes primarily from the double layer produced by the electrostatic desorption of electrolyte ions at the electrolyte/electrode interface. Similarly, the charge storage in the low-slope part of the curve (0.28–0.35 V) is mainly attributed to the redox reaction between Fe3+ and Fe2+ ions. A comparison of the CV curves of the electrodes under different calcination conditions is shown in Fig. 4b. All the CV curves have a pair of peaks between 0.1 and 0.55 V, and the area under the curve for the sample fabricated at 700 °C for 3 h is significantly larger than for the samples fabricated under other calcination conditions. This indicates that higher specific capacitance values were obtained by using our method (calculated according to the equation  , where Sc (F g−1) is the specific capacitance, ΔV (V) is the potential windows, m (g) is the mass of the active material, v (V s−1) is the potential scan rate, and I (A) is the response current36,37). The results are in good agreement with the GCD results. Fig. 4c shows the specific capacitances of LaFeO3 electrodes at various current densities evaluated from the GCD curves. We can clearly see that the specific capacitances of the electrode formed at 700 °C for 3 h are much higher than those of electrodes formed under other conditions at different current densities. Furthermore, the specific capacitance of the LaFeO3 electrode formed at 700 °C for 3 h still retains about 74.71% at 0.8 A g−1 (313.21 F g−1) and 10 A g−1 (234 F g−1), indicating an excellent rate capability. The CV curves of the electrode under the conditions of optimum electrochemical performance are shown in Fig. 4d. All the curves have a pair of redox peaks and maintain similar shapes as scan rate increases, indicating that the generation of capacitance is mainly due to the redox reaction. The shift in peak position towards both ends is caused by the internal diffusion resistance in the electrode.38 The specific capacitances at different scan rates for the electrode formed at 700 °C for 3 h are shown in Fig. 4e. We find that the electrode possesses a high specific capacitance of 375.76 F g−1 at a scan rate of 10 mV s−1. Even when the scan rate is increased to 100 mV s−1, the electrode retains a specific capacitance of 217.21 F g−1, indicating good electrochemical performance.
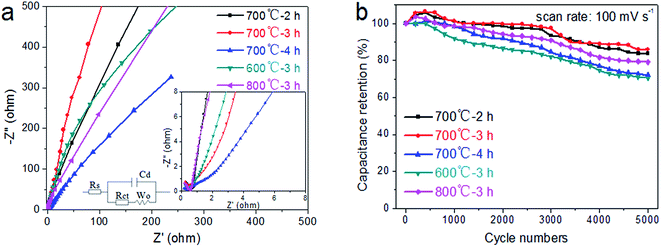
EIS can provide insight into the structure and distribution of the active material attached to the current collector and how they affect the electrochemical performance of the device.39 In Fig. 5a, the EIS spectra of LaFeO3 electrodes formed at different calcination temperatures and times are compared from 100 kHz to 0.01 Hz at an amplitude of 5 mV. The Nyquist plots, which represent the resistance behavior following frequency changes, are composed of two parts: an irregular semicircle corresponding to the Faraday reaction in the high-frequency region, and a straight line in the low-frequency region.26 For the electrode fabricated at 700 °C for 3 h, the straight line in the low-frequency region is more parallel to the imaginary axis than for the other electrodes, indicating a lower Warburg impedance (W0) and charge transfer resistance (Rct) of ion diffusion.40 In addition, these lines with slopes of 40–80° are consistent with the characteristics of pseudocapacitance behavior. The electrochemical cyclic stability of the electrode is also an important parameter in the practical application of the supercapacitor. As illustrated in Fig. 5b, the specific capacitance of the LaFeO3 electrode fabricated at 700 °C for 3 h is maintained at about 86.1% of the initial capacitance after 5000 cycles at a scan rate of 100 mV s−1, which is higher than for the other electrodes [about 83.69% (700 °C, 2 h), 72.1% (700 °C, 4 h), 70.55% (600 °C, 3 h), and 79.1% (800 °C, 3 h). This again demonstrates that a better cycle stability is obtained at 700 °C and 3 h, and the calcination temperature and time have great effects on the electrochemical properties of the electrode materials, which may be mainly attributed to the changes in the morphology and microstructure of the material.
4. Conclusions
In summary, novel perovskite-type oxide LaFeO3 nanotubes were fabricated at different calcination temperatures and times using a simple sol–gel method and further calcination treatment. The results show that the calcination temperature and time have large effects on the morphology, structure and electrochemical performance. The LaFeO3 nanotube electrode fabricated at 700 °C for 3 h exhibits the best electrochemical performance, with the best specific capacitance of 313.21 F g−1 at a current density of 0.8 A g−1 and excellent cyclic stability with 86.1% capacitance retention after 5000 cycles at a scan rate of 100 mV s−1. These excellent electrochemical properties suggest that the novel LaFeO3 nanotubes obtained here are a promising electrode material worthy of further investigation for practical applications in energy storage devices.Acknowledgements
The authors are grateful for support from the Henan Provincial Department of Education (No. 17A140013), the National Natural Science Foundation of China (No. 51472102, 21503194) and the Graduates' Scientific Research Foundation of Zhengzhou University of Light Industry.References
- Y. Y. Wang, Y. Lei, J. Li, L. Gu, H. Y. Yuan and D. Xiao, ACS Appl. Mater. Interfaces, 2014, 6, 6739–6747 CAS.
- L. W. Hu, Z. J. Yu, Z. Q. Hu, Y. Song, F. Zhang, H. M. Zhu and S. Q. Jiao, Electrochim. Acta, 2015, 174, 273–281 CrossRef CAS.
- Z. J. Li, W. Y. Zhang, Y. L. Su, H. Y. Wang and B. C. Yang, Appl. Surf. Sci., 2016, 383, 268–275 CrossRef CAS.
- D. S. Yu, K. L. Goh, H. Wang, L. Wei, W. C. Jiang, Q. Zhang, L. M. Dai and Y. Chen, Nat. Nanotechnol., 2014, 9, 555–562 CrossRef CAS PubMed.
- M. F. Elkady and R. B. Kaner, Nat. Commun., 2013, 4, 1475 CrossRef PubMed.
- S. L. Chen, F. Liu, Q. J. Xiang, X. H. Feng and G. H. Qiu, Electrochim. Acta, 2013, 106, 360–371 CrossRef CAS.
- T. Tevi and A. Takshi, J. Power Sources, 2015, 273, 857–862 CrossRef CAS.
- Y. P. Zhai, Y. Q. Dou, D. Y. Zhao, P. F. Fulvio, R. T. Mayes and S. Dai, Adv. Mater., 2011, 22, 4828–4850 CrossRef PubMed.
- T. Chen, H. S. Peng, M. Durstock and L. M. Dai, Sci. Rep., 2014, 4, 204–208 Search PubMed.
- Y. Gao, D. L. Wu, T. Wang, D. Z. Jia, W. Xia, Y. Lv, Y. L. Cao, Y. Y. Tan and P. G. Liu, Electrochim. Acta, 2016, 191, 275–283 CrossRef CAS.
- Q. Y. Liao, N. Li, S. X. Jin, G. W. Yang and C. X. Wang, ACS Nano, 2015, 9, 5310–5317 CrossRef CAS PubMed.
- Y. Zhao, L. F. Hu, S. Y. Zhao and L. M. Wu, Adv. Funct. Mater., 2016, 26, 4085–4093 CrossRef CAS.
- S. D. Min, C. J. Zhao, G. R. Chen, Z. M. Zhang and X. Z. Qian, Electrochim. Acta, 2014, 135, 336–344 CrossRef CAS.
- Z. N. Yu, B. Duong, D. Abbitt and J. Thomas, Adv. Mater., 2013, 25, 3302–3306 CrossRef CAS PubMed.
- Y. Haldorai, W. Voit and J. J. Shim, Electrochim. Acta, 2014, 120, 65–72 CrossRef CAS.
- M. Guo, J. Balamurugan, T. D. Thanh, N. H. Kim and J. H. Lee, J. Mater. Chem. A, 2016, 4(44), 17560–17571 CAS.
- H. C. Chen, J. J. Jiang, L. Zhang, H. Z. Wan, T. Qi and D. D. Xia, Nanoscale, 2013, 5, 8879–8883 RSC.
- Z. Y. Lu, Q. Yang, W. Zhu, Z. Chang, J. F. Liu, X. M. Sun, D. G. Evans and X. Duan, Nano Res., 2012, 5, 369–378 CrossRef CAS.
- H. Y. Zhang, Y. P. Ye, Z. H. Li, Y. M. Chen, P. Deng and Y. Y. Li, J. Mater. Sci., 2016, 51, 2877–2885, DOI:10.1007/s10853-015-9596-6.
- J. T. Mefford, W. G. Hardin, S. Dai, K. P. Johnston and K. J. Stevenson, Nat. Mater., 2014, 13, 726–732 CrossRef CAS PubMed.
- P. C. Du, X. W. Hu, C. Yi, H. C. Liu, P. Liu, H. L. Zhang and X. Gong, Adv. Funct. Mater., 2015, 25, 2420–2427 CrossRef CAS.
- Y. Liu, J. Dinh, M. O Tade and Z. P Shao, ACS Appl. Mater. Interfaces, 2016, 8(36), 23774–23783 CAS.
- L. Zhu, Y. Liu, C. Su, W. Zhou, M. L. Liu and Z. P. Shao, Angew. Chem., 2016, 55(33), 9576–9579 CrossRef CAS PubMed.
- C. O. Soares, R. A. Silva, M. D. Carvalho, M. E. Melo Jorge, A. Gomes, C. M. Rangel and M. I. da Silva Pereira, Electrochim. Acta, 2013, 89(1), 106–113 CrossRef CAS.
- Z. Z. Du, P. Yang, L. Wang, Y. H. Lu, J. B. Goodenough, J. Zhang and D. W. Zhang, J. Power Sources, 2014, 265(11), 91–96 CrossRef CAS.
- Y. Cao, B. P. Lin, Y. Sun, H. Yang and X. Q. Zhang, Electrochim. Acta, 2015, 174, 41–50 CrossRef CAS.
- T. Esaka, H. Sakaguchi and S. Kobayashi, Solid State Ionics, 2004, 166(3), 351–357 CrossRef CAS.
- F. H. Li, X. Y. Xu, F. L. Xia, L. Zhang, T. Wu, S. L. Li and W. Wang, Sci. Adv. Mater., 2015, 7(9), 269–277, DOI:10.1166/sam.2015.2017.
- M. Hakamada, T. Abe and M. Mabuchi, J. Power Sources, 2016, 325, 670–674 CrossRef CAS.
- X. P. Dai, J. Cheng, Z. Z. Li, M. Z. Liu, Y. D. Ma and X. Zhang, Chem. Eng. Sci., 2016, 153, 236–245 CrossRef CAS.
- K. K. Bhargav, A. Maity, S. Ram and S. B. Majumder, Sens. Actuators, B, 2014, 195(5), 303–312 CrossRef CAS.
- W. Tian, X. Wang, C. Y. Zhi, T. Y. Zhai, D. Q. Liu, C. Zhang, D. Golberg and Y. Bando, Nano Energy, 2013, 2, 754–763 CrossRef CAS.
- X. W. Hu, S. Liu, C. H. Li, J. H. Huang, J. X. Lv, P. Xu, J. Liu and X. Z. You, Nanoscale, 2016, 8, 11797–11802 RSC.
- G. Lota, K. Fic and E. Frackowiak, Energy Environ. Sci., 2011, 4, 1592–1605 CAS.
- S. I. Kim, P. Thiyagarajan and J. H. Jang, Nanoscale, 2014, 6, 11646–11652 RSC.
- G. L. Sun, H. Y. Xie, J. B. Ran, L. Y. Ma, X. Y. Shen, J. M. Hu and H. Tong, J. Mater. Chem. A, 2016, 4, 16576–16587 CAS.
- L. Zhu, Y. Liu, C. Su, W. Zhou, M. L. Liu and Z. P. Shao, Angew. Chem., Int. Ed., 2016, 55, 9576–9579 CrossRef CAS PubMed.
- J. Yan, Z. J. Fan, W. Sun, G. Q. Ning, T. Wei, Q. Zhang, R. F. Zhang, L. J. Zhi and F. Wei, Adv. Funct. Mater., 2012, 22, 2632–2641 CrossRef CAS.
- S. Y. Wang and R. A. W. Dryfe, J. Mater. Chem. A, 2013, 1, 5279–5283 CAS.
- C. X. Yang, Q. M. Gao, W. Q. Tian, Y. L. Tan, T. Zhang, K. Yang and L. H. Zhu, J. Mater. Chem. A, 2014, 2, 19975–19982 CAS.
| This journal is © The Royal Society of Chemistry 2017 |

