 Open Access Article
Creative Commons Attribution 3.0 Unported Licence
Label-free detection of anti-estrogen receptor alpha and its binding with estrogen receptor peptide alpha by terahertz spectroscopy†
Mingliang Li a,
Tianying Chang*ab,
Dongshan Wei
 *b,
Mingjie Tangb,
Shihan Yanb,
Chunlei Dub and
Hong-Liang Cuiab
aCollege of Instrumentation & Electrical Engineering, Jilin University, Changchun, Jilin 130061, China. E-mail: tchang@jlu.edu.cn
bChongqing Key Laboratory of Multi-Scale Manufacturing Technology, Chongqing Institute of Green and Intelligent Technology, Chinese Academy of Sciences, Chongqing, 400714, China. E-mail: dswei@cigit.ac.cn
First published on 4th May 2017
Abstract
Terahertz (THz) spectroscopic techniques were employed to study the hydration shell formation around anti-estrogen receptor alpha (AER-α), an important biomarker in breast cancer diagnosis, and to detect the binding reaction between AER-α and estrogen receptor peptide alpha (ERP-α), in aqueous solutions. A remarkable nonlinear relation between THz absorption and AER-α concentration was demonstrated, shedding some light on the formation process of the hydration shell around AER-α. THz spectroscopic properties of the AER-α were also shown to be significantly affected by the binding with the ERP-α, to the extent that THz transmission and attenuation could be used to investigate the dielectric properties of antibody–antigen binding reactions.
1. Introduction
Research on tumor markers for breast cancer, breast cancer risk assessment, early differential diagnosis, prognostics, and drug sensitivity tests have gained attention given the increasing incidence of breast cancer. Estrogen receptor is a nuclear steroid hormone receptor. Estrogen receptor alpha (ERα) is a crucial and useful biomarker in breast cancer diagnosis and treatment.1–3 The presence of ERα in two-thirds of tumors and its role in cancer regression with hormonal therapy established this biomarker as a useful clinical target.4–7Estrogen receptor α antibody (AER-α) has been shown to be highly specific and sensitive for the detection and quantification of estrogen receptor in human breast lesions using immunohistochemical methods.8 The antibody–antigen reaction leads to a rich phenomenology that is essential in diagnostics studies. For example, comparing ER antibodies (AER) for the study of ER levels in breast carcinomas and evaluating whether potential differences are significant for therapeutic decisions.9 The availability of AER and the advent of heat mediated antigen retrieval made it possible to assess ER with immunohistochemistry on paraffin sections.10 Characteristics and utility of ER antibodies AER in analysis, characterization and localization of ER isoforms in various tissues were demonstrated,11 as was sensitive binding assay for the interaction between ER and ER antibody AER.12 Comparison of the specificities of antibodies raised to different regions of ERα or ERα for detecting recombinant human ERα (rhERα) and recombinant rat ERα (rrERα) when bound to a consensus estrogen response element (ERE) was also carried out.13
Understanding of the binding reaction of antigen–antibody is essential in diagnostic studies because of the diversity and complexity associated with such reactions. Several research approaches were used to explore this interaction, including immunofluorescence technique,14 radioimmunoassay,15 enzyme-linked immunosorbent assay,16 luminescence immunoassay,17 immuno-polymerase chain reaction,18 and chemiluminescence immunoassay (CLIA).19 These methods invariably require labeling. CLIA is recognized globally as an advanced labeling immunoassay technology. In CLIA, free-state chemiluminescent (antigen–antibody complex) can be obtained after an antibody or antigen is labeled by the chemiluminescent-related substance that binds to the antigen or antibody to be measured; chemiluminescent systems related to other substances are then added to detect antigen or antibody qualitatively and quantitatively.
Terahertz (THz) wave refers to electromagnetic waves with the frequency from 0.1 to 10 THz. As an emerging molecular detection technology, THz wave has several unique advantages over other popular spectroscopic techniques.20 For instance, the energy level of THz largely coincides with the level of the molecular low-frequency motions including vibration, rotation and translation of the molecular skeleton. These movements may be identified through fingerprint characteristics in the THz transmission or absorption spectroscopy.21–23 In addition, the energy of THz wave is relatively low (∼4 meV per photon), which is mild to most molecules and will hardly cause the ionizing damage to the structure of molecules.24,25
Water exhibits a strong absorption in the terahertz range. At room temperature, the absorption coefficient of water at 1 THz frequency is greater than the absorption coefficient of most biomolecules. Strong absorption of terahertz radiation is a formidable obstacle in the study of liquid samples composed of polar molecules, but it is an advantage in studying the collective hydration dynamics of biomolecules, because the biomolecules can form hydration shells in aqueous solution, whose THz absorption characteristics is markedly different from that of bulk water. In the THz band, the fast hydration dynamics of biomolecules can be detected on a picosecond timescale, and THz spectroscopy has proven to be effective in detecting biomolecules and their hydration, and shown unique advantage in probing the coupling between shells, compared with X-ray crystallography, nuclear magnetic resonance, or conventional dielectric spectroscopy.26
THz spectroscopy is a powerful tool for determination of collective hydrogen bond dynamics on a picosecond timescale.27,28 This approach involves measurement of the collective hydration dynamics of biomolecules29 and binary mixtures.30 The unique advantage of THz spectroscopic technique is its ability to detect features of hydrogen-bonded collective networks of water in low-polarity environments31 and biological interfaces.32 The amplitude and phase of the THz radiation field propagating in solutions can be obtained by THz time domain spectroscopy (THz-TDS). The THz waveform in time domain is converted into frequency domain through Fourier transform. This method allows for ready acquisition of optical parameters, such as absorption coefficient, complex refractive index and complex dielectric constant.33
Dielectric spectroscopy offers a simple and sensitive approach for exploring proteins.34 The advent of pulsed THz-TDS techniques facilitated the development of broadband (0.1–10 THz) dielectric characterization of proteins. Dielectric loss tangent is extremely sensitive, specific, and holds applications in many fields, such as power measurement,35 nano-material exploration,36 and investigations of molecular polarization37 and protein structures.38 This parameter facilitates the detection of specificity and sensitivity of protein-binding reactions through THz spectroscopy.39
In this report, we describe our recent successful attempt at label-free detection of the immune response of ER-α, including its specific antibody AER-α in aqueous solutions using THz time-domain spectroscopy. Absorption coefficient and dielectric loss tangent of AER-α and its binding with ERP-α at different concentrations are determined and compared. Difference in the concentration dependence of these parameters before and after binding is discussed, and is subsequently employed to probe the binding reactions of biological activity of these proteins. The remainder of this report is organized as follows. We first briefly describe the experimental details, including AER-α and ERP-α preparation, experimental setup and the data analysis, followed by results and discussion of the use of the THz-TDS spectrometer to investigate the binding reactions of AER-α with ERP-α in aqueous solutions. Summary and conclusions are presented in the last section.
2. Experiment
2.1 Experimental setup
THz spectral measurements were performed using a Picometrix T-ray 5000 fiber-coupled THz-TDS spectrometer (Advanced Photonix, Inc., MI, USA) in transmission mode (Fig. 1a). The spectrometer used femtosecond near-infrared laser pulses and LT-InGaAs photoconductive antenna (PCA) chips to generate and coherently detect the electric field of ultra short THz electromagnetic pulses in the time domain. The experimental measurements were conducted at an ambient temperature of 21.0 ± 0.4 °C, a relative humidity of <2.0% with the purge of nitrogen gas.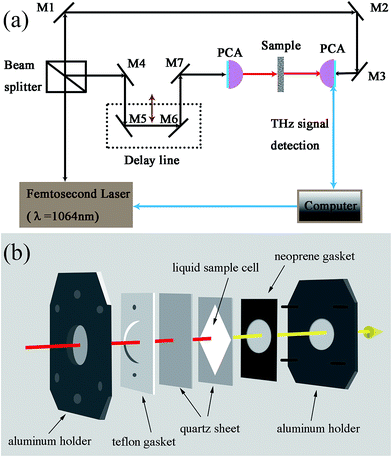 | ||
| Fig. 1 Schematic diagram of the THz-TDS spectrometer (a), and stereo diagram showing the sample cell (b). | ||
The sample cell (Fig. 1b) used in this work was modified from a standard Bruker liquid sample cell (model A145, Bruker, Ettlingen, Germany)40 and was adopted in our previous measurement.41 Two framing aluminum holders stabilized the demountable cell. The Teflon (PTFE) gasket and neoprene gasket next to the aluminum plates separated the optical window made of quartz from the metal surface of the two aluminum plates, respectively. The PTFE film (thickness of 100 μm) was tailored into rectangle on which a rhombus was hollowed out.
The nominal frequency range of the spectrometer was from 0.1 THz to 3.0 THz, but its valid range tended to decrease at the high-frequency end when the sample was in aqueous solution. Spectral frequency resolution of the spectrometer is 12.5 GHz. Each sample was measured at least three times on different days in order to eliminate the influences of humidity and instrument performance fluctuations. For each measurement, the sample holder was cleaned with alcohol and the sample was pipetted in the sample holder. Errors that resulted from changes in the location of the sample and the heterogeneity of solution were minimized by spectral averaging.
2.2 Sample preparation
AER-α (rabbit no. bs-2098R) and ERP-α (rabbit no. bs-2098P) were purchased from BIOSS Co., Ltd (Beijing, China). Classical methods of immunohistochemistry (IHC) and enzyme-linked immunosorbent assay (ELISA) were used to verify the binding reaction between AER-α and ERP-α, as detailed in the ESI.† All experiments were performed in compliance with the “Laboratories – General requirements for biosafety (GB 19489-2008)”, BIOSS BIOTECHNOLOGY CO., Ltd. has approved the experiments. AER-α was stored in sterilized PBS at pH 7.4. ERP-α was obtained as freeze-dried powder. AER-α was prepared with the following concentrations using PBS as diluent: 7.8, 15.6, 31.3, 62.5, 125, 250, and 500 μg ml−1.2.3 Data analysis
The THz optical refractive index of solution is calculated using42
 | (1) |
 | (2) |
 | (3) |
![[small epsilon, Greek, circumflex]](https://www.rsc.org/images/entities/i_char_e107.gif) (ω) is expressed as
(ω) is expressed as
![[small epsilon, Greek, circumflex]](https://www.rsc.org/images/entities/i_char_e107.gif) (ω) = [n(ω) − iκ(ω)]2 = ε′ − iε′′, (ω) = [n(ω) − iκ(ω)]2 = ε′ − iε′′,
| (4) |
3. Results and discussion
The liquid phase of AER-α protein did not exhibit any characteristic absorption peak in the THz spectral region considered (Fig. 2). The confidence intervals and average of multiple measurements are plotted as error bars to determine whether the differences are statistically significant. The absorption of each concentration nonlinearly increases with increasing frequency.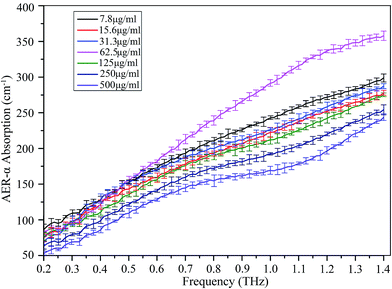 | ||
| Fig. 2 Absorption coefficients of AER-α solution at various concentrations (from 7.8 to 500 μg ml−1). The data present mean values, and error bars represent the standard deviation. | ||
Fig. 2 also shows that the change in absorption coefficient of AER-α solution with protein concentration is highly nonlinear as well: the absorption coefficient of the 62.5 μg ml−1 solution is higher than those of all other concentrations between 7.8 μg ml−1 and 500 μg ml−1.
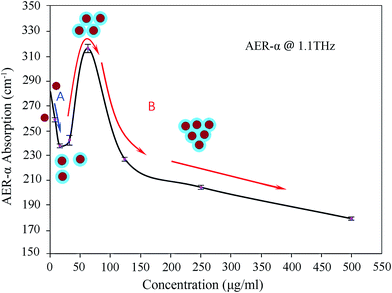
To illustrate the dependence of absorption coefficient on concentration and frequency, the absorption coefficients are plotted against AER-α concentration in the frequency band from 0.2 to 1.4 THz in Fig. 3, showing that the absorption coefficient decreases with increasing AER-α concentration up to 15.6 μg ml−1. Between concentrations of 15.6 μg ml−1 and 62.5 μg ml−1, the absorption coefficient increases and reaches the maximum at 62.5 μg ml−1. Thereafter it decreases with further increase in concentration. The remarkable change in absorption coefficient is manifested in a zigzag form, which bespeaks the nuances of the interaction between protein and water molecules in aqueous solution, particularly of such interaction's subtle dependence on the relative abundance of the two participants. To shed light on this point, we pick a typical curve from Fig. 3 to illustrate more clearly the evolution of the absorption coefficient as the AER-α concentration changes, which is re-plotted in Fig. 4, depicting the absorption coefficient of AER-α at 1.1 THz, as a function of AER-α concentration. It is apparent that dynamic hydration shell was not observed around the AER-α molecules at low concentrations of 7.8 to 15.6 μg ml−1. In region A of Fig. 4, bulk water absorption dominates, as the THz absorption of bulk water is higher than that of the protein. Thus, absorption coefficient decreases as AER-α concentration increases, as water is pushed out of the way by the protein molecules.
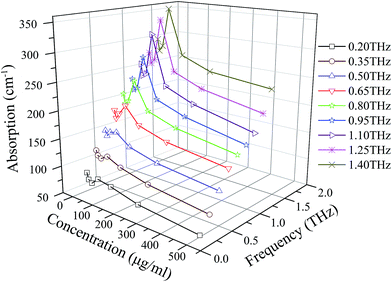 | ||
| Fig. 3 Dependence of the absorption coefficient of AER-α at different concentrations and at various frequencies (0.2 to 1.4 THz). | ||
The behavior in region A (Fig. 4) follows a binary-component model (bulk water and protein), whereas region B is better understood in terms of a ternary-component model (bulk water, protein, and hydration water).26,45–47 If the solution followed a strictly single-component Beer–Lambert's law, the absorption coefficient would have shown a linear dependence on protein concentration. However, the absorption coefficient decreases with increasing AER-α concentration up to 15.6 μg ml−1 in Fig. 4. The schematic molecules are employed to illustrate the formation and overlapping of hydration shells for interpreting the nonlinear absorption behavior. The absorption coefficient of the solution does not simply decrease with increasing protein concentration. A complex relationship exists between the absorption coefficient and the solute concentration as shown in Fig. 4.
This aspect continues until hydration shell begins to form at around 15.6 μg ml−1. The absorption of hydration shell in the THz region is higher than that of the bulk water.48 Moreover, absorption coefficient increases (start of region B in Fig. 4) as protein concentration rises. This phenomenon continues until hydration shells begin to overlap at about 62.5 μg ml−1. This overlap causes the absorption coefficient to decrease continuously as the protein concentration rises. Region A (blue line in Fig. 4) can be understood based on a two-component model that contains protein and bulk water; region B (red line in Fig. 4) shows the behavior of a ternary component model that contains protein, hydration water, and bulk water. This structure shows that the absorption coefficients of water molecules that surround the solute differ with varying solute concentrations because of the distinct properties of hydration water.49
To investigate protein-binding reactions, ERP-α (∼1.7 kD) at two different concentrations of 0.5 and 1.0 μg ml−1 was mixed into AER-α solutions with concentrations varying from 7.8 μg ml−1 to 500 μg ml−1 at 1![[thin space (1/6-em)]](https://www.rsc.org/images/entities/char_2009.gif) :
:![[thin space (1/6-em)]](https://www.rsc.org/images/entities/char_2009.gif) 1 volume ratio. The mixtures were incubated with gentle mixing for 30 min at room temperature and then overnight at 4 °C to allow the binding reaction and complex formation. Precipitate was not observed in the samples.
1 volume ratio. The mixtures were incubated with gentle mixing for 30 min at room temperature and then overnight at 4 °C to allow the binding reaction and complex formation. Precipitate was not observed in the samples.
Usually, two single ERP-α can saturate one AER-α, i.e. the ratio of binding sites (RBS) of AER-α to ERP-α is 2![[thin space (1/6-em)]](https://www.rsc.org/images/entities/char_2009.gif) :
:![[thin space (1/6-em)]](https://www.rsc.org/images/entities/char_2009.gif) 1. The concentration of ERP-α was chosen (Table 1) to explore the relationship between the absorption coefficient and concentration. Thus, optimum ratio was achieved at an AER-α concentration of around 62.5 μg ml−1. Obtaining the complete features of THz absorption depends on the frequency and concentration of the solution. The 3D plots of AER-α binding ERP-α [Fig. 5a and b] are shown from 0.2 to 1.4 THz.
1. The concentration of ERP-α was chosen (Table 1) to explore the relationship between the absorption coefficient and concentration. Thus, optimum ratio was achieved at an AER-α concentration of around 62.5 μg ml−1. Obtaining the complete features of THz absorption depends on the frequency and concentration of the solution. The 3D plots of AER-α binding ERP-α [Fig. 5a and b] are shown from 0.2 to 1.4 THz.
| AER-α (μg ml−1) | Ratio of binding sites, AER-α![[thin space (1/6-em)]](https://www.rsc.org/images/entities/char_2009.gif) : :![[thin space (1/6-em)]](https://www.rsc.org/images/entities/char_2009.gif) ERP-α ERP-α |
Molar ratio, AER-α![[thin space (1/6-em)]](https://www.rsc.org/images/entities/char_2009.gif) : :![[thin space (1/6-em)]](https://www.rsc.org/images/entities/char_2009.gif) ERP-α ERP-α |
|---|---|---|
| 7.8 | 0.352![[thin space (1/6-em)]](https://www.rsc.org/images/entities/char_2009.gif) : :![[thin space (1/6-em)]](https://www.rsc.org/images/entities/char_2009.gif) 1 1 |
0.176![[thin space (1/6-em)]](https://www.rsc.org/images/entities/char_2009.gif) : :![[thin space (1/6-em)]](https://www.rsc.org/images/entities/char_2009.gif) 1 1 |
| 15.6 | 0.706![[thin space (1/6-em)]](https://www.rsc.org/images/entities/char_2009.gif) : :![[thin space (1/6-em)]](https://www.rsc.org/images/entities/char_2009.gif) 1 1 |
0.352![[thin space (1/6-em)]](https://www.rsc.org/images/entities/char_2009.gif) : :![[thin space (1/6-em)]](https://www.rsc.org/images/entities/char_2009.gif) 1 1 |
| 31.3 | 1.41![[thin space (1/6-em)]](https://www.rsc.org/images/entities/char_2009.gif) : :![[thin space (1/6-em)]](https://www.rsc.org/images/entities/char_2009.gif) 1 1 |
0.706![[thin space (1/6-em)]](https://www.rsc.org/images/entities/char_2009.gif) : :![[thin space (1/6-em)]](https://www.rsc.org/images/entities/char_2009.gif) 1 1 |
| 62.5 | 2.82![[thin space (1/6-em)]](https://www.rsc.org/images/entities/char_2009.gif) : :![[thin space (1/6-em)]](https://www.rsc.org/images/entities/char_2009.gif) 1 1 |
1.41![[thin space (1/6-em)]](https://www.rsc.org/images/entities/char_2009.gif) : :![[thin space (1/6-em)]](https://www.rsc.org/images/entities/char_2009.gif) 1 1 |
| 125 | 5.64![[thin space (1/6-em)]](https://www.rsc.org/images/entities/char_2009.gif) : :![[thin space (1/6-em)]](https://www.rsc.org/images/entities/char_2009.gif) 1 1 |
2.82![[thin space (1/6-em)]](https://www.rsc.org/images/entities/char_2009.gif) : :![[thin space (1/6-em)]](https://www.rsc.org/images/entities/char_2009.gif) 1 1 |
| 250 | 11.28![[thin space (1/6-em)]](https://www.rsc.org/images/entities/char_2009.gif) : :![[thin space (1/6-em)]](https://www.rsc.org/images/entities/char_2009.gif) 1 1 |
5.64![[thin space (1/6-em)]](https://www.rsc.org/images/entities/char_2009.gif) : :![[thin space (1/6-em)]](https://www.rsc.org/images/entities/char_2009.gif) 1 1 |
| 500 | 22.56![[thin space (1/6-em)]](https://www.rsc.org/images/entities/char_2009.gif) : :![[thin space (1/6-em)]](https://www.rsc.org/images/entities/char_2009.gif) 1 1 |
11.28![[thin space (1/6-em)]](https://www.rsc.org/images/entities/char_2009.gif) : :![[thin space (1/6-em)]](https://www.rsc.org/images/entities/char_2009.gif) 1 1 |
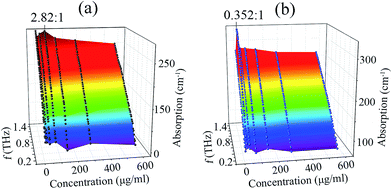 | ||
| Fig. 5 Concentration dependence of the absorption coefficient for (a) AER-α binding ERP-α (0.5 μg ml−1), (b) AER-α binding ERP-α (1 μg ml−1) solutions from 0.2 to 1.4 THz. | ||
To highlight the comparison of absorption behavior with the RBS of AER-α binding ERP-α solutions, we present the data at 1.1 THz in Fig. 6. A remarkable feature of the absorption of AER-α was observed at 62.5 μg ml−1 at 1.1 THz because of the occurrence of overlapping of the hydration shells according to the three-component THz absorption model.26,45–47
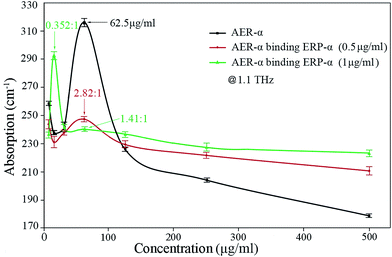 | ||
| Fig. 6 Absorption coefficient of AER-α, AER-α binding ERP-α (0.5 μg ml−1), and AER-α binding ERP-α (1 μg ml−1) solutions at 1.1 THz. | ||
The red line in Fig. 6 (AER-α and ERP-α binding (0.5 μg ml−1) reaction) shows that a similar absorption feature can be observed at a RBS of 2.82![[thin space (1/6-em)]](https://www.rsc.org/images/entities/char_2009.gif) :
:![[thin space (1/6-em)]](https://www.rsc.org/images/entities/char_2009.gif) 1. However, the green line (AER-α and ERP-α binding (1 μg ml−1) reaction) shows hardly any absorption peak at an RBS of 1.41
1. However, the green line (AER-α and ERP-α binding (1 μg ml−1) reaction) shows hardly any absorption peak at an RBS of 1.41![[thin space (1/6-em)]](https://www.rsc.org/images/entities/char_2009.gif) :
:![[thin space (1/6-em)]](https://www.rsc.org/images/entities/char_2009.gif) 1, indicating that the green line corresponds to the case that most of the AER-α was consumed, such that the hydration shell of AER-α completely disappeared. The binding interaction between AER-α and ERP-α causes the charged sites to diminish (red line in Fig. 6), and even to disappear (green line in Fig. 6). This is also observed for hemagglutinin protein binding with its antibody at different RBS or concentrations.39 Before binding, polarized water molecules and charged sites on the surface of the protein shape the hydration shell around the protein by electrostatics; after binding interaction, the charged sites decrease due to the neutralization, weakening the formation of hydration shells.
1, indicating that the green line corresponds to the case that most of the AER-α was consumed, such that the hydration shell of AER-α completely disappeared. The binding interaction between AER-α and ERP-α causes the charged sites to diminish (red line in Fig. 6), and even to disappear (green line in Fig. 6). This is also observed for hemagglutinin protein binding with its antibody at different RBS or concentrations.39 Before binding, polarized water molecules and charged sites on the surface of the protein shape the hydration shell around the protein by electrostatics; after binding interaction, the charged sites decrease due to the neutralization, weakening the formation of hydration shells.
Interestingly, a new absorption peak emerged at a RBS of 0.352![[thin space (1/6-em)]](https://www.rsc.org/images/entities/char_2009.gif) :
:![[thin space (1/6-em)]](https://www.rsc.org/images/entities/char_2009.gif) 1 (at AER-α concentration of 31.3 μg ml−1, green curve in Fig. 6), due to excess of ERP-α, as the AER-α was consumed completely, with the remaining ERP-α after the binding interaction with AER-α at a proper ratio still substantial in quantity, and it is difficult to hydrate at other concentrations. These excessive ERP-α has a similar interaction dynamics with water, as that of the pure ERP-α (black curve in Fig. 6), forming new hydration shells and leading to a new absorption peak before overlapping of the hydration shells occurs to dominate.
1 (at AER-α concentration of 31.3 μg ml−1, green curve in Fig. 6), due to excess of ERP-α, as the AER-α was consumed completely, with the remaining ERP-α after the binding interaction with AER-α at a proper ratio still substantial in quantity, and it is difficult to hydrate at other concentrations. These excessive ERP-α has a similar interaction dynamics with water, as that of the pure ERP-α (black curve in Fig. 6), forming new hydration shells and leading to a new absorption peak before overlapping of the hydration shells occurs to dominate.
The terahertz spectroscopic data of AER-α binding ERP-α indicate that the absorption coefficient began to decrease with an increasing ratio of the binding sites of AER-α to ERP-α beyond the optimum value (2.82![[thin space (1/6-em)]](https://www.rsc.org/images/entities/char_2009.gif) :
:![[thin space (1/6-em)]](https://www.rsc.org/images/entities/char_2009.gif) 1 for the red curve, and 1.41
1 for the red curve, and 1.41![[thin space (1/6-em)]](https://www.rsc.org/images/entities/char_2009.gif) :
:![[thin space (1/6-em)]](https://www.rsc.org/images/entities/char_2009.gif) 1 for the green curve). After that, the absorption coefficient shows a decreasing trend due to the excessive AER-α in solution. Therefore, from the variation of THz absorption of the mixed solution of the antibody and antigen before and after binding reaction, we can see that the THz spectroscopy can be used as an effective tool to detect the antigen–antibody binding reaction.
1 for the green curve). After that, the absorption coefficient shows a decreasing trend due to the excessive AER-α in solution. Therefore, from the variation of THz absorption of the mixed solution of the antibody and antigen before and after binding reaction, we can see that the THz spectroscopy can be used as an effective tool to detect the antigen–antibody binding reaction.
3.1 Dielectric loss measurement for AER-α binding ERP-α
As is customary in microwave engineering, the dielectric loss tangent is defined as tan![[thin space (1/6-em)]](https://www.rsc.org/images/entities/char_2009.gif) δ = ε′′/ε′, which characterizes the inherent dissipation capacity of a dielectric material in an electromagnetic field, where ε′ is the real part and ε′′ is the imaginary part of the complex dielectric permittivity, respectively.
δ = ε′′/ε′, which characterizes the inherent dissipation capacity of a dielectric material in an electromagnetic field, where ε′ is the real part and ε′′ is the imaginary part of the complex dielectric permittivity, respectively.
Fig. 7 presents the dielectric loss tangent for AER-α, AER-α binding ERP-α (0.5 μg ml−1) and AER-α binding ERP-α (1 μg ml−1) at 1.1 THz. In these three cases, the maximum dielectric loss appears at the concentration of 62.5 μg ml−1 and at the RBSs of 2.82![[thin space (1/6-em)]](https://www.rsc.org/images/entities/char_2009.gif) :
:![[thin space (1/6-em)]](https://www.rsc.org/images/entities/char_2009.gif) 1 and 0.352
1 and 0.352![[thin space (1/6-em)]](https://www.rsc.org/images/entities/char_2009.gif) :
:![[thin space (1/6-em)]](https://www.rsc.org/images/entities/char_2009.gif) 1, respectively, which are quite consistent with the positions appearing for the maximal THz absorption in Fig. 6. The large dielectric loss tangent at a given concentration describes the ability of the medium in converting electrical energy into heat. From Fig. 6 and 7, similar change trends of the THz absorption and the dielectric loss tangent with the AER-α concentration are easily observed. Hence, this dielectric loss tangent method is another means of verifying the exact antibody–antigen binding reaction.
1, respectively, which are quite consistent with the positions appearing for the maximal THz absorption in Fig. 6. The large dielectric loss tangent at a given concentration describes the ability of the medium in converting electrical energy into heat. From Fig. 6 and 7, similar change trends of the THz absorption and the dielectric loss tangent with the AER-α concentration are easily observed. Hence, this dielectric loss tangent method is another means of verifying the exact antibody–antigen binding reaction.
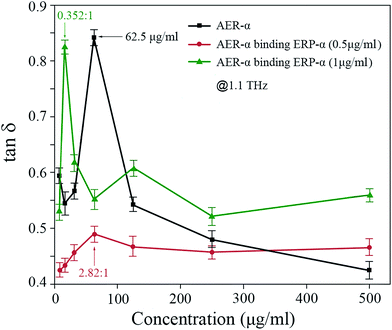 | ||
| Fig. 7 Plots of the dielectric loss tangent for AER-α, AER-α binding ERP-α (0.5 μg ml−1), and AER-α binding ERP-α (1 μg ml−1) at 1.1 THz. | ||
4. Conclusion
THz spectroscopy was employed to detect the binding reaction of AER-α with the AER-α-specific antigen ERP-α. Compared with classical methods of ELISA and IHC (see ESI†), THz spectroscopy is fast, convenient and label-free, which can potentially avoid the interference of the fluorescent agent in the binding reaction, and better reflect the true physiological state of the antigen–antibody binding. The measurement results showed that the hydration shell was constantly present in the AER-α, and AER-α/ERP-α solutions, and played an important role in the THz absorption of these solutions. However, the binding interaction of AER-α and ERP-α effectively caused the hydration shell to diminish gradually until it disappeared. This hitherto unreported phenomenon shows that THz spectroscopy can be used to detect the configurational change of protein caused by occupation and population of antibody/antigen binding sites. Dielectric loss tangent was employed as a useful tool for monitoring the AER-α and ERP-α binding interaction with high sensitivity. The measurements of AER-α with its specific antigen ERP-α indicate the unique capabilities of THz spectroscopy in the label-free probing of antibody–antigen binding. The approach presented herein demonstrates the potential applications of THz spectroscopy in reagent analysis and pharmaceutical synthesis.Acknowledgements
This work is supported by the Chinese Ministry of Science and Technology (Project No. 2012BAK04B03), National 973 Program of China (Project No. 2015CB755401) and the Chongqing Science and Technology Commission (Project No. cstc2013jcyjC00001 and cstc2013yykfC00007). We also gratefully acknowledge Kai Zhang and Xiang Zhang of BIOSS Co., Ltd. (Beijing, China) for carrying out the experiments with IHC and ELISA for AER-α binding ERP-α.References
- M. T. Weigel and M. Dowsett, Current and emerging biomarkers in breast cancer: prognosis and prediction, Endocr.-Relat. Cancer, 2010, 17, R245 CrossRef CAS PubMed
.
- S. Ali and R. C. Coombes, Estrogen receptor alpha in human breast cancer: occurrence and significance, J. Mammary Gland Biol. Neoplasia, 2000, 5, 271–281 CrossRef CAS PubMed
.
- V. C. Jordan, S. Gapstur and M. Morrow, Selective Estrogen Receptor Modulation and Reduction in Risk of Breast Cancer, Osteoporosis, and Coronary Heart Disease, J. Natl. Cancer Inst., 2001, 93, 1449–1457 CrossRef CAS PubMed
.
- M. E. Lippman and J. C. Allegra, Quantitative estrogen receptor analyses: The response to endocrine and cytotoxic chemotherapy in human breast cancer and the disease-free interval, Cancer, 1980, 46, 2829–2834 CrossRef CAS PubMed
.
- S. Narod, Re: Tamoxifen for prevention of breast cancer: report of the National Surgical Adjuvant Breast and Bowel Project P-1 study, J. Natl. Cancer Inst., 1998, 97, 643–644 Search PubMed
.
- M. Sawaki, M. Wada, Y. Sato, Y. Mizuno, H. Kobayashi, K. Yokoi, M. Yoshihara, K. Kamei, M. Ohno and T. Imai, High-dose toremifene as first-line treatment of metastatic breast cancer resistant to adjuvant aromatase inhibitor: A multicenter phase II study, Oncol. Lett., 2012, 3, 61 CAS
.
- A. E. Wakeling, M. Dukes and J. Bowler, A potent specific pure antiestrogen with clinical potential, Cancer Res., 1991, 51, 3867 CAS
.
- J. L. Flowers, G. V. Burton, E. B. Cox, K. S. McCarty Sr, G. A. Dent, K. R. Geisinger and K. S. McCarty Jr, Use of monoclonal antiestrogen receptor antibody to evaluate estrogen receptor content in fine needle aspiration breast biopsies, Ann. Surg., 1986, 203, 250–254 CrossRef CAS PubMed
.
- G. Bogina, G. Zamboni, A. Sapino, L. Bortesi, M. Marconi, G. Lunardi, F. Coati, A. Massocco, L. Molinaro and C. Pegoraro, Comparison of Anti-Estrogen Receptor Antibodies SP1, 6F11, and 1D5 in Breast Cancer, Am. J. Clin. Pathol., 2012, 138, 697 CrossRef CAS PubMed
.
- M. Ferrero-Poüs, M. Trassard, D. V. Le, K. Hacène, M. Tubiana-Hulin and F. Spyratos, Comparison of enzyme immunoassay and immunohistochemical measurements of estrogen and progesterone receptors in breast cancer patients, Appl. Immunohistochem. Mol. Morphol., 2001, 9, 267–275 Search PubMed
.
- M. Pavao and A. M. Traish, Estrogen receptor antibodies: specificity and utility in detection, localization and analyses of estrogen receptor alpha and beta, Steroids, 2001, 66, 1–16 CrossRef CAS PubMed
.
- A. Mudarris and E. J. Peck Jr, Human anti-estrogen receptor antibodies: assay, characterization, and age- and sex-related differences, J. Clin. Endocrinol. Metab., 1987, 64, 246–254 CrossRef CAS PubMed
.
- V. V. Tyulmenkov and C. M. Klinge, Selectivity of antibodies to estrogen receptors α and β (ERα and ERβ) for detecting DNA-bound ERα and ERβ in vitro, Steroids, 2000, 65, 505–512 CrossRef CAS PubMed
.
- R. Hai, F. Krammer, G. S. Tan, N. Pica, D. Eggink, J. Maamary, I. Margine, R. A. Albrecht and P. Palese, Influenza Viruses Expressing Chimeric Hemagglutinins: Globular Head and Stalk Domains Derived from Different Subtypes, J. Virol., 2012, 86, 5774–5781 CrossRef CAS PubMed
.
- R. C. Bast Jr, T. L. Klug, J. E. St, E. Jenison, J. M. Niloff, H. Lazarus, R. S. Berkowitz, T. Leavitt, C. T. Griffiths and L. Parker, A radioimmunoassay using a monoclonal antibody to monitor the course of epithelial ovarian cancer, N. Engl. J. Med., 1983, 309, 883–887 CrossRef CAS PubMed
.
- J. Sui, W. C. Hwang, S. Perez, G. Wei, D. Aird, L. Chen, E. Santelli, B. Stec, G. Cadwell and M. Ali, Structural and functional bases for broad-spectrum neutralization of avian and human influenza A viruses, Nat. Struct. Mol. Biol., 2009, 16, 265 CAS
.
- C. C. Liu, S. Sadhasivam, S. Savitha and F. H. Lin, Fabrication of multiwalled carbon nanotubes–magnetite nanocomposite as an effective ultra-sensing platform for the early screening of nasopharyngeal carcinoma by luminescence immunoassay, Talanta, 2014, 122, 195 CrossRef CAS PubMed
.
- S. Sadhasivam, J. C. Chen, S. Savitha, C. W. Chang and F. H. Lin, Application of carbon nanotubes layered on silicon wafer for the detection of breast cancer marker carbohydrate antigen 15-3 by immuno-polymerase chain reaction, J. Mater. Sci.: Mater. Med., 2014, 25, 101–111 CrossRef CAS PubMed
.
- N. Zohoury, Autoantibodies to domain 1 of beta 2 glycoprotein I determined using a novel chemiluminescence immunoassay demonstrate association with thrombosis in patients with antiphospholipid syndrome, Lupus, 2016, 25, 911–916 CrossRef PubMed
.
- X. C. Zhang, Terahertz wave imaging: horizons and hurdles, Phys. Med. Biol., 2002, 47, 3667–3677 CrossRef CAS PubMed
.
- Z. P. Zheng, W. H. Fan, H. Li and J. Tang, Terahertz spectral investigation of anhydrous and monohydrated glucose using terahertz spectroscopy and solid-state theory, J. Mol. Spectrosc., 2014, 296, 9–13 CrossRef CAS
.
- M. Yamaguchi, F. Miyamaru, K. Yamamoto, M. Tani and M. Hangyo, Terahertz absorption spectra of L-, D-, and DL-alanine and their application to determination of enantiomeric composition, Appl. Phys. Lett., 2005, 86, 3625 Search PubMed
.
- R. Nishikiori, M. Yamaguchi, K. Takano, T. Enatsu, M. Tani, U. C. de Silva, N. Kawashita, T. Takagi, S. Morimoto and M. Hangyo, Application of partial least square on quantitative analysis of L-, D-, and DL-tartaric acid by terahertz absorption spectra, Chem. Pharm. Bull., 2008, 56, 305–307 CrossRef CAS PubMed
.
- H. Hintzsche, C. Jastrow, T. Kleineostmann, U. Kärst, T. Schrader and H. Stopper, Terahertz Electromagnetic Fields (0.106 THz) Do Not Induce Manifest Genomic Damage In Vitro, PLoS One, 2012, 7, e46397 CAS
.
- A. N. Bogomazova, E. M. Vassina, T. N. Goryachkovskaya, V. M. Popik, A. S. Sokolov, N. A. Kolchanov, M. A. Lagarkova, S. L. Kiselev and S. E. Peltek, No DNA damage response and negligible genome-wide transcriptional changes in human embryonic stem cells exposed to terahertz radiation, Sci. Rep., 2014, 5, 7749 CrossRef PubMed
.
- B. Born, S. J. Kim, S. Ebbinghaus, M. Gruebele and M. Havenith, The terahertz dance of water with the proteins: the effect of protein flexibility on the dynamical hydration shell of ubiquitin, Faraday Discuss., 2009, 141, 161 RSC
.
- N. Samanta, D. D. Mahanta and R. K. Mitra, Collective hydration dynamics of guanidinium chloride solutions and its possible role in protein denaturation: a terahertz spectroscopic study, Phys. Chem. Chem. Phys., 2014, 16, 23308–23315 RSC
.
- S. Funkner, G. Niehues, D. A. Schmidt, M. Heyden, G. Schwaab, K. M. Callahan, D. J. Tobias and M. Havenith, Watching the low-frequency motions in aqueous salt solutions: the terahertz vibrational signatures of hydrated ions, J. Am. Chem. Soc., 2012, 134, 1030–1035 CrossRef CAS PubMed
.
- D. M. Leitner, M. Gruebele and M. Havenith, Solvation dynamics of biomolecules: modeling and terahertz experiments, HFSP J., 2008, 2, 314 CrossRef CAS PubMed
.
- L. Liu, R. Pathak, L. J. Cheng and T. Wang, Real-time frequency-domain terahertz sensing and imaging of isopropyl alcohol–water mixtures on a microfluidic chip, Sens. Actuators, B, 2013, 184, 228–234 CrossRef CAS
.
- T. Q. Luong, P. K. Verma, R. K. Mitra and M. Havenith, Onset of hydrogen bonded collective network of water in 1,4-dioxane, J. Phys. Chem. A, 2011, 115, 14462–14469 CrossRef CAS PubMed
.
- M. Heyden and M. Havenith, Combining THz spectroscopy and MD simulations to study protein-hydration coupling, Methods, 2010, 52, 74–83 CrossRef CAS PubMed
.
- P. U. Jepsen, U. Møller and H. Merbold, Investigation of aqueous alcohol
and sugar solutions with reflection terahertz time-domain spectroscopy, Opt. Express, 2007, 15, 14717 CrossRef CAS PubMed
.
- B. A. Mazzeo and A. J. Flewitt, Observation of protein-protein interaction by dielectric relaxation spectroscopy of protein solutions for biosensor application, Appl. Phys. Lett., 2007, 90, 123901 CrossRef
.
- R. K. Kotnala, M. A. Dar, V. Verma, A. P. Singh and W. A. Siddiqui, Minimizing of power loss in Li–Cd ferrite by nickel substitution for power applications, J. Magn. Magn. Mater., 2010, 322, 3714–3719 CrossRef CAS
.
- N. Karamat, I. Ali, A. Aziz, M. Sher and M. N. Ashiq, Electrical and dielectric studies of substituted holmium based pyrochlore zirconates nanomaterials, J. Alloys Compd., 2015, 652, 83–90 CrossRef CAS
.
- Y. Y. Pittinia, R. Pittini, S. Vaucher, L. Rohr, S. Leparoux and H. Leuenberger, Cole–Cole plot analysis of dielectric behavior of monoalkyl ethers of polyethylene glycol (CnEm), Eur. Polym. J., 2008, 44, 1191–1199 CrossRef
.
- R. A. Broglia, L. Serrano and G. Tiana, Protein Folding and Drug Design, IOS Press, United States, 2007 Search PubMed
.
- Y. Sun, J. Zhong, C. Zhang, J. Zuo and E. Pickwellmacpherson, Label-free detection and characterization of the binding of hemagglutinin protein and broadly neutralizing monoclonal antibodies using terahertz spectroscopy, J. Biomed. Opt., 2015, 20, 037006 CrossRef PubMed
.
- B. Born and M. Havenith, Terahertz Dance of Proteins and Sugars with Water, J. Infrared, Millimeter, Terahertz Waves, 2009, 30, 1245–1254 CAS
.
- X. Yang, D. Wei, S. Yan, Y. Liu, S. Yu, M. Zhang, Z. Yang, X. Zhu, Q. Huang and H. L. Cui, Rapid and label-free detection and assessment of bacteria by terahertz time-domain spectroscopy, J. Biophotonics, 2016, 9, 1050 CrossRef CAS PubMed
.
- J. T. Kindt and C. A. Schmuttenmaer, Far-Infrared Dielectric Properties of Polar Liquids Probed by Femtosecond Terahertz Pulse Spectroscopy, J. Phys. Chem., 1996, 100, 10373–10379 CrossRef CAS
.
- M. Tang, Q. Huang, D. Wei, G. Zhao, T. Chang, K. Kou, M. Wang, C. Du, W. L. Fu and H. L. Cui, Terahertz spectroscopy of oligonucleotides in aqueous solutions, J. Biomed. Opt., 2015, 20, 095009 CrossRef PubMed
.
- O. P. Cherkasova, M. M. Nazarov, A. A. Angeluts and A. P. Shkurinov, Analysis of blood plasma at terahertz frequencies, Opt. Spectrosc., 2016, 120, 50–57 CrossRef CAS
.
- S. Yan, D. Wei, M. Tang, C. Shi, M. Zhang, Z. Yang, C. Du and H. L. Cui, Determination of Critical Micelle Concentrations of Surfactants by Terahertz Time-Domain Spectroscopy, IEEE Trans. Terahertz Sci. Technol., 2016, 6, 532–540 CrossRef
.
- Y. Sun, Y. Zhang and E. Pickwellmacpherson, Investigating antibody interactions with a polar liquid using terahertz pulsed spectroscopy, Biophys. J., 2010, 100, 225–231 CrossRef PubMed
.
- J. W. Bye, S. Meliga, D. Ferachou, G. Cinque, J. A. Zeitler and R. J. Falconer, Analysis of the hydration water around bovine serum albumin using terahertz coherent synchrotron radiation, J. Phys. Chem. A, 2014, 118, 83 CrossRef CAS PubMed
.
- U. Heugen, G. Schwaab, E. Bründermann, M. Heyden, X. Yu, D. M. Leitner and M. Havenith, Solute-induced retardation of water dynamics probed directly by terahertz spectroscopy, Proc. Natl. Acad. Sci. U. S. A., 2006, 103, 12301 CrossRef CAS PubMed
.
- D. K. Das, A. Patra and R. K. Mitra, Preferential solvation of lysozyme in dimethyl sulfoxide/water binary mixture probed by terahertz spectroscopy, Biophys. Chem., 2016, 216, 31–36 CrossRef CAS PubMed
.
Footnote |
| † Electronic supplementary information (ESI) available. See DOI: 10.1039/c6ra28754a |
| This journal is © The Royal Society of Chemistry 2017 |

