
 Open Access Article
 This Open Access Article is licensed under a
 Creative Commons Attribution 3.0 Unported Licence
Determination of amino groups on functionalized graphene oxide for polyurethane nanomaterials: XPS quantitation vs. functional speciation†
Jakub Ederer *a,
Pavel Janoša,
Petra Ecorchardb,
Jakub Tolaszb,
Václav Štenglb,
Hynek Benešc,
Magdalena Perchaczc and
Ognen Pop-Georgievskid
*a,
Pavel Janoša,
Petra Ecorchardb,
Jakub Tolaszb,
Václav Štenglb,
Hynek Benešc,
Magdalena Perchaczc and
Ognen Pop-Georgievskid
aFaculty of Environment, University of Jan Evangelista Purkyně, Králova Výšina 7, 400 96 Ústí nad Labem, Czech Republic. E-mail: jakub.ederer@ujep.cz; Fax: +420-475-284-158; Tel: +420-475-284-111
bDepartment of Materials Chemistry, Institute of Inorganic Chemistry, AS CR v.v.i., Husinec-Řež Sq. 1001, 250 68 Řež, Czech Republic
cDepartment of Polymer Processing, Institute of Macromolecular Chemistry, AS CR, v.v.i., Prague, Czech Republic
dDepartment of Chemistry and Physics of Surfaces and Biointerfaces, Institute of Macromolecular Chemistry, AS CR, v.v.i., Prague, Czech Republic
First published on 21st February 2017
Abstract
Amino-functionalized graphene oxide was reacted with isocyanate monomer to evaluate the potential application of GO-NH2 as a functional filler for the preparation of polyurethane nanocomposites. A set of advanced techniques (XRD, FTIR spectroscopy, Raman spectroscopy, and TEM) was used to characterize the functionalized samples, together with elemental analysis and XPS, which provided valuable information on the total N content and the nitrogen (chemical) speciation, respectively. In addition, a simple and fast spectrophotometric method was developed for the estimation of accessible amino groups (functional speciation). The method is based on the interaction of NH2 groups with the anionic dye acid orange 7 under appropriate conditions (pH = 3.6) and shows good precision. It can be advantageously used for the fast evaluation of the GO-NH2 reactivity with isocyanate monomer and its applicability as the polymer filler.
1. Introduction
Whereas physicists are still fascinated with the semiconducting properties,1 room temperature quantum effects2,3 and other unique phenomena of graphene and other low-dimensional carbon structures, chemists have found the chemistry of graphene somewhat poor4 and turned back to related laminar materials bearing various (mainly oxygen-containing) functional groups, many of which were introduced years before Geim and Novoselov's discovery – see, e.g., Hummers and Offeman's ‘graphitic oxide’.5The new generation of graphene derivatives include hydrogenated graphene (graphane), fluorinated graphene (fluorographene)6 and graphene introduced with acetylenic chains (graphyne and graphdiyne),7 as well as sulfonated graphene8 or N-containing reduced graphene oxide (GO).9 Introduction of the above-mentioned functional groups to the structure of GO improves not only the dispersibility and solubility of this material but also its reaction with other organic molecules, polymers and biological systems.10–12 Nitrogenous functional groups incorporated into the carbon network can act as active sites for redox reactions.16 Amino-functionalized carbon materials (GO, CNTs, graphene, etc.) have found numerous applications as nanofillers in polymer composites and coatings,17 metal-free catalysts for oxygen reduction reactions,18 photoluminescent materials19 and materials for immobilization or release of biologically active molecules.20 The amino groups are also responsible for the antimicrobial properties of the material, via their interaction with negatively charged cell walls.21
Commonly used methods of introducing amino groups into the GO structure, either during the synthesis of GO precursors or via the post-synthetic modification of GO,9,10 include doping under hydrothermal conditions with aqueous ammonia or hydrazine,10,13 ammonia plasma treatment at high temperature14 or Hoffman rearrangement.15
Considering the application of GO as nanofiller for the preparation of GO/polyurethane nanocomposites with improved mechanical, thermal, electrical and flame retardant properties, good interfacial adhesion between the nanofiller and polymer matrix must be provided.17,22–24 Various methods of GO chemical modification have been developed to enable the creation of covalent bonding between GO and polyurethane precursors.25 The amino-functionalized GO was identified as a promising polymer filler, as its primary amino groups readily react with polyisocyanates.26–28 Knowledges about the presence of the NH2 groups on the GO surface and about their accessibility for the reaction with isocyanates are fundamental to preserve the correct stoichiometry during the course of polymerization, ensuring a high polymerization degree of the final nanocomposites.
There are several methods for the analysis of ammonia surface functionalities (–NH2 functionalities) or other type of functionalities. Basic methods used for the determination and evaluation of surface functionalities include spectroscopic techniques (XPS, FTIR, UV/VIS), as well as some less common methods, such as thermogravimetric analysis and contact angle measurement9,29 or titration methods.30,31 For example, XPS provides information about surface energies, surface composition and the morphology of the surface.32–34
It is shown in this paper that the XPS technique in combination with some simple operationally defined procedures provides more comprehensive information on the usability of GO-NH2 as a functional filler in polyurethane nanocomposites; whereas XPS distinguishes between various forms of nitrogen in the GO-NH2 molecule (chemical speciation), a newly developed indirect spectrometric method quantifies the fraction of NH2 groups that are available for further derivatization (functional speciation).
2. Experimental
2.1. Chemicals
All purchased chemicals were of analytical grade. Acid orange 7 (AO7) was purchased from Sigma-Aldrich (Germany). NaOH, CH3COOH, H3BO3 and H3PO4 for preparation of Britton-Robinson buffer (BRB) were purchased from Lach-Ner, Ltd. A stock solution of anionic dye was prepared in BRB (pH = 3.60). KBr (FTIR grade, ≥99% trace metal basis) was used for FTIR measurement and purchased from Sigma-Aldrich (Germany). Deionized water from a GORO Pharmpur system (Goro, Prague, Czech Republic) was used in all experiments with AO7. GO and ammonia-functionalized graphene oxide (GO-NH2) were purchased from Sigma-Aldrich (Germany). All chemical reagents 96% H2SO4, 85% H3PO4, KMnO4, NH4OH, H2O2 and ethylene glycol used for the synthesis of GO and GO-NH2 were obtained from commercial sources: Penta, Ltd., and Lach-Ner, Ltd. Natural graphite was supplied by Koh-i-noor Grafite, Ltd., Czech Republic. Chemicals used in the reaction with isocyanate-butyl acetate (>99%, Sigma-Aldrich, Germany) were stored over 4 Å molecular sieves prior to use: 1,6-diisocyanatohexane (HDI) (Desmodur™ H, Covestro, Germany) and dibutyltin dilaurate (95%, Sigma Aldrich, Germany).2.2. Preparation of the samples
2.3. Reaction of amino-functionalized graphene oxide with isocyanate
GO-NH2 was dried at 80 °C for 24 hours under vacuum. GO-NH2 (25 mg) was dispersed in dried n-butyl acetate (1 mL) using an ultrasonic bath for 60 minutes. Then, 1,6-diisocyanatohexane (2.17 mg) in n-butyl acetate solution was added, keeping the initial NCO/NH2 molar ratio of 1/1, and the mixture was sonicated for 60 minutes. Finally, a 1 wt% solution of dibutyltin dilaurate (0.2 mL) was added as a catalyst. The reaction mixture was kept at 40 °C under sonication during the reaction between GO-NH2 and HDI.The same experiment was also performed for the unmodified GO.
2.4. Characterization of the samples
The prepared samples were characterized by XRD, Raman spectroscopy, TEM, XPS, FTIR spectroscopy and elemental analysis (EA). XRD patterns were collected using a Bruker D2 diffractometer equipped with a conventional X-ray tube (CuKα radiation, 30 kV, 10 mA). Raman spectra were acquired with a DXR Raman microscope (Thermo Scientific), and 32 two-second scans were collected with a 532 nm (3 mW) laser under a 10× objective Olympus microscope.The morphology of the samples and visual changes before and after sorption were inspected by high-resolution transmission electron microscopy (HRTEM) using a 120 kV TEM microscope (FEI Talos F200X). Microscopic copper grids covered by a thin transparent silicon dioxide film or lacey carbon were used as specimen supports for TEM investigations. XPS measurements were performed using a K-Alpha + XPS spectrometer (Thermo Fisher Scientific, UK) operating at a base pressure of 1.0 × 10⁻⁷ Pa. The data acquisition and processing were performed using the Thermo Avantage software. All samples were analysed using microfocused, monochromated Al Kα X-ray radiation (400 μm spot size) with a pass energy of 200 eV for survey spectra and 50 eV for high-energy resolution core level spectra. The X-ray angle of incidence was 30°, and the emission angle was along the surface normal. The K-Alpha charge dual compensation system was employed during analysis, using electrons and low-energy argon ions to prevent any localized charge build-up. The obtained high-resolution spectra were fitted with Voigt profiles. The analyser transmission function, Scofield sensitivity factors, and effective attenuation lengths (EALs) for photoelectrons were applied for quantification. EALs were calculated using the standard TPP-2M formalism. All spectra were referenced to the C 1s peak attributed to C–C, C–H at a binding energy of 285.0 eV, which was controlled by means of the well-known photoelectron peaks of metallic Cu, Ag, and Au.
The FTIR spectra of GO and GO-NH2 before and after sorption were measured by a diffuse reflectance Nicolet 6700 IR spectrophotometer (Thermo Scientific) in transmittance mode in the 400−4000 cm−1 range at 100 scans per spectrum with 4 cm−1 resolution. Raw FTIR data were processed utilizing the OMNIC 7.3 software. The samples for FTIR analysis were first lyophilized for 24 hours, subsequently ground in an agate mortar with KBr in a ratio from 1![[thin space (1/6-em)]](https://www.rsc.org/images/entities/char_2009.gif) :100 to 1:400, and finally placed in a ball mill for 5 minutes. KBr pellets of 13 mm diameter were prepared using a hydraulic press (80 kN) for 5 minutes. FTIR spectra of the reaction mixtures with isocyanate were measured using the attenuated total reflectance (ATR) technique on a Spectrum 100T FTIR spectrometer (PerkinElmer, USA) with a DTSG detector equipped with a Universal ATR diamond/ZnSe crystal. All spectra were recorded in the 650−4000 cm−1 range at 16 scans per spectrum with 4 cm−1 resolution.
:100 to 1:400, and finally placed in a ball mill for 5 minutes. KBr pellets of 13 mm diameter were prepared using a hydraulic press (80 kN) for 5 minutes. FTIR spectra of the reaction mixtures with isocyanate were measured using the attenuated total reflectance (ATR) technique on a Spectrum 100T FTIR spectrometer (PerkinElmer, USA) with a DTSG detector equipped with a Universal ATR diamond/ZnSe crystal. All spectra were recorded in the 650−4000 cm−1 range at 16 scans per spectrum with 4 cm−1 resolution.
Elemental analysis (EA) was performed on a PE 2400 Series II CHNS/O analyser (Perkin Elmer, USA).
2.5. Spectrophotometric determination of the amino groups
Adsorption studies were performed in 2 mL Eppendorf vials, to which a GO suspension (200 μL), stock solution of AO7 (concentration range from 2.5 × 10⁻⁴ to 4.5 × 10⁻⁵ mol L−1) and BRB were added. For the equilibrium studies, the experiment was carried out for 3 hours at 25 ± 1 °C to ensure that equilibrium was reached. Subsequently, the Eppendorf vials were centrifuged at 14000 RPM for 30 minutes. The equilibrium concentration of AO7 in the supernatant solution was determined using a UV/VIS spectrophotometer (Cintra 2020, GBC Scientific Equipment, Australia, controlled by Cintral software vs. 2.6.) at its maximum wavelength λ = 484 nm. The AO7 concentration was determined by comparing the absorbance to a previously obtained calibration curve. All experiments were performed in triplicate, and the mean values were reported. The amount of anionic dye adsorbed on the GO samples at equilibrium qE (mmol g−1) was calculated using the following equation:
 | (1) |
3. Results and discussion
3.1. Characterization of GO and GO-NH2
The quality of GO and GO-NH2 was determined by X-ray diffraction (see Fig. S1†) and Raman spectroscopy (see Fig. S2†), and the results are presented and discussed in the ESI.†The surface composition of the pristine and amino-functionalized GO materials was analysed by XPS. Fig. 1 gives the high-resolution C 1s, N 1s and O 1s spectra of the different GO materials. The individual contributions within the high-resolution spectra are reported in Table 1. The C 1s spectrum of pristine GO is characterized by contributions at 284.2 ± 0.1, 285.0, 285.9 ± 0.1, 286.5 ± 0.3, 287.7 ± 0.5 and 288.8 ± 0.2 eV, arising from the ![[C with combining low line]](https://www.rsc.org/images/entities/char_0043_0332.gif)
![[double bond, length as m-dash]](https://www.rsc.org/images/entities/char_e001.gif) C (sp2 bonded carbons), –C (sp3 bonded carbons), alkoxy –O–H (and diminishing –N), ether and epoxy –O–C, carbonyl O, and ester and carboxy (O)–O moieties, respectively. The weakly pronounced peak at 291.2 ± 0.5 eV arises from the π → π* shake-up transition. The C 1s spectra clearly show changes in the chemical structure of GO by ammonia treatment. While the C 1s spectrum of the starting non-modified GO is dominated by strong ether and epoxy contributions (ca. 28 at%) at approximately 286.5 eV, the spectrum of GO-NH2 prepared by the herein elaborated method shows only moderate presence of these moieties (not exceeding 5 at%). The spectrum of commercially available GO-2 (GO-NH2 SA) shows approximately 18 at% of these moieties. Strikingly, compared to its unmodified GO counterpart, the GO-1 (GO-NH2) material is characterized by stronger contributions at approximately 286.0 eV. Though strongly overlapped with the alkoxy C–O–H contributions, this observation is indicative of the higher concentration of C–N and CN moieties.
C (sp2 bonded carbons), –C (sp3 bonded carbons), alkoxy –O–H (and diminishing –N), ether and epoxy –O–C, carbonyl O, and ester and carboxy (O)–O moieties, respectively. The weakly pronounced peak at 291.2 ± 0.5 eV arises from the π → π* shake-up transition. The C 1s spectra clearly show changes in the chemical structure of GO by ammonia treatment. While the C 1s spectrum of the starting non-modified GO is dominated by strong ether and epoxy contributions (ca. 28 at%) at approximately 286.5 eV, the spectrum of GO-NH2 prepared by the herein elaborated method shows only moderate presence of these moieties (not exceeding 5 at%). The spectrum of commercially available GO-2 (GO-NH2 SA) shows approximately 18 at% of these moieties. Strikingly, compared to its unmodified GO counterpart, the GO-1 (GO-NH2) material is characterized by stronger contributions at approximately 286.0 eV. Though strongly overlapped with the alkoxy C–O–H contributions, this observation is indicative of the higher concentration of C–N and CN moieties.
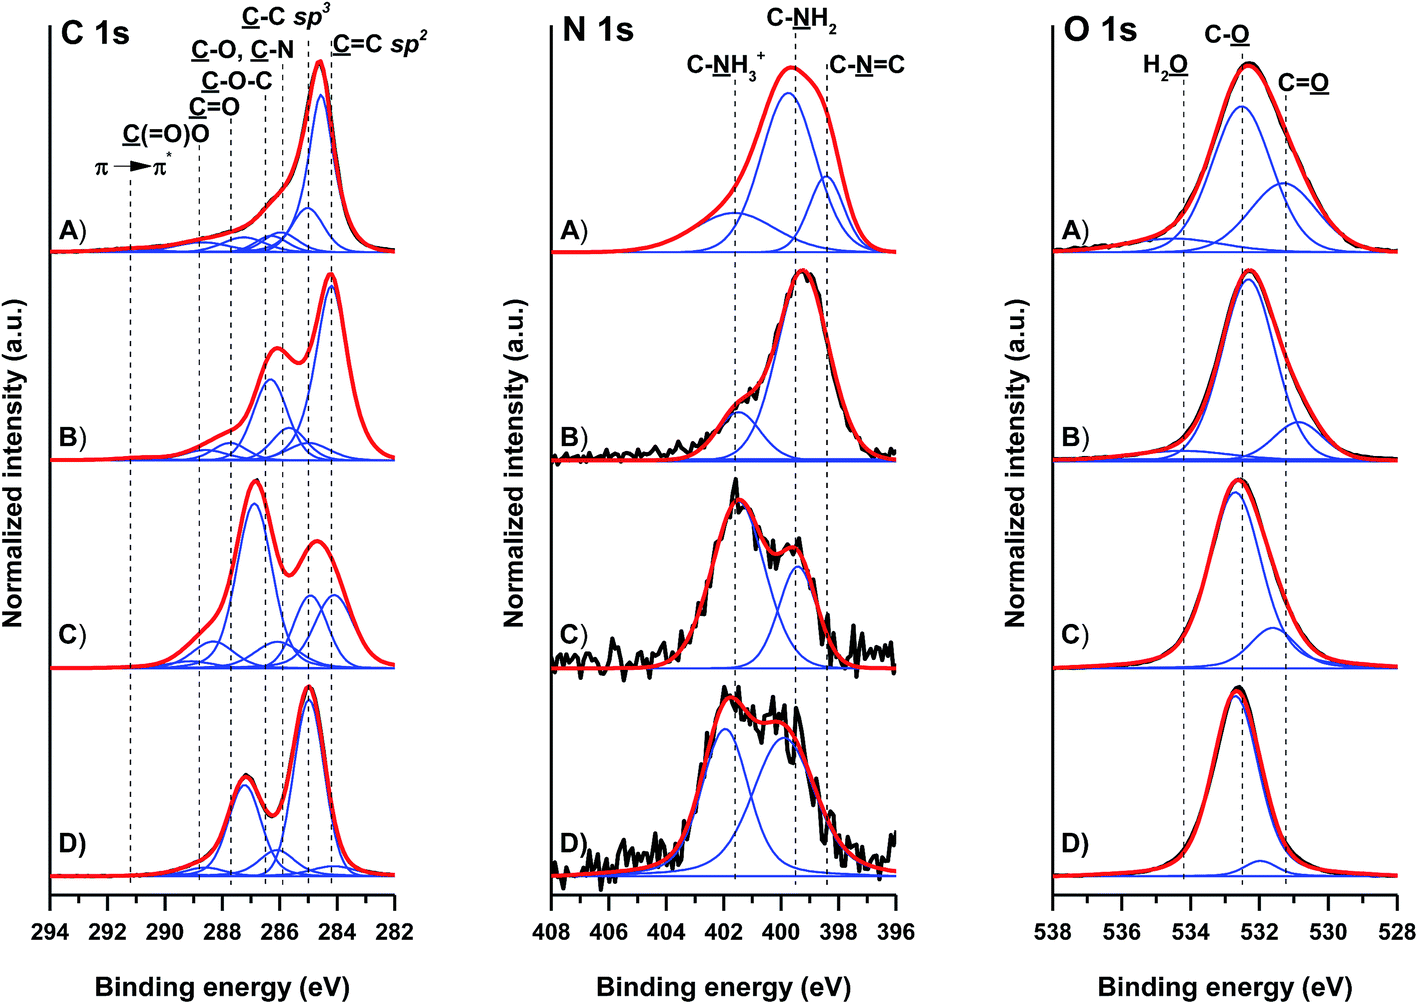 | ||
| Fig. 1 High-resolution core-level C 1s, N 1s and O 1s XPS spectra of GO-NH2 ((A) GO-1 and (B) GO-2) and GO ((C) GO-3 and (D) GO-4). The measured spectra are presented with black lines, while their corresponding fitted envelopes are presented in red. The individual contributions of different functional groups present in the materials are represented with blue lines. | ||
| Moiety | Binding energy [eV] | GO-1 [at%] | GO-2 [at%] | GO-3 [at%] | GO-4 [at%] | |
|---|---|---|---|---|---|---|
| a Value was below the detection limit of XPS analysis. | ||||||
| C 1s | C |
284.2 ± 0.1 | 41.0 ± 2.7 | 32.4 ± 3.4 | 12.1 ± 1.6 | 3.5 ± 0.6 |
| –C |
285.0 | 11.4 ± 0.3 | 7.0 ± 2.6 | 13.7 ± 2.4 | 33.2 ± 6.3 | |
| –OH, –NH2 |
285.9 ± 0.1 | 6.6 ± 0.2 | 5.3 ± 1.3 | 4.8 ± 1.2 | 7.6 ± 0.9 | |
| –O–C |
286.5 ± 0.3 | 3.0 ± 0.7 | 17.9 ± 1.3 | 28.6 ± 1.6 | 18.5 ± 5.1 | |
| O |
287.7 ± 0.5 | 6.2 ± 0.3 | 4.6 ± 1.3 | 4.5 ± 0.6 | 2.2 ± 0.5 | |
| (O)–O |
288.8 ± 0.2 | 4.8 ± 0.2 | 2.6 ± 0.1 | 1.6 ± 0.4 | 1.2 ± 0.5 | |
| π → π* | 291.2 ± 0.3 | 1.3 ± 0.1 | 0.7 ± 0.2 | 0.1 ± 0.1 | —a | |
| N 1s | C–![[N with combining low line]](https://www.rsc.org/images/entities/char_004e_0332.gif) C C |
398.4 ± 0.2 | 1.4 ± 0.2 | —a | —a | —a |
| C–H2 |
399.5 ± 0.3 | 3.2 ± 0.1 | 2.3 ± 0.3 | 0.4 ± 0.1 | 0.9 ± 0.3 | |
| C–H3+ |
401.6 ± 0.7 | 1.5 ± 0.1 | 0.9 ± 0.3 | 0.7 ± 0.1 | 0.5 ± 0.2 | |
| O 1s | ![[O with combining low line]](https://www.rsc.org/images/entities/char_004f_0332.gif) C C |
531.2 ± 0.3 | 9.0 ± 2.6 | 4.6 ± 0.7 | 4.7 ± 1.0 | 2.3 ± 1.2 |
| –C |
532.5 ± 0.2 | 7.2 ± 1.6 | 19.7 ± 0.7 | 28.7 ± 0.7 | 30.2 ± 1.5 | |
| H2 |
534.2 ± 0.4 | 3.4 ± 1.3 | 2.1 ± 0.1 | —a | —a | |
Changes due to the introduction of nitrogen species within the GO structure are observed in the high-resolution N 1s spectra. While the nitrogen contribution in unmodified GO did not overcome 1.4 at%, the total contribution of nitrogen in GO-1 was approximately 6 at%. Contrary to this, the total nitrogen contribution in commercially available GO-2 was about 3 at%. The N 1s spectra of GO-2, GO-3 and GO-4 showed two contributions at approximately 399.5 and 401.5 eV, arising from the amine and charged amine moieties, respectively. The spectra of the prepared GO-1 showed a significantly higher concentration of these moieties (more than 3 at% amines) and an additional contribution at approximately 389.5 eV, arising from CN aromatic nitrogen. The O 1s spectra could be fitted with three contributions arising from OC, O–C and residual H2O. The O 1s spectrum further verified the observation of the reduced presence of ether and epoxy moieties in the GO-1 sample. The XPS data clearly evidenced the more efficient introduction of amine groups by the herein used modification route.
EA confirmed the higher content of nitrogen in all GO-NH2 samples (GO-1 and GO-2), with 3.7% nitrogen in GO-1 and 4.1% nitrogen in GO-2. In comparison to the pristine GO samples, where content of nitrogen was negligible, respectively, for GO-3 0.23% and GO-4 0.53% of nitrogen.
3.2. Reactivity of GO-NH2
As revealed by XPS analysis (Table 1), the amino-functionalized GO contains sufficient amounts of N-containing groups or moieties of a different nature. In the following experiments, the reaction with isocyanate was used to verify the accessibility of primary amino groups in GO-NH2 for reaction with HDI monomer and thus evaluate the potential application of GO-NH2 as a functional filler for the preparation of polyurethane nanocomposites. The reaction between the amino groups of GO-NH2 and the isocyanate groups of HDI results in the formation of substituted urea according to Scheme 1.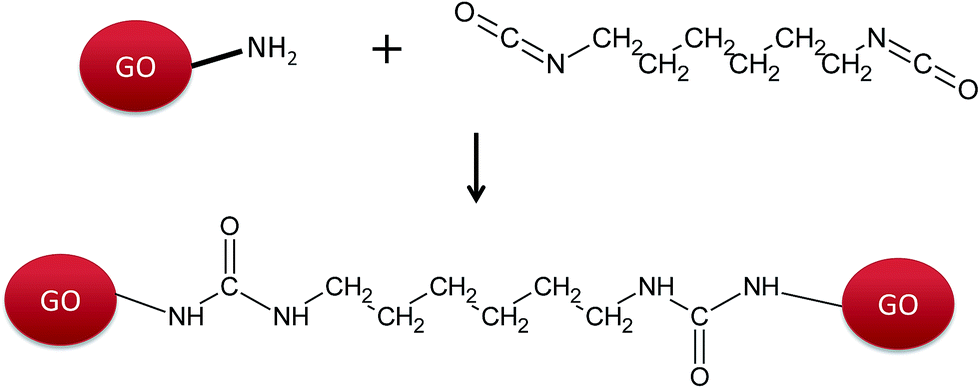 | ||
| Scheme 1 Reaction scheme of GO-NH2 and HDI. | ||
The progress of the reaction between the primary amino groups of GO-NH2 and the isocyanate groups of HDI was monitored using ATR-FTIR (Fig. 2). The extent of the reaction was observed from the consumption of isocyanate groups at 2265 cm−1 (Fig. 2A). The peaks at 3325 cm−1, 1616 cm−1 and 1568 cm−1 are assigned to N–H stretching, amide I (CO) and amide II (a combination peak of N–H bending and C–N stretching vibrations), respectively,37–41 indicating the formation of a urea linkage according to Scheme 1.
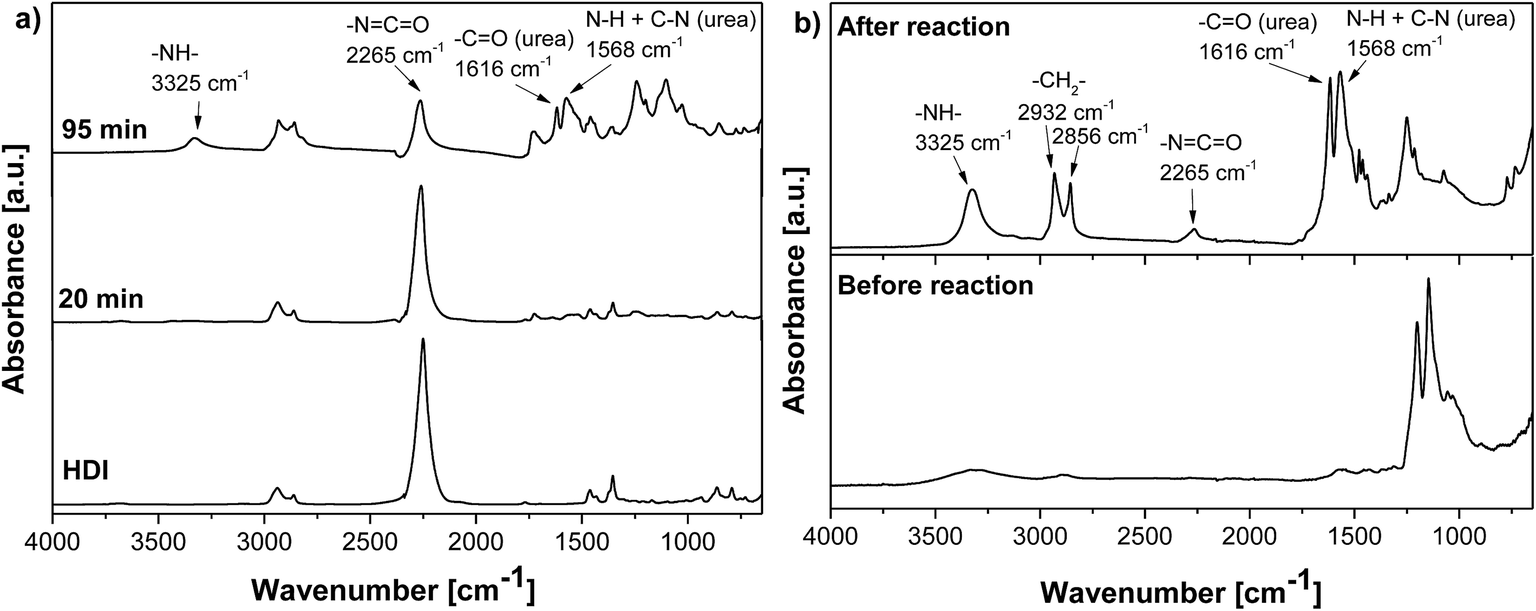 | ||
| Fig. 2 (A) ATR-FTIR spectra of pure HDI and reaction mixtures after 20 and 95 min of reaction between GO-NH2 and HDI in n-butyl acetate. (B) ATR-FTIR spectra of dried and washed GO-NH2 before and after reaction with HDI. | ||
Fig. 2B displays the FTIR spectra of the dried and washed GO-NH2 material before and after reaction with HDI. The urea absorption peaks (at 3325 cm−1, 1616 cm−1 and 1568 cm−1) as well as the peaks at 2856 and 2932 cm−1, corresponding to the symmetric and asymmetric CH2 groups of HDI, are present in the ATR-FTIR spectrum of GO-NH2 after reaction with HDI, which proved the covalent bonding of HDI and the formation of disubstituted urea. The presence of an unreacted NCO band (2265 cm−1) indicates that not all NH2 groups were accessible for reaction with HDI due to steric hindrance.
Contrary to that, the FTIR spectrum of a GO and HDI mixture displayed no significant decrease in the NCO peak (2265 cm−1) with increasing reaction time, indicating that the reaction between GO and HDI practically did not proceed (Fig. 3).
 | ||
| Fig. 3 ATR-FTIR spectra of pure HDI and the reaction mixtures after 20 and 125 min of reaction between GO and HDI in n-butyl acetate. | ||
The ATR-FTIR findings were corroborated with the complementary XPS data (Fig. 4 and Table 2). The binding of HDI molecules to GO-NH2 leads to a significant rise in the sp3 carbon contribution and a concomitant rise in the C–N moieties at 286.0 ± 0.1 eV to 18.8 at%. The presence of urea NH–(O)–NH moieties, as a product of the covalent bonding of HDI molecules to GO-NH2, leads to an increase in the originally observed ester and carboxy (O)–O moieties at 288.8 ± 0.1 eV. The presence of HDI molecules is further supported by the increase in the N 1s signal at 399.8 ± 0.1 eV, originating from the formed urea and unreacted isocyanate groups. Similar trends were observed in the C 1s and N 1s spectra of the GO material reacted with HDI. However, the concentration of the formed carbamate NH–(O)–O groups (289.0 ± 0.1 eV), as a result of the reaction between the isocyanate groups of HDI and the hydroxyls of GO carbamate, is lower. The lower reactivity of GO is further corroborated by the N 1 s spectra and the presence of up to 7.6 at% NH–(O) moieties of carbamate and unreacted isocyanate groups.
 | ||
| Fig. 4 High-resolution C 1s, N 1s and O 1s XPS spectra of (A) GO-NH2 and (B) GO reacted with HDI. The measured spectra are presented with black lines, while their corresponding fitted envelopes are presented in red. The individual contributions of different functional groups present in the GO materials are represented with blue lines. | ||
| Moiety | Binding energy [eV] | GO-NH2 + HDI [at%] | GO + HDI [at%] | |
|---|---|---|---|---|
| a Value was below the detection limit of XPS analysis. | ||||
| C 1s | C |
284.2 ± 0.1 | 4.8 ± 1.6 | —a |
| –C |
285.0 | 33.7 ± 1.3 | 34.0 ± 1.0 | |
| –OH, –NH2 |
286.0 ± 0.1 | 18.8 ± 2.2 | 9.1 ± 0.3 | |
| –O–C |
286.8 ± 0.3 | 3.3 ± 0.6 | 12.5 ± 1.3 | |
| O |
287.9 ± 0.3 | 0.7 ± 0.6 | 6.7 ± 1.2 | |
| NH–(O)–NH |
288.8 ± 0.1 | 8.7 ± 0.4 | —a | |
| NH–(O)–O |
289.0 ± 0.1 | —a | 5.4 ± 0.7 | |
| N 1s | NH–(O)– |
399.8 ± 0.1 | 18.5 ± 0.5 | 7.6 ± 0.3 |
| C–H3+ |
401.4 ± 0.1 | —a | 1.8 ± 0.2 | |
| O 1s | C |
531.2 ± 0.3 | 8.2 ± 0.3 | 7.6 ± 1.1 |
| –C |
532.5 ± 0.2 | 3.2 ± 0.6 | 15.4 ± 1.0 | |
3.3. Adsorption isotherm data
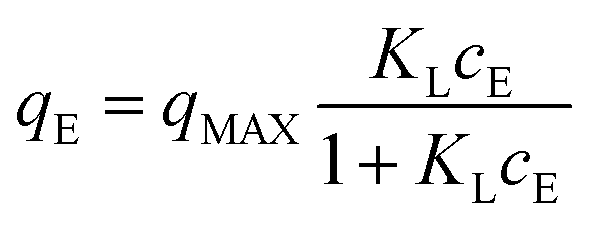
Adsorption isotherms describe the relationship between the adsorbate and adsorbent when the adsorption process reaches an equilibrium state. Langmuir, Freundlich and Langmuir–Freundlich isotherms are widely used for describing the relationship between the adsorbed dye concentration and the concentration of the solution at equilibrium.42,43 These three adsorption models were also chosen to evaluate our experimental data for AO7 adsorption to the GO-NH2 and GO materials in aqueous solution (25 ± 1 °C).The Langmuir adsorption isotherm assumes monolayer adsorption on a homogenous surface. The adsorption process occurs on a surface with a finite number of definite localized sites, which are identical and equivalent.44,45 The Langmuir adsorption isotherm in the non-linear form can be expressed by the following equation:
 | (2) |
The Freundlich adsorption isotherm is commonly used for describing non-ideal and reversible adsorption at heterogeneous surfaces. This isotherm is not limited to monolayer formation and is now commonly used for describing adsorption processes of organic compounds on carbon (especially active carbon) materials or molecular sieves.44,46 The Freundlich adsorption isotherm in the non-linear form can be expressed by the following equation:
| qE = KFcE1/nF | (3) |
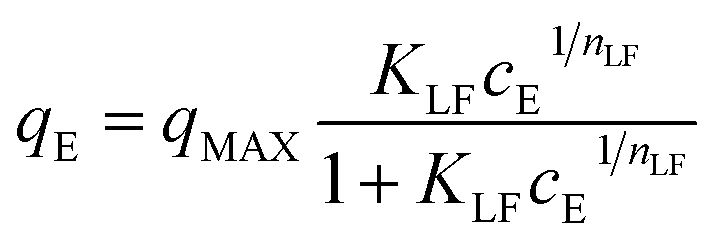
The Langmuir–Freundlich isotherm (L–F) is a useful and versatile isotherm, which combines the advantages and behaviours of the Langmuir and Freundlich isotherms.47 Advantageously, at low adsorbate concentration, L–F is reduced to the Freundlich isotherm. By contrast, at high concentrations, L–F behaves as a Langmuir isotherm with monolayer adsorption capacity.44 The L–F equation can be expressed in the following form:
 | (4) |
Amount of free AO7 after the adsorption experiment was evaluated using the equation obtained from the linear regression of the calibration plot, y = 18062x + 0.0368, which shows a good correlation coefficient (R2 = 0.9989) and RSD < 3% (see Fig. S3 and S4†). Isotherms were measured in the concentration range of 6.5 × 10⁻⁵ mol L−1 to 2.5 × 10⁻⁴ mol L−1. The maximum adsorption amount (qMAX), correlation coefficient (R2), and other parameters of all isotherms are presented in Table 3, and the isotherms are shown in Fig. 5.
| Sample | Freundlich | Langmuir | Langmuir–Freundlich | |||||||
|---|---|---|---|---|---|---|---|---|---|---|
| KF (L g−1) | nF (—) | R2 (—) | KL (L mmol−1) | qMAX (mmol g−1) | R2 (—) | KLFa (L mmol−1) | qMAX (mmol g−1) | nLF (—) | R2 (—) | |
| a Fixed parameters. | ||||||||||
| GO-1 | 1.428 | 6.714 | 0.9532 | 810.9 | 0.940 | 0.8799 | 2 | 1.849 | 3.937 | 0.9392 |
| GO-2 | 1.118 | 9.873 | 0.9905 | 850.9 | 0.845 | 0.6995 | 0.5 | 3.281 | 7.585 | 0.9858 |
| GO-3 | 0.035 | 3.313 | 0.6906 | 26.0 | 0.025 | 0.6483 | 0.5 | 0.105 | 2.770 | 0.5038 |
| GO-4 | 0.095 | 15.43 | 0.4339 | 240.1 | 0.085 | 0.3297 | 0.5 | 0.283 | 11.095 | 0.3373 |
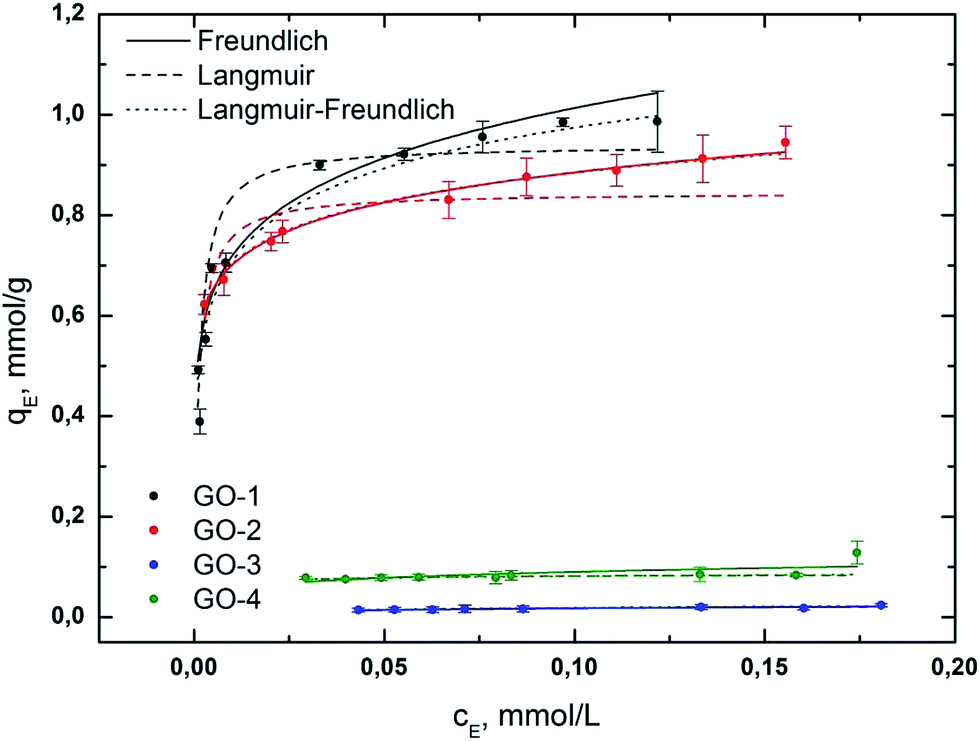 | ||
| Fig. 5 Fits of the Freundlich (solid line), Langmuir (dashed line) and Langmuir–Freundlich (dotted line) isotherms for the adsorption of AO7 on GO samples (GO-1 to GO-4). | ||
According to our experimental data, the adsorption process of AO7 can be described very well by the Freundlich and Langmuir–Freundlich models under the concentration range studied. Very good fit to the Freundlich model for the AO7 dye (GO-1 and GO-2) suggests that the surface is heterogeneous. Adsorption is limited with multilayer coverage and interaction between the adsorbed molecules. The heterogeneity parameter nF is used to indicate whether the adsorption is a chemical process (nF < 1), a physical process (nF > 1) or linear (nF = 1). A value of 1/nF < 1 or 1/nF > 1 indicates normal adsorption; otherwise, it is indicative of cooperative adsorption. The measured values of nF > 1 and 1/nF < 1 indicate that the physical process and Langmuir isotherm model are favourable for all samples.
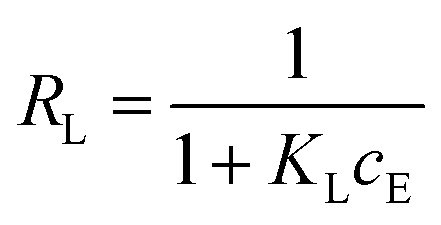
On the other hand, in the case of the Langmuir isotherm model, there is a very important parameter, RL (separation factor). The separation factor (RL), calculated using eqn (5) (results are not presented), can be used to verify whether the adsorption of the studied systems is favourable (0 < RL < 1), irreversible (RL = 0), linear (RL = 1) or unfavourable (RL > 1).
 | (5) |
The values of RL < 1 under our conditions (concentration range of 2.5 × 10⁻⁴ to 4.5 × 10⁻⁵ mol L−1) indicate favourable adsorption in the AO7-GO-NH2 system.
The Langmuir constant KL relates to the affinity of the binding sites for the adsorbate.49 It can be said that the affinity of the AO7 dye decreases in the order of GO-2 > GO-1 > GO-4 > GO-3.
The heterogeneity parameter, obtained from the L–F model, confirmed our observation that the adsorption process of the dye corresponded to the Freundlich model. However, the samples GO-3 and GO-4 did not follow any of the used isotherms.
The negligible adsorption of GO-3 and GO-4 is caused by the limited presence of non-protonated functional groups or the intercalation of AO7 into the GO structure. It can be said that all tested GO-NH2 samples (GO-1 and GO-2) are perspective sorbents with relatively high sorption capacities of anionic dyes under our studied conditions. We suppose that the higher sorption capacity of GO-NH2 is probably caused by the presence of accessible protonated amino groups (probably in the form of –NH3+), which easily interact with –SO3− in the AO7 dye. We found that the non-ammonia-functionalized samples GO-3 and GO-4 are not very effective sorbents for anionic dyes, which is not in compliance with certain results in the available literature.45,50
The total amount of accessible amino groups in the GO and GO-NH2 samples obtained by the sorption of AO7 are presented in Table 4.
| Sample | qNH2 (mmol g−1) | RSD (%) |
|---|---|---|
| GO-1 | 0.85 | 0.59 |
| GO-2 | 0.83 | 2.58 |
| GO-3 | 0.02 | 1.63 |
| GO-4 | 0.09 | 4.08 |
The contents of the amino groups estimated from the AO7 adsorption are significantly lower the content of nitrogen determined by EA, which can be explained by the presence of another type of N-containing functional groups (non-accessible). We supposed that by using the AO7 adsorption method, we were able to determine only the amount of accessible amino groups (functional speciation), which correlated well with the stoichiometry of the GO-NH2-HDI reaction mentioned above. The results in Table 4 show that there was a significant amount of amino groups present in the GO-NH2 samples, while the non-functionalized GO samples (GO-3 and GO-4) contained practically zero accessible amino groups. The calculated values for the GO-3 and GO-4 samples can be probably ascribed to the weak interaction of AO7 with GO surface functionalities or the intercalation of AO7 into the structure of GO but not to the accessible amino groups.
3.4. Characterization of samples before and after sorption of AO7
Changes in the samples before and after sorption of AO7 dye were observed by FTIR (Fig. 6 and 7) and TEM (Fig. 8). The FTIR spectrum of pristine AO7 (shown in Fig. 6 and 7) contained the most important bands located in the region of 2000–1000 cm−1. The band at 1512 cm−1 was assigned to –N–H bond vibrations,51–53 and according to Zhang et al., the band at 1447 cm−1 corresponded to the azo bond vibration.53,54 The band at 1625 cm−1 was a combination of phenyl ring vibrations and CN stretching group.53 The bands in region 1600–1450 cm−1 were linked to characteristic aromatic CC vibrations.51,53,54 The bands located in the region of 1250–1000 cm−1 were assigned to the S–O stretching52,54 and aromatic C–H bending vibrations.54 The peaks at 1036 and 1127 cm−1 corresponded to the coupling between the benzene mode and νs(SO3).53 The FTIR spectra of GO before and after (dashed line) sorption of AO7 are shown in Fig. 6. The typical vibrations of GO at 3424, 1738, 1625, 1403, 1240 and 1080 cm−1 were observed for O–H stretching, CO stretching, CC stretching, O–H deformation, C–O epoxy stretching, and C–O alkoxy stretching bands.55 The FTIR spectra of GO-NH2 before and after (dashed line) sorption of AO7 are shown in Fig. 7. The amination causes the attenuation of 3424, 1738, 1240 and 1080 cm−1 vibrations. The typical bands of primary amines, N–H and C–N stretching vibrations, were observed at 1570, 844 and 1207 cm−1.10,49 It should be noted that the bands were expanded and shifted by approximately 10 cm−1 for the out-of-plane N–H bending vibrations from 841 to 834 cm−1.
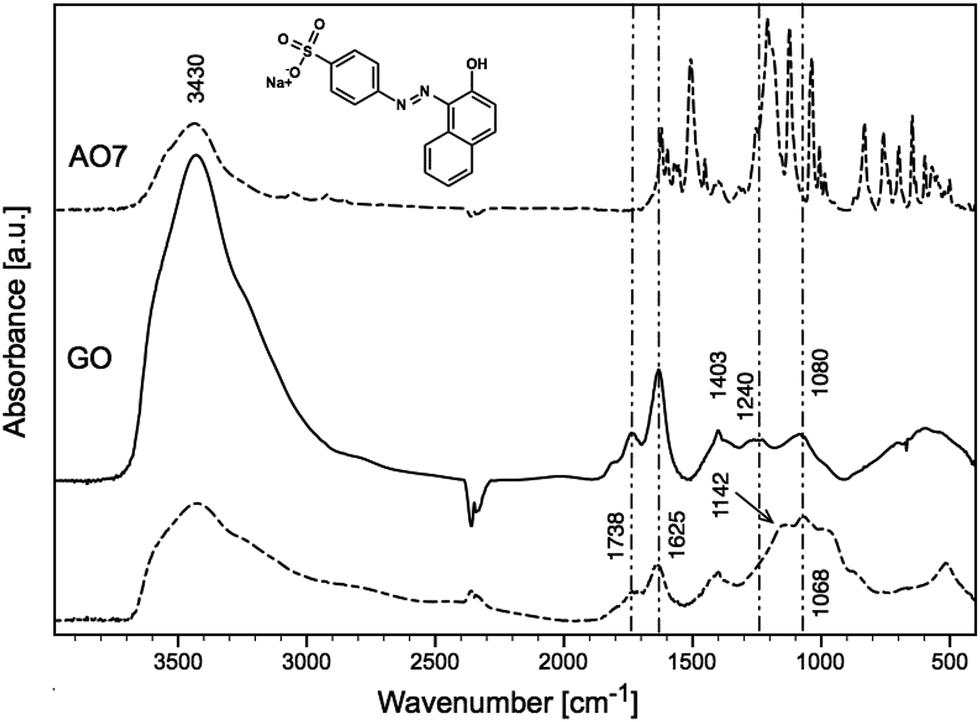 | ||
| Fig. 6 FTIR spectra of GO-3 before (solid line) and after (dashed line) AO7 sorption. | ||
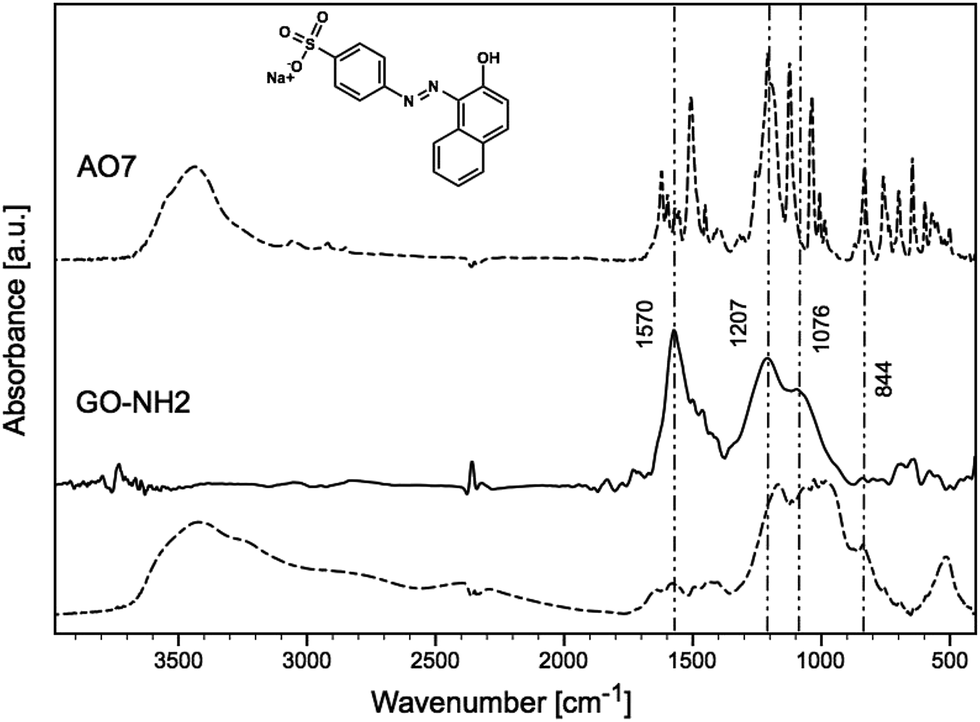 | ||
| Fig. 7 FTIR spectra of GO-1 before (solid line) and after (dashed line) AO7 sorption. | ||
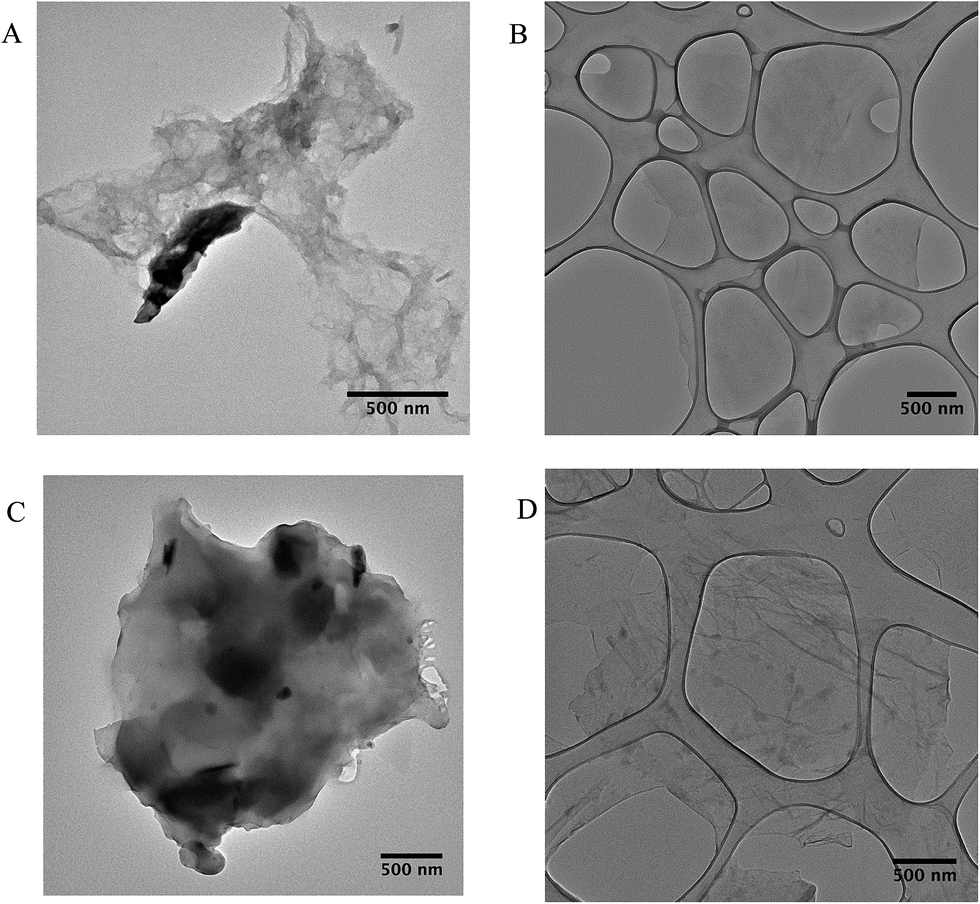 | ||
| Fig. 8 TEM images of GO-1 before (A) and after (C) sorption, GO-3 before (B) and after (D) sorption. | ||
The band at 1600 cm−1 (Fig. 7) can be assigned to the N–H stretching of amine groups,10,12,17 and after the adsorption of AO7, this band disappeared. This can be explained by the interaction of the dye with the amine groups, as seen in Fig. 7, where the bands appearing in the region 1250–1000 cm−1 corresponded to S–O stretching (from –SO2 of the dye).52,54 The band at 1190 cm−1, which appeared after the adsorption of AO7, can also be assigned to the sulfonate group vibration,56 and band at 1443 cm−1 probably to NN stretching.53 The same results were observed for the second sample. From the results discussed above, we assume that the AO7 dye reacted specifically with the amino groups of GO-NH2.
The TEM images (Fig. 8) display the different morphologies of the GO and GO-NH2 samples before and after AO7 sorption. No significant morphological differences were found in the GO-3 sample (Fig. 8B and D) before and after AO7 sorption, showing the minimal sorption affinity to the AO7 dye. Contrary to that, the amino-functionalized sample GO-1 (Fig. 8A and C) showed morphological changes caused by the sorption of AO7 dye and subsequent agglomeration. This observation confirmed our assumption that AO7 dye interacts specifically with the GO-NH2 surface under the selected experimental conditions.
4. Conclusions
It follows from the investigations of the GO-NH2 reactions with isocyanate monomer that the NH2 groups on the GO surface play a key role in the preparation the polyurethane nanocomposites. We developed a simple and fast method to determine the amount of amino groups accessible for the reaction with isocyanate monomer. Together with XPS, these methods provide valuable and complementary information about the GO-NH2 reactivity and allow to evaluate the potential applicability of GO-NH2 as a functional polymer filler. The quantification of accessible primary amino groups was done using the spectrophotometric method based on the interaction of positively charged groups with the anionic dye AO7. All amino-functionalized samples exhibited higher affinity to AO7 dye, contrary to GO samples without NH2 groups. It was found that ammonia-functionalized GO samples are perspective sorbents for anionic dyes under the selected conditions, contrary to non-functionalized GO samples, according our results. The presence of amino groups on the GO-NH2 surface was also confirmed by FTIR and XPS, and the presence of nitrogen was determined by EA.The accessibility of amino groups of GO-NH2 was successfully verified by reaction with HDI, demonstrating the perspective application of GO-NH2 as a functional filler for polymer composites.
Acknowledgements
This work was supported by the Grant Agency of the Czech Republic, grant no. 14-05146S. OPG acknowledges support from the European Regional Development Fund OPPK (CZ.2.16/3.1.00/21545).References
- M. S. Nevius, M. Conrad, F. Wang, A. Celis, M. N. Nair, A. Taleb-Ibrahimi, A. Tejeda and E. H. Conrad, Phys. Rev. Lett., 2015, 115, 136802 CrossRef CAS PubMed.
- K. S. Novoselov, Z. Jiang, Y. Zhang, S. V. Morozov, H. L. Stormer, U. Zeitler, J. C. Maan, G. S. Boebinger, P. Kim and A. K. Geim, Science, 2007, 315, 1379 CrossRef CAS PubMed.
- E. C. Marino, L. O. Nascimento, V. S. Alves and C. M. Smith, Phys. Rev. X, 2015, 5, 11040 Search PubMed.
- D. A. C. Brownson, L. J. Munro, D. K. Kampouris and C. E. Banks, RSC Adv., 2011, 1, 978 RSC.
- W. S. Hummers and R. E. Offeman, J. Am. Chem. Soc., 1958, 80, 1339 CrossRef CAS.
- X. Wang, W. Wang, Y. Liu, M. Ren, H. Xiao and X. Liu, Anal. Chem., 2016, 88, 3926–3934 CrossRef CAS PubMed.
- M. Inagaki and F. Kang, J. Mater. Chem. A, 2014, 2, 13193 CAS.
- N. Oger, Y. F. Lin, C. Labrugère, E. Le Grognec, F. Rataboul and F. X. Felpin, Carbon, 2016, 96, 342–350 CrossRef CAS.
- S. Sandoval, N. Kumar, J. Oro-Solé, A. Sundaresan, C. N. R. Rao, A. Fuertes and G. Tobias, Carbon, 2015, 96, 594–602 CrossRef.
- L. Lai, L. Chen, D. Zhan, L. Sun, J. Liu, S. H. Lim, C. K. Poh, Z. Shen and J. Lin, Carbon, 2011, 49, 3250–3257 CrossRef CAS.
- Y. Shao, J. Sui, G. Yin and Y. Gao, Appl. Catal., B, 2008, 79, 89–99 CrossRef CAS.
- T. Ramanathan, F. T. Fisher, R. S. Ruoff and L. C. Brinson, Chem. Mater., 2005, 17, 1290–1295 CrossRef CAS.
- M. Fan, C. Zhu, Z.-Q. Feng, J. Yang, L. Liu and D. Sun, Nanoscale, 2014, 4882–4888 RSC.
- T. Van Khai, H. G. Na, D. S. Kwak, Y. J. Kwon, H. Ham, K. B. Shim and H. W. Kim, Carbon, 2012, 50, 3799–3806 CrossRef CAS.
- W. Zhang, J. Ma, D. Gao, Y. Zhou, C. Li, J. Zha and J. Zhang, Prog. Org. Coat., 2016, 94, 9–17 CrossRef CAS.
- H. Zhang, T. Kuila, N. H. Kim, D. S. Yu and J. H. Lee, Carbon, 2014, 69, 66–78 CrossRef CAS.
- J. Shen, W. Huang, L. Wu, Y. Hu and M. Ye, Mater. Sci. Eng. A, 2007, 464, 151–156 CrossRef.
- A. Navaee and A. Salimi, RSC Adv., 2015, 5, 59874–59880 RSC.
- E. Blanco, G. Blanco, J. M. Gonzalez-Leal, M. C. Barrera, M. Domínguez and M. Ramirez-del-Solar, J. Nanopart. Res., 2015, 17, 214 CrossRef.
- M. Prato, K. Kostarelos and A. Bianco, Acc. Chem. Res., 2008, 41, 60–68 CrossRef CAS PubMed.
- L. Fras Zemljic, S. Strnad, O. Sauperl and K. Stana-Kleinschek, Text. Res. J., 2009, 79, 219–226 CrossRef.
- V. Mittal, Macromol. Mater. Eng., 2014, 299, 906–931 CrossRef CAS.
- D. Galpaya, Graphene, 2012, 1, 30–49 CrossRef CAS.
- F. Perreault, A. Fonseca de Faria and M. Elimelech, Chem. Soc. Rev., 2015, 44, 5861–5896 RSC.
- D. Cai, J. Jin, K. Yusoh, R. Rafiq and M. Song, Compos. Sci. Technol., 2012, 72, 702–707 CrossRef CAS.
- X. Luo, P. Zhang, J. Ren, R. Liu, J. Feng and B. Ge, J. Appl. Polym. Sci., 2015, 132, UNSP 42005 Search PubMed.
- S. Wu, T. Shi and L. Zhang, High Perform. Polym., 2016, 28, 453–465 CrossRef CAS.
- D. K. Patel, R. K. Singh, S. K. Singh, V. K. Aswal, D. Rana, B. Ray and P. Maiti, RSC Adv., 2016, 6, 58628–58640 RSC.
- G. Gabriel, G. Sauthier, J. Fraxedas, M. Moreno-Mañas, M. T. Martínez, C. Miravitlles and J. Casabó, Carbon, 2006, 44, 1891–1897 CrossRef CAS.
- C. Samorì, R. Sainz, C. Ménard-Moyon, F. M. Toma, E. Venturelli, P. Singh, M. Ballestri, M. Prato and A. Bianco, Carbon, 2010, 48, 2447–2454 CrossRef.
- S. L. Goertzen, K. D. Thériault, A. M. Oickle, A. C. Tarasuk and H. a. Andreas, Carbon, 2010, 48, 1252–1261 CrossRef CAS.
- G. Coussot, C. Perrin, T. Moreau, M. Dobrijevic, A. Postollec and O. Vandenabeele-Trambouze, Anal. Bioanal. Chem., 2011, 399, 1061–1069 CrossRef CAS PubMed.
- T. T. Ngo, J. Biochem. Biophys. Methods, 1986, 12, 349–354 CrossRef CAS PubMed.
- N. Rao, S. Agarwal, V. Chauhan, D. Bhatia, a. Sharma, P. Kumar, B. Garg and K. Gupta, Anal. Chim. Acta, 2000, 247–254 CrossRef CAS.
- V. Štengl, Chem.–Eur. J., 2012, 18, 14047–14054 CrossRef PubMed.
- V. Stengl, S. Bakardjieva, T. M. Grygar, J. Bludská and M. Kormunda, Chem. Cent. J., 2013, 7, 41 CrossRef PubMed.
- J. Shang, S. Liu, X. Ma, L. Lu and Y. Deng, Green Chem., 2012, 14, 2899 RSC.
- L. May-Hernández, F. Hernández-Sánchez, J. L. Gomez-Ribelles and R. Sabater-i Serra, J. Appl. Polym. Sci., 2011, 119, 2093–2104 CrossRef.
- T. Jiang, X. Ma, Y. Zhou, S. Liang, J. Zhang and B. Han, Green Chem., 2008, 10, 465 RSC.
- M. M. Coleman, M. Sobkowiak, G. J. Pehlert, P. C. Painter and T. Iqbal, Macromol. Chem. Phys., 1997, 198, 117–136 CrossRef CAS.
- J. Mattia and P. Painter, Macromolecules, 2007, 40, 1546–1554 CrossRef CAS.
- V. K. Konaganti, R. Kota, S. Patil and G. Madras, Chem. Eng. J., 2010, 158, 393–401 CrossRef CAS.
- Y. A. Aydın and N. D. Aksoy, Chem. Eng. J., 2009, 151, 188–194 CrossRef.
- K. Y. Foo and B. H. Hameed, Chem. Eng. J., 2010, 156, 2–10 CrossRef CAS.
- G. K. Ramesha, A. Vijaya Kumara, H. B. Muralidhara and S. Sampath, J. Colloid Interface Sci., 2011, 361, 270–277 CrossRef CAS PubMed.
- A. Dada, A. Olalekan, A. Olatunya and O. Dada, IOSR J. Appl. Chem., 2012, 3, 38–45 CrossRef.
- G. P. Jeppu and T. P. Clement, J. Contam. Hydrol., 2012, 129–130, 46–53 CrossRef CAS PubMed.
- O. Hamdaoui and E. Naffrechoux, J. Hazard. Mater., 2007, 147, 381–394 CrossRef CAS PubMed.
- F. Fang, L. Kong, J. Huang, S. Wu, K. Zhang, X. Wang, B. Sun, Z. Jin, J. Wang, X. J. Huang and J. Liu, J. Hazard. Mater., 2014, 270, 1–10 CrossRef CAS PubMed.
- D. Robati, B. Mirza, M. Rajabi, O. Moradi, I. Tyagi, S. Agarwal and V. K. Gupta, Chem. Eng. J., 2016, 284, 687–697 CrossRef CAS.
- M. Stylidi, D. I. Kondarides and X. E. Verykios, Appl. Catal., B, 2003, 40, 271–286 CrossRef CAS.
- M. Stylidi, D. I. Kondarides and X. E. Verykios, Appl. Catal., B, 2004, 47, 189–201 CrossRef CAS.
- G. Zhang, J. Qu, H. Liu, A. T. Cooper and R. Wu, Chemosphere, 2007, 68, 1058–1066 CrossRef CAS PubMed.
- S.-J. Zhang, H.-Q. Yu and Q.-R. Li, Chemosphere, 2005, 61, 1003–1011 CrossRef CAS PubMed.
- S. Bose, T. Kuila, A. K. Mishra, N. H. Kim and J. H. Lee, J. Mater. Chem., 2012, 22, 9696 RSC.
- L. Y. Liu, M. Pu, L. Yang, D. Q. Li, D. G. Evans and J. He, Mater. Chem. Phys., 2007, 106, 422–427 CrossRef CAS.
Footnote |
| † Electronic supplementary information (ESI) available. See DOI: 10.1039/c6ra28745j |
| This journal is © The Royal Society of Chemistry 2017 |