 Open Access Article
A promising vanadium sulfide counter electrode for efficient dye-sensitized solar cells
Xianqing Liu,
Gentian Yue * and
Haiwu Zheng*
Henan Key Laboratory of Photovoltaic Materials and Laboratory of Low-Dimensional Materials Science, Henan University, Kaifeng 475004, China. E-mail: yuegentian@henu.edu.cn; zhenghaiw@ustc.edu; Tel: +86 371 23880696
First published on 21st February 2017
Abstract
In this study, we demonstrated the synthesis of vanadium sulfide (VS2) via an in situ hydrothermal route, which was subsequently employed as a counter electrode (CE) for Pt-free dye-sensitized solar cells (DSSCs) for the first time. It was demonstrated from scanning electron microscopy that the size of VS2 increased with the increasing temperature, and the morphology was also affected by temperature. Extensive electrochemical performance analysis, including cyclic voltammetry, electrochemical impedance, and Tafel polarization, revealed that the VS2 CE possesses a high electrocatalytic activity for the reduction of triiodide to iodide and a low charge-transfer resistance at the electrolyte/CE interface. The DSSC based on the VS2 CE exhibited a conversion efficiency of 6.24% under an illumination of 100 mW cm−2 as compared to the DSSC based on the Pt CE.
1. Introduction
Dye-sensitized solar cells (DSSCs) have received extensive interest due to their facile fabrication, sustainability, low-cost, and environmentally friendliness.1–4 The typical structure of a DSSC consists of TiO2 nanocrystallines as the photoanode, dyes, and a platinum (Pt)-coated tin oxide transparent (FTO) substrate as the counter electrode (CE) fabricated with an I−/I3− redox couple liquid electrolyte.5 Although Pt is one of the most selected materials for catalyzing the reduction of I3− to I− due to its superior electrocatalytic ability, stability, and conductivity, as a noble metal, its high cost restricts the scale up production for DSSCs. To resolve this issue, many researchers are concentrating on CE catalytic materials, including carbon-based materials, metal sulfides, nitrides, polymers, and oxides,8–10 with a high conductivity, large specific surface areas, and a good catalytic ability.6,7 Among these, metal sulfides with two-dimensional (2D) permeable channels possess the properties of ideal CE materials and are considered as promising electrode materials.11,12 Lin et al.13 prepared a molybdenum disulfide CE for DSSCs and obtained a significant improvement in the power conversion efficiency. Moreover, we also successfully prepared a nickel disulfide CE with very promising results for DSSCs.13,14 Vanadium sulfide (VS2) has been proven to be an ideal material platform due to its synergic properties of metallic nature brought about by the conducting S–V–S layers stacked up via weak van der Waals interlayer interactions, offering great potential as high-performance in-plane supercapacitor electrodes.15 Therefore, it is interesting and significant to investigate the potential applications of VS2 as a CE catalyst in DSSCs for low-cost and efficient photoelectric conversion efficiency.Herein, we designed and synthesized VS2 nanofibres as a CE material via an in situ hydrothermal route for DSSCs, hoping that the VS2 nanofibres could promote the catalytic activity and improve the photovoltaic properties of the DSSC. The DSSC based on the VS2 nanofibre CE exhibited a high power conversion efficiency of 7.40%. This study may broaden the potential applications of two-dimensional layered transition-metal dichalcogenides in the area of photoelectrochemistry.
2. Experimental
2.1 Preparation of VS2 CEs
VS2 was prepared via modifying the procedure reported by Feng et al.15 A 3 mmol sodium orthovanadate and 15 mmol thiourea were dissolved in 40 ml distilled water; the mixture was then stirred for 1 h to form a homogeneous solution and transferred to a 50 ml Teflon-lined autoclave. It was then heated in an oven at 140, 160, 180, and 200 °C for 24 h. The product was collected by centrifugation, washed at least 5 times with ethanol and distilled water, and dried in a vacuum oven at 80 °C for 12 h. The slurry of the VS2 CE was composed of nanofibre structure VS2, acetylene black, and polyvinylidene fluoride (weigh ratio = 8![[thin space (1/6-em)]](https://www.rsc.org/images/entities/char_2009.gif) :
:![[thin space (1/6-em)]](https://www.rsc.org/images/entities/char_2009.gif) 1
1![[thin space (1/6-em)]](https://www.rsc.org/images/entities/char_2009.gif) :
:![[thin space (1/6-em)]](https://www.rsc.org/images/entities/char_2009.gif) 1), which were dissolved in N-methyl-2-pyrrolidinone. Then, the slurry was ultrasonicated for 30 min and was stirred for 12 h. Subsequently, the as-prepared slurry was coated on the FTO substrates using a doctor blade method. The coated CEs were dried at 100 °C for 24 h in a vacuum oven.
1), which were dissolved in N-methyl-2-pyrrolidinone. Then, the slurry was ultrasonicated for 30 min and was stirred for 12 h. Subsequently, the as-prepared slurry was coated on the FTO substrates using a doctor blade method. The coated CEs were dried at 100 °C for 24 h in a vacuum oven.
2.2 Fabrication of the DSSCs
A TiO2 anode was prepared according to a previously reported procedure.16,17 The dye-sensitized TiO2 photoanode was constructed by immersing the TiO2 photoanode in a 0.3 mM dye Z907 ethanol solution for 24 h. Thus, a dye-sensitized TiO2 photoanode with a total thickness of 6–8 μm was obtained. After this, the dye-sensitized TiO2 photoanode and the CE were clipped together and wrapped with the thermoplastic hot-melt Surlyn. The liquid electrolyte contained 0.05 M of iodine, 0.1 M of lithium iodide, 0.6 M of tetrabutylammonium iodide, and 0.5 M of 4-tert-butyl-pyridine in acetonitrile and was injected into the aperture between the two electrodes.2.3 Characterization
The surface morphology of the sample was observed using a JSM-7001F field emission scanning electron microscope (SEM). Energy dispersive spectroscopy analysis (EDS) was carried out using a Bruker-ASX (Model Quan-Tax 200). A field emission transmission electron microscope (TEM; JEOL JEM-2100F, operated at 200 kV with a point-to-point resolution of 0.19 nm) was used to obtain information about the microstructures. The crystalline structures of the composites were investigated by glancing incidence X-ray diffractometer (X'Pert Pro, PANalytical B.V., the Netherlands). Electrochemical impendence spectroscopy (EIS) was carried out using a CHI660E (Shanghai Chenhua Device Company, China) electrochemical measurement system at a constant temperature of 25 °C in an ambient atmosphere under dark conditions, leaving an exposed area of 0.8 cm2. The frequency of the applied sinusoidal AC voltage signal was varied from 0.1 Hz to 105 Hz, and the corresponding amplitude was set at 5 mV in all the cases.The photovoltaic test of the DSSC with an exposed area of 0.2 cm2 was carried out by measuring photocurrent–photovoltage (J–V) character curves under a white light irradiation of 100 mW cm−2 (AM 1.5 G) from a solar simulator (CEL-S500, Beijing China Education Au-light Co., Ltd) in an ambient atmosphere.
3. Results and discussion
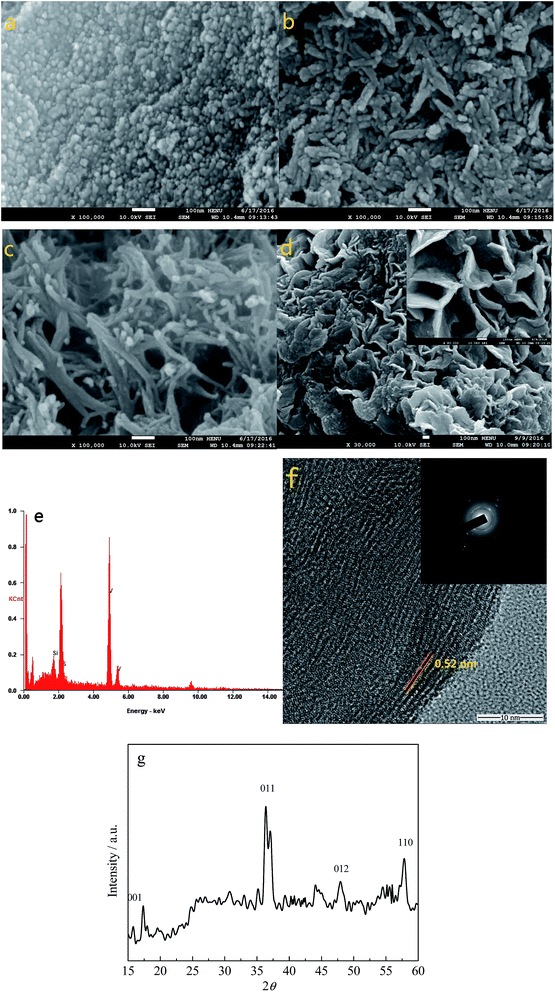
Fig. 1a–d show the SEM images of VS2 obtained at 140, 160, 180, and 200 °C, respectively. It can be seen that the size of the VS2 nanoparticles increased with the increasing temperature and the morphology also changed, from nanoparticles to nanofibers and nanosheets. This phenomenon indicates that a higher reaction temperature can promote the growth of VS2 crystals. The EDS patterns of VS2 prepared at 180 °C are shown in Fig. 1e, in which the V and S elements with an almost 1![[thin space (1/6-em)]](https://www.rsc.org/images/entities/char_2009.gif) :
:![[thin space (1/6-em)]](https://www.rsc.org/images/entities/char_2009.gif) 1 ratio can be detected, and the Si element originates from the Si substrate. Fig. 1f presents the TEM image of VS2, and the lattice spacing has been estimated to be 0.52 nm, which is in accordance with the literature parameter for VS2 (0.573 nm). To further identify the composition of the sample, Fig. 1g shows the XRD pattern of the VS2 nanofibers obtained from the 180 °C hydrothermal synthesis. As can be seen, although there are some impurity peaks appearing in the sample, the (001), (011), (012), and (110) peaks of the VS2 all correspond to the JCPDS database card no. 89-1640. As a consequence, the results demonstrated that the VS2 has been successfully prepared via the facile hydrothermal synthesis at 180 °C.
1 ratio can be detected, and the Si element originates from the Si substrate. Fig. 1f presents the TEM image of VS2, and the lattice spacing has been estimated to be 0.52 nm, which is in accordance with the literature parameter for VS2 (0.573 nm). To further identify the composition of the sample, Fig. 1g shows the XRD pattern of the VS2 nanofibers obtained from the 180 °C hydrothermal synthesis. As can be seen, although there are some impurity peaks appearing in the sample, the (001), (011), (012), and (110) peaks of the VS2 all correspond to the JCPDS database card no. 89-1640. As a consequence, the results demonstrated that the VS2 has been successfully prepared via the facile hydrothermal synthesis at 180 °C.
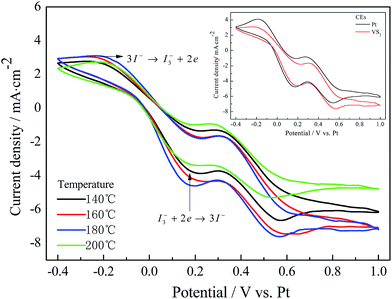
Fig. 2 presents the cyclic voltammograms of various CEs measured using a three-electrode system. In Fig. 2, the pair of peaks in the low potential area has a significant impact on the photovoltaic properties of the DSSCs between the two pairs of redox peaks.18 As observed from the inset of Fig. 2, the Pt and VS2 (180 °C preparation) CEs have a similar cathodic peak current density (Jpc) and cathodic peak potential, indicating that the VS2 CE is as good conductive and catalytic material as Pt. The VS2 CEs prepared at temperatures from 140 to 200 °C possess a similar cathodic peak potential, and the cathodic peak current density follows the order VS2 (180 °C) > VS2 (160 °C) > VS2 (140 °C) > VS2 (200 °C) CEs, suggesting that the VS2 CE prepared at 180 °C has a better catalytic activity and conductivity. This indicates that the electron transport was affected by the surface morphologies of the samples. VS2 nanofibers with a large specific surface area can vastly enhance the accessibility of the electrolyte to the electrode, thus improving interfacial charge transfer and increasing the number of active catalytic sites.19,20
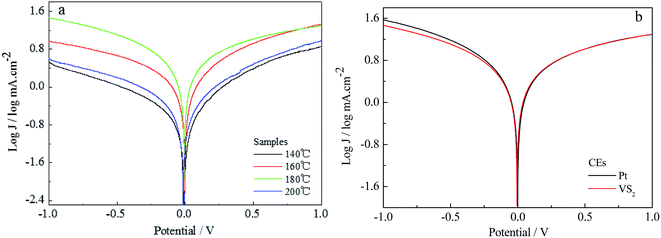
Tafel curves for the VS2 CEs prepared at different temperature are shown in Fig. 3a. The exchange current density (J0), obtained as the intercept of the extrapolated linear region of the curve when the overpotential was zero, is positively correlated to the reduction capability of the CE materials in an I−/I3− electrolyte. The VS2 CEs prepared at temperatures from 140 to 200 °C exhibit the same change tendencies as for the CVs. Under the optimizing conditions, the J0 of the VS2 CE (180 °C preparation) is similar to that of the Pt CE, as shown in Fig. 3b. This is mainly because VS2 (180 °C preparation) with nanofibre structure is better for electron transport than VS2 nanoparticles. Thus, this also indicates that the electrochemical catalytic activity of the VS2 CE is significantly affected by the morphology.
Fig. 4 displays the electrochemical impedance spectroscopy (EIS) and equivalent circuit models of the Pt and the VS2 CEs synthesized at various temperatures, in which the first semicircle in the high frequency region denotes the charge-transfer resistance (Rct) at the CE/electrolyte interface21,22 and the corresponding EIS parameters are listed in Table 1. The smaller Rct exhibits a faster electron transfer from the CE to the electrolyte, which is a significant parameter for evaluating the performance of CEs. In Fig. 4, the values of Rct for the VS2 CEs synthesized at 140, 160, 180 and 200 °C are 6.437, 4.318, 3.360, and 8.435 Ω cm2, respectively; and the Rct for the Pt CE is 3.432 Ω cm2. The Rct value for the VS2 CE prepared at 180 °C is comparable to that of the Pt CE. The results are in agreement with the CVs and Tafel curves, and this can be attributed to the same reasons as for the CVs and Tafel curves.
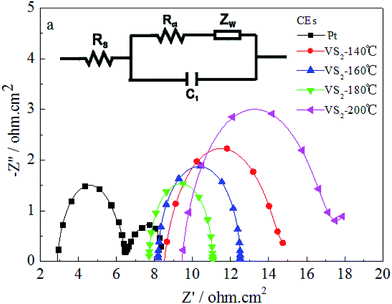 | ||
| Fig. 4 EIS spectra for the Pt and VS2 CEs. The inset (a) shows the equivalent circuit model used for fitting the resultant impedance spectra. | ||
| Temp. (°C) | Rct (Ω cm2) | |Jpc| (mA cm−2) | Voc (V) | Jsc (mA cm−2) | FF | η (%) |
|---|---|---|---|---|---|---|
| 140 | 6.437 | 3.79 | 0.671 | 11.52 | 0.58 | 4.48 |
| 160 | 4.318 | 4.20 | 0.681 | 13.06 | 0.60 | 5.34 |
| 180 | 3.360 | 4.55 | 0.726 | 13.65 | 0.63 | 6.24 |
| 200 | 8.435 | 3.33 | 0.672 | 10.89 | 0.46 | 3.37 |
| Pt | 3.432 | 4.65 | 0.717 | 14.03 | 0.64 | 6.44 |
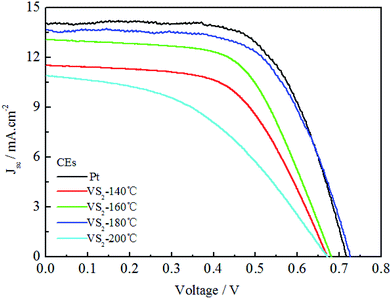
Fig. 5 shows the photocurrent density–voltage curves for the DSSCs based on the Pt and VS2 (180 °C preparation) CEs under the irradiation of 100 mW cm−2, and the photovoltaic parameters for the DSSCs are also summarized in Table 1. From Fig. 5, it can be observed that the DSSC based on the VS2 CE synthesized at 180 °C achieved a power conversion efficiency (PCE) of 6.24%, an open-circuit voltage (Voc) of 0.726 V, a short-circuit current density (Jsc) of 13.65 mA cm−2, and a fill factor (FF) of 0.63, which are almost the same as those for the DSSC based on the Pt electrode (PCE = 6.44%, Voc = 0.717 V, Jsc = 14.03 mA cm−2, and FF = 0.64). The DSSCs based on the VS2 CEs prepared at 140, 160 and 200 °C have much lower PCEs than the DSSC with the VS2 CE synthesized at 180 °C. The positive effect in the performance of the DSSC based on the VS2 (180 °C) CE possibly results from the following aspects. First, the contact frequency between the I−/I3− redox couple in the electrolyte and the CE can be quickened because of the large specific surface area of the VS2 nanofibers, such that to provide a good reaction speed for the reduction of I3− to I−. In addition, the VS2 nanofibers have synergic advantages of a high conductivity and 2D permeable channels guarantee the rapid transmission of electrons, thereby showing efficient PCEs for the DSSCs based on the VS2 CE. In addition, it has been reported in previous studies that VS2 was successfully assembled for constructing the electrodes of in-plane supercapacitors.23,24 To the best of our knowledge, it is the first time that VS2 has been reported as a CE material for DSSCs.
4. Conclusion
VS2 nanofibers were prepared via in situ hydrothermal techniques and were employed as a CE in the Pt-free DSSCs for the first time. The sizes of VS2 increase and the morphology is also affected with the increasing temperature, whereby nanoparticles were observed to changed into nanofibers and even nanosheets. Extensive electrochemical and photoelectric chemical experiments indicate that the VS2 nanofibers prepared at 180 °C have the synergic advantages of high conductivity, large specific surface area, and 2D permeable channels and provide the most excellent catalytic activity for the reduction of triiodide compared to VS2 prepared at 140, 160, and 200 °C. Under the optimum conditions, the PCE of the DSSC based on the VS2 nanofiber CE (6.24%) is as high as that of the DSSC based on the Pt electrode (6.44%). This study offers a new and effective material substitution to Pt, which will broaden the application field of 2D sulfides.Conflict of interest
The authors declare that they have no competing interests.Acknowledgements
The authors are very grateful for the joint support by the National Natural Science Foundation of China (No. U1504624). This work was also supported by the China Postdoctoral Science Foundation Funded Project (No. 2015M572102).References
- B. O'Regan and M. Grätzel, Nature, 1991, 353, 737–740 CrossRef.
- A. Yella, H. W. Lee, H. N. Tsao, C. Y. Yi, A. K. Chandiran, M. K. Nazeeruddin, E. W. G. Diau, C. Y. Yeh, S. M. Zakeeruddin and M. Grätzel, Science, 2011, 334, 629–634 CrossRef CAS PubMed.
- A. Hagfeldt, G. Boschloo, L. Sun, L. Kloo and H. Pettersson, Chem. Rev., 2010, 110, 6595–6663 CrossRef CAS PubMed.
- S. Mathew, A. Yella, P. Gao, R. Humphry-Baker, B. F. E. Curchod, N. Ashari-Astani, I. Tavernelli, U. Rothlisberger, M. K. Nazeeruddin and M. Grätzel, Nat. Chem., 2014, 6, 242–247 CrossRef CAS PubMed.
- J. H. Wu, Z. Lan, J. M. Lin, M. L. Huang, Y. F. Huang, L. Q. Fan and G. G. Luo, Chem. Rev., 2015, 115, 2136–2173 CrossRef CAS PubMed.
- Y. J. Li, Q. W. Tang, L. M. Yu, X. F. Yan and L. Dong, J. Power Sources, 2016, 305, 217–224 CrossRef CAS.
- G. T. Yue, X. P. Ma, W. F. Zhang, F. M. Li, J. H. Wu and G. Q. Li, Nanoscale Res. Lett., 2015, 10, 1–9 CrossRef CAS PubMed.
- Z. Q. Li, F. Gong, G. Zhou and Z. S. Wang, J. Phys. Chem. C, 2013, 117, 6561–6566 CAS.
- H. C. Sun, D. Qin, S. Q. Huang, X. Z. Guo, D. M. Li, Y. H. Luo and Q. B. Meng, Energy Environ. Sci., 2011, 4, 2630–2637 CAS.
- G. T. Yue, P. Li, F. M. Li and C. Chen, RSC Adv., 2016, 6, 61278–61283 RSC.
- M. Mulazzi, A. Chainani, N. Katayama, R. Eguchi, M. Matsunami, H. Ohashi, Y. Senba, M. Nohara, M. Uchida, H. Takagi and S. Shin, Phys. Rev. B: Condens. Matter Mater. Phys., 2010, 82, 075130 CrossRef.
- K. S. Kim, Y. Zhao, H. Jang, S. Y. Lee, J. M. Kim, K. S. Kim, J. H. Ahn, P. Kim, J. Y. Choi and B. H. Hong, Nature, 2009, 457, 706–710 CrossRef CAS PubMed.
- J. Y. Lin, A. L. Su, C. Y. Chang, K. C. Hung and T. W. Lin, ChemElectroChem, 2015, 2, 720–725 CrossRef CAS.
- G. T. Yue, F. R. Tan, F. M. Li, C. Chen, W. F. Zhang, J. H. Wu and Q. H. Li, Electrochim. Acta, 2014, 149, 117–125 CrossRef CAS.
- J. Feng, X. Sun, C. Z. Wu, L. L. Peng, C. W. Lin, S. L. Hu, J. L. Yang and Y. Xie, J. Am. Chem. Soc., 2011, 133, 17832–17838 CrossRef CAS PubMed.
- G. T. Yue, J. H. Wu, Y. M. Xiao, M. L. Huang, J. M. Lin and J.-Y. Lin, J. Mater. Chem. A, 2013, 1, 1495–1501 CAS.
- Z.-Q. Li, Y.-P. Que, L.-E. Mo, W.-C. Chen, Y. Ding, Y.-M. Ma, L. Jiang, L.-H. Hu and S.-Y. Dai, ACS Appl. Mater. Interfaces, 2015, 7, 10928–10934 CAS.
- G. T. Yue, J. H. Wu, J.-Y. Lin, Y. M. Xiao, J. M. Lin, M. L. Huang and Z. Lan, Carbon, 2013, 55, 1–9 CrossRef CAS.
- C.-T. Li, Y.-L. Tsai and K.-C. Ho, ACS Appl. Mater. Interfaces, 2016, 8, 7037–7046 CAS.
- H. Sun, J. Deng, L. Qiu, X. Fang and H. Peng, Energy Environ. Sci., 2015, 8, 1139–1159 CAS.
- Y. Xiao, G. Han, Y. Li, M. Li and Y. Chang, J. Mater. Chem. A, 2014, 2, 3452–3460 CAS.
- G. Yue, J. Wu, Y. Xiao, J. Lin, M. Huang and Z. Lan, J. Phys. Chem. C, 2012, 116, 18057–18063 CAS.
- D. Pech, M. Brunet, H. Durou, P. Huang, V. Mochalin, Y. Gogotsi, P. L. Taberna and P. Simon, Nat. Nanotechnol., 2010, 5, 651–654 CrossRef CAS PubMed.
- J. J. Yoo, K. Balakrishnan, J. Huang, V. Meunier, B. G. Sumpter, A. Srivastava, M. Conway, A. L. Mohana Reddy, J. Yu, R. Vajtai and P. M. Ajayan, Nano Lett., 2011, 11, 1423–1427 CrossRef CAS PubMed.
| This journal is © The Royal Society of Chemistry 2017 |

