 Open Access Article
High performance MWCNT–Pt nanocomposite-based cathode for passive direct methanol fuel cells†
Longjuan Pu,
Liangliang Zou,
Yi Zhou*,
Zhiqing Zou and
Hui Yang *
*
Shanghai Advanced Research Institute, Chinese Academy of Sciences, Shanghai 201210, China. E-mail: yangh@sari.ac.cn; zhouy@sari.ac.cn; Fax: +86-21-20321112
First published on 21st February 2017
Abstract
Reduction of the Pt loading required in cathodes is crucial for the development of passive direct methanol fuel cells (DMFCs). Herein, a novel membrane electrode assembly (MEA) that utilizes a MWCNT–Pt nanocomposite cathodic catalyst layer (CCL) with a 3D network structure is shown to require significantly less Pt loading. With a CCL Pt loading of 0.5 mg cm−2, the maximum power density of the prepared DMFC is 19.2 ± 0.4 mW cm−2 using 2.0 M methanol solution at 25 ± 1 °C, which is higher than that of the power density by a conventional MEA with twice the Pt loading (1.0 mg cm−2). Electrochemical tests show that the structure of the CCL decreases the charge transfer resistance of the cathode reaction and greatly increases the cathode catalyst utilization in comparison with the conventional MEA. The enhanced MEA performance is attributed to the discontinuous distributions of the Pt MWCNT structures and the formation of a cross-twined network within the CCL. This study could provide a promising way to reduce the cost of future commercialized DMFCs.
1. Introduction
Passive direct methanol fuel cells (DMFCs) are promising power sources for portable applications due to their high energy density, small amount of pollutant byproducts, simplicity and convenience.1–6 However, the high noble metal content (i.e. Pt) that is required in membrane electrode assemblies (MEAs) hinders the development of passive DMFCs.7–9 The development of new methods to prepare Pt-based nanocatalysts with high activity is desirable to reduce the need for high noble metal loading.10–14Previous work has been done to reduce the need for high catalyst loadings in passive DMFCs. Some have been to develop low Pt content or Pt-free catalysts that have high activities,10,15–17 to use nanomaterials as the catalyst or catalyst support,17–19 and to use an ordered nanostructured diffusive layer or catalyst layer.20–25 These approaches have effectively reduced the anodic catalyst loading from 4.0 mg(Pt–Ru) cm−2 to 1.0 mg(Pt–Ru) cm−2 for passive DMFCs. However, the techniques to reduce the Pt loading for the cathode of DMFCs are still limited.
In an attempt to modify the morphology and architecture of Pt-based catalysts for increasing catalyst utilization and eventually reducing the catalyst loading, various Pt nanocrystals and Pt-based nanostructures have been reported, such as 0D Pt nanoparticles,26–29 1D Pt nanostructures (nanowires,30,31 nanorods,32–34 nanotubes12,19,35–38), 2D Pt nanoscale membranes,39 and 3D Pt nano-assemblies.40 Pt-based carbon nanotubes (CNT) composites for fuel cells have been of great interest due to the unique electronic, thermal, and mechanical properties of CNTs.41–51 For examples, Fang et al. have used functionalized MWCNTs to fabricate MWCNT-supported, high Pt loading electrocatalyst for proton exchange membrane fuel cells (PEMFCs).45 Tian et al. used vertically aligned carbon nanotubes as highly ordered catalyst supports to prepare ultra-low Pt loading MEA for applications in PEMFCs.48 These MEAs have shown excellent performance with Pt loading as low as 35 μg cm−2, which is comparable to the commercial Pt catalyst on carbon powder loading level (400 μg cm−2). A low-defect MWCNT–Pt nanocomposite has been synthesized by a soft chemical route and showed promising electrocatalytic activity and CO-poisoning tolerance for potential use in DMFCs.49 Yang et al. reported the polymer-wrapped MWCNTs as support for Pt nanoparticles as the cathode catalyst, leading to an improved MEA performance of a DMFC.50,51
In our previous work, a Pt nanorod assembly-based double-layered cathode was prepared which required a significant reduction in catalyst loading (up to 50% less) by using platinum carbonyl complexes as the cathode catalyst raw material compared to conventional cathode.52 Herein, we report the development of a method to fabricate a cross-twined MWCNT–Pt nanocomposite-based cathodic catalyst layer (CCL) for passive DMFCs by controlling the mass ratio of Pt and MWCNT in a solution containing platinum carbonyl complexes and MWCNTs. Compared with the maximum power density, we found that a 1![[thin space (1/6-em)]](https://www.rsc.org/images/entities/char_2009.gif) :
:![[thin space (1/6-em)]](https://www.rsc.org/images/entities/char_2009.gif) 2 mass ratio of Pt and MWCNTs shows the best MEA performance, including the power density of 19.2 ± 0.4 mW cm−2 using 2.0 M methanol solution and a 0.5 mg cm−2 Pt loading within the MWCNT–Pt nanocomposite-based CCL. The formation of the MWCNT–Pt nanocomplex-based CCL with a 3D network structure leads to a significant decrease in Pt loading, while maintaining a similar performance compared to a conventional MEA. Therefore, we envisioned that this method may provide a new way to reduce Pt loading and potentially help lead to the commercialization of DMFCs.
2 mass ratio of Pt and MWCNTs shows the best MEA performance, including the power density of 19.2 ± 0.4 mW cm−2 using 2.0 M methanol solution and a 0.5 mg cm−2 Pt loading within the MWCNT–Pt nanocomposite-based CCL. The formation of the MWCNT–Pt nanocomplex-based CCL with a 3D network structure leads to a significant decrease in Pt loading, while maintaining a similar performance compared to a conventional MEA. Therefore, we envisioned that this method may provide a new way to reduce Pt loading and potentially help lead to the commercialization of DMFCs.
2. Experimental
2.1 Materials
Sodium acetate (CH3COONa, AR), methanol (CH3OH, AR), ethanol (EtOH, AR), and isopropyl alcohol ((CH3)2CHOH, AR) were supplied by Sinopharm Chemical Reagent Co., Ltd. Sodium chloroplatinate (Na2PtCl6·6H2O) was purchased from Alfa Aesar. Multi-walled carbon nanotube solution (2.96 wt% MWCNT in methanol, 40–50 nm nanotube diameter, 10–30 μm nanotube length) was purchased from Beijing DK nano S&T Ltd. Nafion® 115 membrane, Nafion® solution (5.3 wt%), and PTFE solution (60 wt%) were purchased from DuPont. Pt–Ru/C (Pt loading: 40%, Ru loading: 20%; HiSpec 10![[thin space (1/6-em)]](https://www.rsc.org/images/entities/char_2009.gif) 000), Pt/C (Pt loading: 60 wt%, HiSpec 9100), Pt–Ru black (atomic ration 1
000), Pt/C (Pt loading: 60 wt%, HiSpec 9100), Pt–Ru black (atomic ration 1![[thin space (1/6-em)]](https://www.rsc.org/images/entities/char_2009.gif) :
:![[thin space (1/6-em)]](https://www.rsc.org/images/entities/char_2009.gif) 1, HiSpec 6000), and Pt black (HiSpec 1000) were purchased from Johnson Matthey. The gas diffusion layers (GDLs) for DMFCs were prepared with carbon paper (TGPH060, 20 wt% PTFE Toray), XC-72R carbon black (Cabot), and 10 wt% PTFE solution (diluted from 60 wt% PTFE solution). All reactants were used as received.
1, HiSpec 6000), and Pt black (HiSpec 1000) were purchased from Johnson Matthey. The gas diffusion layers (GDLs) for DMFCs were prepared with carbon paper (TGPH060, 20 wt% PTFE Toray), XC-72R carbon black (Cabot), and 10 wt% PTFE solution (diluted from 60 wt% PTFE solution). All reactants were used as received.
2.2 Formation of MWCNT–Pt nanocomposite
Platinum carbonyl complex solutions with a platinum concentration of 32.0 mM were prepared according to our previous work.52 Platinum carbonyl complex solutions and multi-walled carbon nanotube solutions were mixed with certain Pt/MWCNT mass ratios (3![[thin space (1/6-em)]](https://www.rsc.org/images/entities/char_2009.gif) :
:![[thin space (1/6-em)]](https://www.rsc.org/images/entities/char_2009.gif) 1, 1
1, 1![[thin space (1/6-em)]](https://www.rsc.org/images/entities/char_2009.gif) :
:![[thin space (1/6-em)]](https://www.rsc.org/images/entities/char_2009.gif) 1, 1
1, 1![[thin space (1/6-em)]](https://www.rsc.org/images/entities/char_2009.gif) :
:![[thin space (1/6-em)]](https://www.rsc.org/images/entities/char_2009.gif) 2, 1
2, 1![[thin space (1/6-em)]](https://www.rsc.org/images/entities/char_2009.gif) :
:![[thin space (1/6-em)]](https://www.rsc.org/images/entities/char_2009.gif) 3) in a glove box under an argon atmosphere. The as-prepared Pt/MWCNT mixed solutions were quickly sprayed onto a substrate such as a silicon wafer under air. The MWCNT–Pt nanocomposite was prepared by evaporation of methanol, drying overnight at 50 °C, washing with ultrapure water several times and drying under air.
3) in a glove box under an argon atmosphere. The as-prepared Pt/MWCNT mixed solutions were quickly sprayed onto a substrate such as a silicon wafer under air. The MWCNT–Pt nanocomposite was prepared by evaporation of methanol, drying overnight at 50 °C, washing with ultrapure water several times and drying under air.
2.3 MEA preparation
A conventional MEA was prepared according to the literature with a Nafion® 115 membrane, a cathode with 1.0 mg(Pt) cm−2 and an anode with 4.0 mg(Pt–Ru) cm−2 using a Sono-Tek Ultrasonic Atomizing Nozzle System.52 In this work, conventional anodes with 4.0 mg(Pt–Ru) cm−2 were used. The cathode based on the MWCNT–Pt nanocomposite was prepared by spreading a certain volume of as-prepared Pt/MWCNT mixed solution (mass ratio of Pt and MWCNT were 3![[thin space (1/6-em)]](https://www.rsc.org/images/entities/char_2009.gif) :
:![[thin space (1/6-em)]](https://www.rsc.org/images/entities/char_2009.gif) 1, 1
1, 1![[thin space (1/6-em)]](https://www.rsc.org/images/entities/char_2009.gif) :
:![[thin space (1/6-em)]](https://www.rsc.org/images/entities/char_2009.gif) 1, 1
1, 1![[thin space (1/6-em)]](https://www.rsc.org/images/entities/char_2009.gif) :
:![[thin space (1/6-em)]](https://www.rsc.org/images/entities/char_2009.gif) 2, and 1
2, and 1![[thin space (1/6-em)]](https://www.rsc.org/images/entities/char_2009.gif) :
:![[thin space (1/6-em)]](https://www.rsc.org/images/entities/char_2009.gif) 3, respectively) onto a cathode GDL as fabricated above under air. The solvent was allowed to evaporate under air, and the cathode was dried overnight at 50 °C, washed several times with ultrapure water, and dried in air to yield a new-structured cathode. The Pt loading in the new-structured cathode was 1.0 or 0.5 mg(Pt) cm−2. A 1.0 wt% Nafion® solution was prepared by diluting the original Nafion® solution with a 1
3, respectively) onto a cathode GDL as fabricated above under air. The solvent was allowed to evaporate under air, and the cathode was dried overnight at 50 °C, washed several times with ultrapure water, and dried in air to yield a new-structured cathode. The Pt loading in the new-structured cathode was 1.0 or 0.5 mg(Pt) cm−2. A 1.0 wt% Nafion® solution was prepared by diluting the original Nafion® solution with a 1![[thin space (1/6-em)]](https://www.rsc.org/images/entities/char_2009.gif) :
:![[thin space (1/6-em)]](https://www.rsc.org/images/entities/char_2009.gif) 1 (v/v) mixture of isopropanol and water and sonicating. Then, the 1.0 wt% Nafion® solution followed by a 20 wt% Nafion® solution was sprayed onto the new-structured cathode before preparation of the MEA. MEAs with an active area of 1 × 1 cm2 were fabricated by hot-pressing method (130 °C, 2 MPa) for 3 min and subsequently stored in a 2.0 M methanol solution before the test.
1 (v/v) mixture of isopropanol and water and sonicating. Then, the 1.0 wt% Nafion® solution followed by a 20 wt% Nafion® solution was sprayed onto the new-structured cathode before preparation of the MEA. MEAs with an active area of 1 × 1 cm2 were fabricated by hot-pressing method (130 °C, 2 MPa) for 3 min and subsequently stored in a 2.0 M methanol solution before the test.
2.4 Physical and electrochemical characterization
Scanning electron microscopy (SEM) images were collected at an electron acceleration voltage of 10.0 kV using a scanning electron microscope (FESEM, Hitachi S-4800). Transmission electron microscopy (TEM) images and high resolution transmission electron microscopy (HRTEM) images were taken using a JEOL 2100F at an accelerating voltage of 200 kV.Polarization curves of the passive DMFCs were recorded on an Arbin FCT testing system (Arbin Instrument Inc. USA) in an air-breathing mode and fed with 5 mL of 2.0 M methanol. A two minute waiting time was used to obtain a stable voltage for each discharging current point along the polarization curve. The stability of the DMFC was evaluated at a constant current density of 40 mA cm−2 for a period of time by discontinuously feeding fuel with 2.0 M methanol solution roughly every 12 h. Cyclic voltammograms were obtained using a Solartron SI 1287 Potentiostat/Galvanostat at a scan rate of 20 mV s−1 between 0.05 and 0.75 V. The cathode fed with humidified N2 formed the working electrode and the anode fed with humidified H2 was denoted as the counter electrode and reference electrode. Electrochemical impedance spectra (EIS) were obtained using a Solartron SI 1287 & 1255B instrument at a frequency range between 100 kHz and 0.01 Hz, and the cathode was applied as the working electrode whereas the anode was used as the counter electrode and reference electrode during the test. The data were obtained at a constant current density of 40 mA cm−2 and the amplitude of the sinusoidal voltage signal was 10 mV.52
3. Results and discussion
New nanostructured cathode-based MEAs with varying mass ratios of Pt and MWCNTs (MEAs with cathode based on mass ratio of Pt and MWCNT of 3![[thin space (1/6-em)]](https://www.rsc.org/images/entities/char_2009.gif) :
:![[thin space (1/6-em)]](https://www.rsc.org/images/entities/char_2009.gif) 1, 1
1, 1![[thin space (1/6-em)]](https://www.rsc.org/images/entities/char_2009.gif) :
:![[thin space (1/6-em)]](https://www.rsc.org/images/entities/char_2009.gif) 1, 1
1, 1![[thin space (1/6-em)]](https://www.rsc.org/images/entities/char_2009.gif) :
:![[thin space (1/6-em)]](https://www.rsc.org/images/entities/char_2009.gif) 2, and 1
2, and 1![[thin space (1/6-em)]](https://www.rsc.org/images/entities/char_2009.gif) :
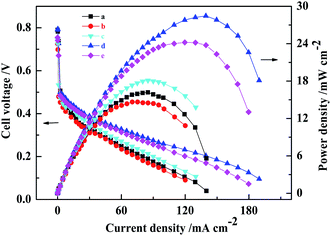
:![[thin space (1/6-em)]](https://www.rsc.org/images/entities/char_2009.gif) 3 were named as MEA3:1, MEA1:1, MEA1:2 and MEA1:3, respectively) were fabricated and the results of the performance and polarization curves of the fabricated MEAs with CCLs of different mass ratios are shown in Fig. 1. When the Pt loading was 1.0 mg(Pt) cm−2 and 4.0 mg(PtRu) cm−2, the maximal power density of all passive DMFCs tested was achieved using a CCL with a 1
3 were named as MEA3:1, MEA1:1, MEA1:2 and MEA1:3, respectively) were fabricated and the results of the performance and polarization curves of the fabricated MEAs with CCLs of different mass ratios are shown in Fig. 1. When the Pt loading was 1.0 mg(Pt) cm−2 and 4.0 mg(PtRu) cm−2, the maximal power density of all passive DMFCs tested was achieved using a CCL with a 1![[thin space (1/6-em)]](https://www.rsc.org/images/entities/char_2009.gif) :
:![[thin space (1/6-em)]](https://www.rsc.org/images/entities/char_2009.gif) 2 mass ratio of Pt and MWCNTs and found to be 28.5 ± 0.2 mW cm−2. The MEA3:1, MEA1:1, and MEA1:3 and conventional MEA were found to give power densities of 14.7 ± 0.3, 18.1 ± 0.2, 24.2 ± 0.2, and 16.2 ± 0.3 mW cm−2, respectively. The use of a nanostructured cathode with a suitable Pt
2 mass ratio of Pt and MWCNTs and found to be 28.5 ± 0.2 mW cm−2. The MEA3:1, MEA1:1, and MEA1:3 and conventional MEA were found to give power densities of 14.7 ± 0.3, 18.1 ± 0.2, 24.2 ± 0.2, and 16.2 ± 0.3 mW cm−2, respectively. The use of a nanostructured cathode with a suitable Pt![[thin space (1/6-em)]](https://www.rsc.org/images/entities/char_2009.gif) :
:![[thin space (1/6-em)]](https://www.rsc.org/images/entities/char_2009.gif) MWCNT mass ratio led to enhanced MEA performance. In addition, at the low current density region (≤30 mA cm−2), MEA1:2 and MEA1:3 exhibited higher power densities than those of conventional MEA, MEA3:1 and MEA1:1. In the low current density region, the polarization is mainly related to catalytic activity, which demonstrates that MEA1:2 and MEA1:3 have higher catalytic activity than the other MEAs. In the secondary current density region (30–130 mA cm−2), MEA1:2 and MEA1:3 showed a smaller ohmic resistance compared to the other MEAs. This is attributed to the excellent electrical conductivity of MWCNTs. However, in the high current density region (≥130 mA cm−2), there is a rapid decrease in cell voltage for the conventional MEA compared with that of MEA1:2. This is likely a result of having different types of cathode mass transport. In short, the great performance of MEA1:2 is an optimized result from the new-structured CCL.
MWCNT mass ratio led to enhanced MEA performance. In addition, at the low current density region (≤30 mA cm−2), MEA1:2 and MEA1:3 exhibited higher power densities than those of conventional MEA, MEA3:1 and MEA1:1. In the low current density region, the polarization is mainly related to catalytic activity, which demonstrates that MEA1:2 and MEA1:3 have higher catalytic activity than the other MEAs. In the secondary current density region (30–130 mA cm−2), MEA1:2 and MEA1:3 showed a smaller ohmic resistance compared to the other MEAs. This is attributed to the excellent electrical conductivity of MWCNTs. However, in the high current density region (≥130 mA cm−2), there is a rapid decrease in cell voltage for the conventional MEA compared with that of MEA1:2. This is likely a result of having different types of cathode mass transport. In short, the great performance of MEA1:2 is an optimized result from the new-structured CCL.
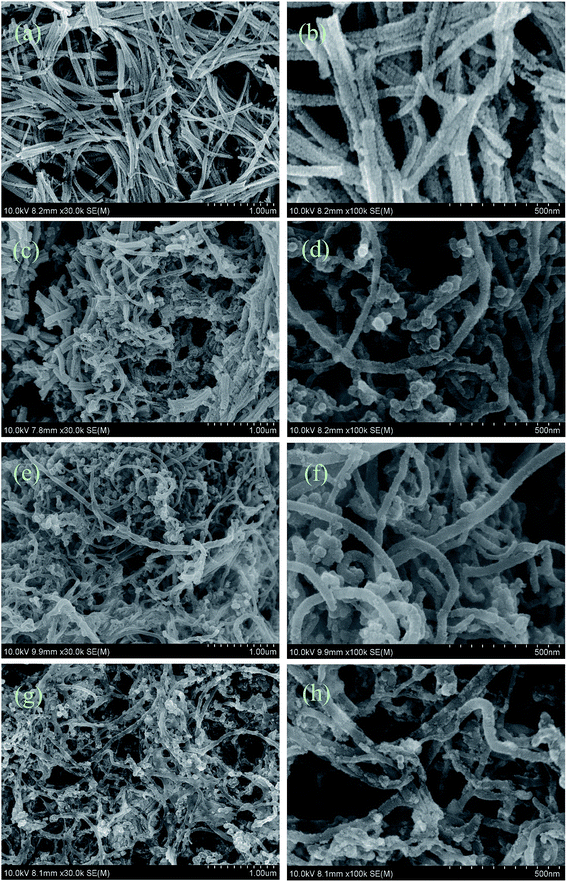
SEM top view images of the CCLs based on various mass ratios of Pt and MWCNTs were taken to explain the MEA performance shown in Fig. 1. The CCLs of MEA3:1 (Fig. 2a and b), MEA1:1 (Fig. 2c and d), MEA1:2 (Fig. 2e and f), and MEA1:3 (Fig. 2g and h) were imaged. Fig. 2a and b displays a CCL that consists of Pt nanorods and a rare MWCNT.52 Fig. 2c and d shows a CCL that consists of Pt nanorods and a higher MWCNT content. Fig. 2e and h shows a CCL that consists of uniformly network-distributed MWCNTs without Pt nanorods. In general, the higher the MWCNT content in the CCL (Fig. 2), the higher amount of cross-twined MWCNTs in the CCL. This type of MWCNT offers an unobstructed mass transport and a higher degree of catalyst utilization in the cathode, and eventually results in a significant improvement in performance as shown in Fig. 1. Moreover, the enlarged image of the MWCNTs in Fig. 2f and h shows the rough surface morphology caused by nano-particle clusters on the MWCNT. The thinner CCL in MEAs with Pt![[thin space (1/6-em)]](https://www.rsc.org/images/entities/char_2009.gif) :
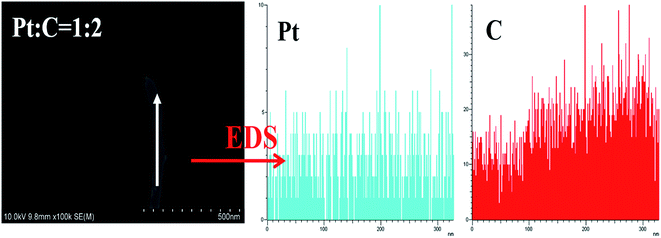
:![[thin space (1/6-em)]](https://www.rsc.org/images/entities/char_2009.gif) MWCNT mass ratios of MEA1:2 and MEA1:3 leads to a shorter channel for mass transportation and good performance values. The SEM image and EDS line scanning of a single MWCNT from MEA1:2 was obtained as shown in Fig. 3. The carbon element continuously exists and platinum discontinuously exists along the nanotube axis (diameter: ∼45 nm). According to the nanotube data and the element distribution, the nanotube is considered a MWCNT–Pt nanocomposite with Pt nano-particles discontinuously distributed on the MWCNTs. TEM & HRTEM images and particle size distributions of different mass ratios of Pt and MWCNT are shown in Fig. S1 of the ESI.† The average particle sizes for all the samples are around 2 nm. According to the HRTEM image in Fig. 4d, the small dots in Fig. S1† are Pt nanoparticles. When the mass ratios of Pt and MWCNT are 3
MWCNT mass ratios of MEA1:2 and MEA1:3 leads to a shorter channel for mass transportation and good performance values. The SEM image and EDS line scanning of a single MWCNT from MEA1:2 was obtained as shown in Fig. 3. The carbon element continuously exists and platinum discontinuously exists along the nanotube axis (diameter: ∼45 nm). According to the nanotube data and the element distribution, the nanotube is considered a MWCNT–Pt nanocomposite with Pt nano-particles discontinuously distributed on the MWCNTs. TEM & HRTEM images and particle size distributions of different mass ratios of Pt and MWCNT are shown in Fig. S1 of the ESI.† The average particle sizes for all the samples are around 2 nm. According to the HRTEM image in Fig. 4d, the small dots in Fig. S1† are Pt nanoparticles. When the mass ratios of Pt and MWCNT are 3![[thin space (1/6-em)]](https://www.rsc.org/images/entities/char_2009.gif) :
:![[thin space (1/6-em)]](https://www.rsc.org/images/entities/char_2009.gif) 1 and 1
1 and 1![[thin space (1/6-em)]](https://www.rsc.org/images/entities/char_2009.gif) :
:![[thin space (1/6-em)]](https://www.rsc.org/images/entities/char_2009.gif) 1, both Pt nanoparticles wrapped MWCNTs and Pt nanoparticles are clearly observed (Fig. S1a and S1b†) because of excess Pt content. When the mass ratios of Pt and MWCNT are 1
1, both Pt nanoparticles wrapped MWCNTs and Pt nanoparticles are clearly observed (Fig. S1a and S1b†) because of excess Pt content. When the mass ratios of Pt and MWCNT are 1![[thin space (1/6-em)]](https://www.rsc.org/images/entities/char_2009.gif) :
:![[thin space (1/6-em)]](https://www.rsc.org/images/entities/char_2009.gif) 2 and 1
2 and 1![[thin space (1/6-em)]](https://www.rsc.org/images/entities/char_2009.gif) :
:![[thin space (1/6-em)]](https://www.rsc.org/images/entities/char_2009.gif) 3, only Pt nanoparticles wrapped MWCNTs are found (Fig. S1c and S1d†), leading to an improved Pt utilization, which could explain the enhanced performance of the MEA1:2 and MEA1:3.
3, only Pt nanoparticles wrapped MWCNTs are found (Fig. S1c and S1d†), leading to an improved Pt utilization, which could explain the enhanced performance of the MEA1:2 and MEA1:3.
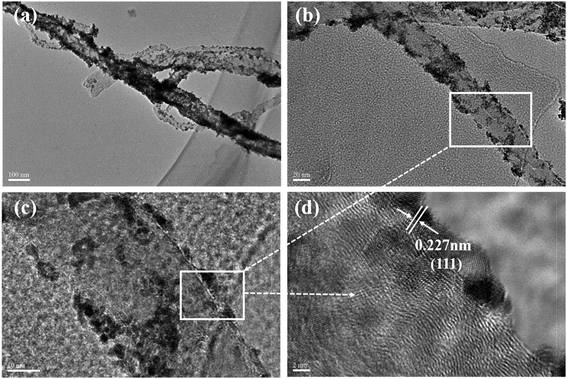 | ||
| Fig. 4 TEM and HRTEM images of MWCNT–Pt nanocomposite: (a) TEM image of MWCNT–Pt nanocomposite, (b) TEM image of single MWCNT–Pt nanocomposite, (c and d) HRTEM image of MWCNT–Pt nanocomposite. | ||
The MWCNT–Pt CCLs were fabricated by depositing a platinum carbonyl complex solution and a MWCNT solution on a silicon wafer and evaporation of the solvent under air. The TEM images further verified the structure of a MWCNT–Pt CCL (Fig. 4). The nanotubes in Fig. 4a and b have a diameter in the range of 40–50 nm which matches the diameter of the MWCNTs. The 2–4 nm diameter nano-particles are well distributed on the MWCNTs (Fig. 4c). A lattice spacing of 0.227 nm (Fig. 4d, HRTEM) for nano-particles on the MWCNTs is attributed to the Pt (111) lattice fringe. Thus, Pt nano-particles are distributed on the MWCNT surface along the axis which leads to a higher catalyst utilization compared to agglomerated Pt nanorods and commercial Pt/C. This clearly explains why MEA1:2 and MEA1:3 exhibit better performance than other MEAs. Owing to the best MEA performance of MEA1:2, further work focused on the MEA.
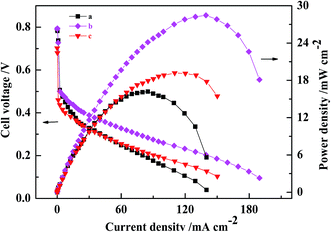
A comparison of the polarization curves for the three passive DMFCs with CCLs fabricated by conventional catalyst and by MWCNT–Pt CCL with varying Pt loadings is shown in Fig. 5. When Pt loading is decreased to 0.5 mg cm−2, the maximum power density of the DMFC based on Pt–MWCNT CCL is 19.2 ± 0.4 mW cm−2, which is higher than that of a conventional MEA with a Pt loading of 1.0 mg cm−2. This shows that using MWCNT–Pt nanocomposite-based DMFCs require substantially less Pt loading compared to DMFCs based on conventional MEAs. At a catalyst loading of 1.0 mg(Pt) cm−2, the ohmic resistance of the MWCNT–Pt MEA was 427 mΩ while that of the conventional MEA was 630 mΩ (Table 1). This is due to the excellent electrical conductivity of MWCNT. This reduced ohmic resistance leads to better MEA performance.
| Cathode structure | Cathode loading/mg cm−2 | Maximum power density/mW cm−2 | Ohmic resistance/mΩ | ESAs by H desorption/m2 g(Pt)−1 |
|---|---|---|---|---|
| Conventional MEA | 1.0 | 16.2 ± 0.3 | 630 | 24.1 ± 0.4 |
| MEA1:2 | 1.0 | 28.5 ± 0.2 | 427 | 43.6 ± 0.5 |
| 0.5 | 19.2 ± 0.4 | 601 | — |
Possible mechanisms for the improved performance of the DMFCs based on MWCNT–Pt nanocomposite were investigated further. Cyclovoltammograms were collected in order to quantify the ESAs of the cathodes at the same loading of 1.0 mg(Pt) cm−2 (Fig. 6). The ESAs were calculated by integrating the H adsorption/desorption areas53 of the cathodes used in the conventional CCL and the MWCNT–Pt CCLs, and found to be ca. 24.1 ± 0.4 and 43.6 ± 0.5 m2 g−1, respectively (Table 1). These values indicate that the MWCNT–Pt CCLs utilize the catalyst more efficiently and are consistent with the MEA performance as shown in Fig. 5. The performance enhancement is largely attributed to an increase in ESA when there is a MWCNT–Pt nanocomposition in the CCL.
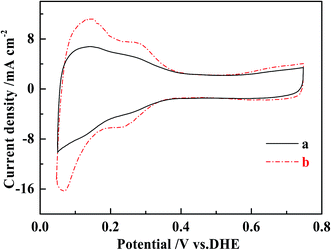 | ||
| Fig. 6 Cyclic voltammograms of the cathodes of MEAs with the loading of 1.0 mg(Pt) cm−2 at a scan rate of 20 mV s−1 at 25 ± 1 °C. (a) The conventional MEA, (b) MEA1:2. | ||
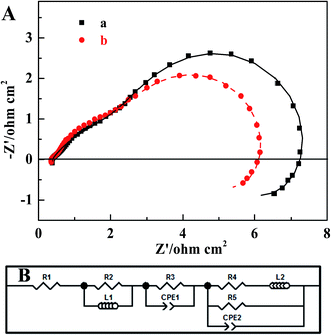
The EIS of two MEAs were collected in order to identify the effect that the MWCNT–Pt nanocomposite-based CCL had on the impedance of the respective MEAs. Fig. 7 shows the MEA impedance spectra and fitted curves based on an equivalent circuit model, as described in our previous work.52 The marked points are the experimental data and the solid lines are the fitted curves. The fitted parameters are provided in Table 2. From these spectra, it is clear that the charge transfer resistance (R3: 2.555 Ω cm2) of the MWCNT–Pt nanocomposite-based MEAs is smaller than that of the conventional MEA (R3: 2.923 Ω cm2) at the same loading (1.0 mg(Pt) cm−2). This improved MEA performance as shown in Fig. 5 may be a result of the cross-twined MWCNT–Pt nanocomposite in the CCL. This nano-composition provides more catalytically active sites and an unobstructed mass transport for the cathode.
| Parameter | Conventional MEA | MEA1:2 |
|---|---|---|
| R1 (Ohm cm2) | 0.372 | 0.351 |
| R2 (Ohm cm2) | 0.263 | 0.254 |
| L1 (H cm−2) | 6.021 × 10⁻⁸ | 6.962 × 10⁻⁸ |
| R3 (Ohm cm2) | 2.923 | 2.555 |
| CPE1-T (F cm−2) | 0.100 | 0.090 |
| CPE1-P | 0.564 | 0.663 |
| R4 (Ohm cm2) | 3.630 | 3.200 |
| L2 (H cm−2) | 95.252 | 89.403 |
| R5 (Ohm cm2) | 4.441 | 3.532 |
| CPE2-T (F cm−2) | 0.340 | 0.430 |
| CPE2-P | 0.991 | 0.993 |
The application of MWCNT–Pt CCLs in MEAs significantly improves the performance of the corresponding passive DMFCs. Therefore, the durability of these devices over long-term operation was tested. As shown in Fig. 8, a steady cell performance was observed for 120 h at a current density of 40 mA cm−2, which indicates that the stability of this MEA is suitable for practical applications.
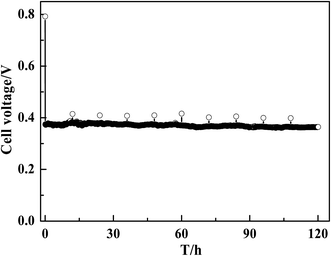 | ||
| Fig. 8 Discharging curve of a DMFC with MEA1:2 (1.0 mg(Pt) cm−2) at a constant current of 40 mA cm−2. | ||
4. Conclusions
Newly structured cathodes based on Pt and MWCNTs (1![[thin space (1/6-em)]](https://www.rsc.org/images/entities/char_2009.gif) :
:![[thin space (1/6-em)]](https://www.rsc.org/images/entities/char_2009.gif) 2 by mass) were prepared and used in the fabrication of MEAs, with the best performing MEAs having Pt loadings of 1.0 mg(Pt) cm−2 and 4.0 mg(PtRu) cm−2. The 3D network structure of the nanocomposite-based CCLs used in these MEAs leads to a decrease in charge transfer resistance of the cathode reaction, a large increase in the utilization of cathode catalyst, and ultimately, an enhanced performance in the DMFC. The discontinuous distribution of Pt nano-particles on the MWCNT and the cross-twined networks within the CCL may also contribute. It is highly desirable to develop new ways to reduce the cost and expedite the commercialization of DMFC.
2 by mass) were prepared and used in the fabrication of MEAs, with the best performing MEAs having Pt loadings of 1.0 mg(Pt) cm−2 and 4.0 mg(PtRu) cm−2. The 3D network structure of the nanocomposite-based CCLs used in these MEAs leads to a decrease in charge transfer resistance of the cathode reaction, a large increase in the utilization of cathode catalyst, and ultimately, an enhanced performance in the DMFC. The discontinuous distribution of Pt nano-particles on the MWCNT and the cross-twined networks within the CCL may also contribute. It is highly desirable to develop new ways to reduce the cost and expedite the commercialization of DMFC.
Acknowledgements
We would like to thank the National ‘863’ High-Tech. Research Programs of China (2015AA043503-2) and the National Natural Science Foundation of China (51506213, 21533005) for support of this work.References
- A. Heinzel and V. M. Barragán, J. Power Sources, 1999, 84, 70–74 CrossRef CAS.
- E. Gulzow, T. Kaz, R. Reissner, H. Sander, L. Schilling and M. von Bradke, J. Power Sources, 2002, 105, 261–266 CrossRef CAS.
- C. Y. Chen and P. Yang, J. Power Sources, 2003, 123, 37–42 CrossRef CAS.
- L. Jianguo, S. Gongquan, Z. Fengliang, W. Guoxiong, Z. Gang, C. Likang, Y. Baolian and X. Qin, J. Power Sources, 2004, 133, 175–180 CrossRef.
- D. Dunwoody and J. Leddy, Electrochem. Soc. Interface, 2005, 14, 37–39 CAS.
- S. K. Kamarudin, W. R. W. Daud, S. L. Ho and U. A. Hasran, J. Power Sources, 2007, 163, 743–754 CrossRef CAS.
- H. I. Joh, S. Y. Hwang, J. H. Cho, T. J. Ha, S.-K. Kim, S. H. Moon and H. Y. Ha, Int. J. Hydrogen Energy, 2008, 33, 7153–7162 CrossRef CAS.
- W. W. Yang and T. S. Zhao, Electrochim. Acta, 2007, 52, 6125–6140 CrossRef CAS.
- F. Xie, C. Chen, H. Meng and P. K. Shen, Fuel Cells, 2007, 7, 319–322 CrossRef CAS.
- Z.-B. Wang, G.-P. Yin, P.-F. Shi, B.-Q. Yang and P.-X. Feng, J. Power Sources, 2007, 166, 317–323 CrossRef CAS.
- H. M. Chen, R. S. Liu, M. Y. Lo, S. C. Chang, L. D. Tsai, Y. M. Peng and J. F. Lee, J. Phys. Chem. C, 2008, 112, 7522–7526 CAS.
- S. Jiang, Y. Ma, G. Jian, H. Tao, X. Wang, Y. Fan, Y. Lu, Z. Hu and Y. Chen, Adv. Mater., 2009, 21, 4953–4956 CrossRef CAS PubMed.
- K. Gong, F. Du, Z. Xia, M. Durstock and L. Dai, Science, 2009, 323, 760–764 CrossRef CAS PubMed.
- H.-W. Liang, S. Liu, J.-Y. Gong, S.-B. Wang, L. Wang and S.-H. Yu, Adv. Mater., 2009, 21, 1850–1854 CrossRef CAS.
- X. Wang, J. Liao, C. Liu, W. Xing and T. Lu, Electrochem. Commun., 2009, 11, 198–201 CrossRef CAS.
- K. W. Park, B. K. Kwon, J. H. Choi, I. S. Park, Y. M. Kim and Y. E. Sung, J. Power Sources, 2002, 109, 439–445 CrossRef CAS.
- Y.-J. Wang, D. P. Wilkinson and J. Zhang, Chem. Rev., 2011, 111, 7625–7651 CrossRef CAS PubMed.
- J. Cao, C. Du, S. C. Wang, P. Mercier, X. Zhang, H. Yang and D. L. Akins, Electrochem. Commun., 2007, 9, 735–740 CrossRef CAS.
- C. H. Wang, H. Y. Dub, Y. T. Tsai, C. P. Chen, C. J. Huang, L. C. Chen, K. H. Chen and H. C. Shih, J. Power Sources, 2007, 171, 55–62 CrossRef CAS.
- T. Yuan, Z. Zou, M. Chen, Z. Li, B. Xia and H. Yang, J. Power Sources, 2009, 192, 423–428 CrossRef CAS.
- H. Wu, T. Yuan, Q. Huang, H. Zhang, Z. Zou, J. Zheng and H. Yang, Electrochim. Acta, 2014, 141, 1–5 CrossRef CAS.
- Q. Huang, J. Jiang, J. Chai, T. Yuan, H. Zhang, Z. Zou, X. Zhang and H. Yang, J. Power Sources, 2014, 262, 213–218 CrossRef CAS.
- P. Chen, H. Wu, T. Yuan, Z. Zou, H. Zhang, J. Zheng and H. Yang, J. Power Sources, 2014, 255, 70–75 CrossRef CAS.
- M. Michel, A. Taylor, R. Sekol, P. Podsiadlo, P. Ho, N. Kotov and L. Thompson, Adv. Mater., 2007, 19, 3859–3864 CrossRef CAS.
- M.-L. Lin, C.-C. Huang, M.-Y. Lo and C.-Y. Mou, J. Phys. Chem. C, 2008, 112, 867–873 CAS.
- H. Lee, S. E. Habas, S. Kweskin, D. Butcher, G. A. Somorjai and P. Yang, Angew. Chem., Int. Ed., 2006, 45, 7824–7828 CrossRef CAS PubMed.
- T. K. Sau and A. L. Rogach, Adv. Mater., 2010, 22, 1781–1804 CrossRef CAS PubMed.
- W.-N. Wang, W.-J. An, B. Ramalingam, S. Mukherjee, D. M. Niedzwiedzki, S. Gangopadhyay and P. Biswas, J. Am. Chem. Soc., 2012, 134, 11276–11281 CrossRef CAS PubMed.
- J. Suntivich, Z. Xu, C. E. Carlton, J. Kim, B. Han, S. W. Lee, N. Bonnet, N. Marzari, L. F. Allard, H. A. Gasteiger, K. Hamad-Schifferli and Y. Shao-Horn, J. Am. Chem. Soc., 2013, 135, 7985–7991 CrossRef CAS PubMed.
- E. P. Lee, Z. Peng, D. M. Cate, H. Yang, C. T. Campbell and Y. Xia, J. Am. Chem. Soc., 2007, 127, 10634–10635 CrossRef PubMed.
- C. Koenigsmann, W.-p. Zhou, R. R. Adzic, E. Sutter and S. S. Wong, Nano Lett., 2010, 10, 2806–2811 CrossRef CAS PubMed.
- J. Mao, X. Cao, J. Zhen, H. Shao, H. Gu, J. Lu and J. Y. Ying, J. Mater. Chem., 2011, 21, 11478–11481 RSC.
- L. Yang, X. Song, M. Qi, L. Xia and M. Jin, J. Mater. Chem. A, 2013, 1, 7316 CAS.
- C. Li, T. Sato and Y. Yamauchi, Angew. Chem., Int. Ed., 2013, 52, 8050–8053 CrossRef CAS PubMed.
- T. Kijima, T. Yoshimura, M. Uota, T. Ikeda, D. Fujikawa, S. Mouri and S. Uoyama, Angew. Chem., Int. Ed., 2004, 43, 228–232 CrossRef CAS PubMed.
- C. Chen and P.-k. Shen, Battery Bimon., 2009, 39, 335–337 CAS.
- T. V. Reshetenko, H.-T. Kim and H.-J. Kweon, Electrochim. Acta, 2008, 53, 3043–3049 CrossRef CAS.
- S. Takenaka, H. Miyamoto, Y. Utsunomiya, H. Matsune and M. Kishida, J. Phys. Chem. C, 2014, 118, 774–783 CAS.
- B. Y. Xia, H. B. Wu, Y. Yan, X. W. Lou and X. Wang, J. Am. Chem. Soc., 2013, 135, 9480–9485 CrossRef CAS PubMed.
- B. Y. Xia, W. T. Ng, H. B. Wu, X. Wang and X. W. Lou, Angew. Chem., Int. Ed., 2012, 51, 7213–7216 CrossRef CAS PubMed.
- S. Wang, S. P. Jiang, T. J. White, J. Guo and X. Wang, Adv. Funct. Mater., 2010, 20, 1368 CAS.
- S. Wang, F. Yang, S. P. Jiang, S. Chen and X. Wang, Electrochem. Commun., 2010, 12, 1646–1649 CrossRef CAS.
- S. Wang, S. P. Jiang, T. J. White, J. Guo and X. Wang, J. Phys. Chem. C, 2009, 113, 18935–18945 CAS.
- W. Zhang, A. I. Minett, M. Gao, J. Zhao, J. M. Razal, G. G. Wallace, T. Romeo and J. Chen, Adv. Energy Mater., 2011, 1, 671–677 CrossRef CAS.
- B. Fang, M.-S. Kim, J. H. Kim, M. Y. Song, Y.-J. Wang, H. Wang, D. P. Wilkinson and J.-S. Yu, J. Mater. Chem., 2011, 21, 8066–8073 RSC.
- Y.-J. Wang, B. Fang, H. Li, X. T. Bi and H. Wang, Prog. Mater. Sci., 2016, 82, 445–498 CrossRef CAS.
- Y.-J. Wang, N. Zhao, B. Fang, H. Li, X. T. Bi and H. Wang, Chem. Rev., 2015, 115, 3433–3467 CrossRef CAS PubMed.
- Z. Q. Tian, S. H. Lim, C. K. Poh, Z. Tang, Z. Xia, Z. Luo, P. K. Shen, D. Chua, Y. P. Feng, Z. Shen and J. Lin, Adv. Energy Mater., 2011, 1, 1205–1214 CrossRef CAS.
- H. Huang, D. Sun and X. Wang, J. Phys. Chem. C, 2011, 115, 19405–19412 CAS.
- Z. Yang and N. Nakashima, Sci. Rep., 2015, 5, 12236 CrossRef CAS PubMed.
- Z. Yang and N. Nakashima, ChemCatChem, 2016, 8, 600–606 CrossRef CAS.
- L. Pu, H. Zhang, T. Yuan, Z. Zou, L. Zou, X.-M. Li and H. Yang, J. Power Sources, 2015, 276, 95–101 CrossRef CAS.
- A. N. Correia, L. H. Mascaro, S. A. S. Machado and L. A. Avaca, Electrochim. Acta, 1997, 42, 493–495 CrossRef CAS.
Footnote |
| † Electronic supplementary information (ESI) available. See DOI: 10.1039/c6ra28703d |
| This journal is © The Royal Society of Chemistry 2017 |

