 Open Access Article
Creative Commons Attribution 3.0 Unported Licence
Plasticizing and crosslinking effects of borate additives on the structure and properties of poly(vinyl acetate)†
Shiyu Genga,
Faiz Ullah Shahb,
Peng Liua,
Oleg N. Antzutkinbc and
Kristiina Oksman *ad
*ad
aDivision of Materials Science, Department of Engineering Sciences and Mathematics, Luleå University of Technology, SE-971 87, Luleå, Sweden. E-mail: kristiina.oksman@ltu.se
bChemistry of Interfaces, Luleå University of Technology, SE-97187 Luleå, Sweden
cDepartment of Physics, University of Warwick, Coventry, UK
dFibre and Particle Engineering, University of Oulu, Finland
First published on 23rd January 2017
Abstract
As an environmentally friendly, low-cost and widely used polymer, poly(vinyl acetate) (PVAc) is worth modifying to achieve better properties. Here, we report on the influence of borate additives on the structure and properties of partially hydrolysed PVAc. In addition to the general crosslinking function of borate additives, an extraordinary plasticizing effect was found. By controlling the pH from 4 to 11 during sample preparation, the plasticizing and crosslinking effects can be shifted. In alkaline conditions, the degree of crosslinking in the PVAc/borate sample is increased; however, this increase declines gradually with an increase in the borate additive content, which impacts the morphology of the PVAc latex particles, as well as the mechanical and thermal properties of the PVAc/borate films. In contrast, in acidic conditions, the PVAc/borate films are plasticized by borate additives; thus, their ultimate mechanical strength, elastic moduli and thermal stabilities decrease, while the water diffusivities increase.
Introduction
Poly(vinyl acetate) (PVAc) is a polymer that is widely used in many applications, such as paints, surface coatings, food additives and adhesives for wood, paper and cloth. PVAc, with its advantageous properties, can be considered a “green” material suitable for overcoming a range of environmental challenges. First, PVAc can be produced from renewable resources. Its monomer, vinyl acetate, can be synthesized from bioethanol, which is extracted from the biomass refining process, and then further treated by dehydration, oxidation and vinylation.1 Second, PVAc is predominantly synthesized by emulsion polymerization, with the use of water as the dispersion medium during processing. This type of synthesis is a nontoxic, non-flammable and low-cost system, which is more environmentally friendly than other polymerization methods.2–4 Finally, it has been reported that PVAc is principally biodegradable,1 which means that it will be modified, hydrolysed, metabolized and finally assimilated by microbial organisms under specific conditions.However, several drawbacks of PVAc, including deficient mechanical properties, a high water or humidity sensitivity and a poor performance at elevated temperatures,5,6 pose limitations in some applications. During the last few decades, many studies have focused on improving the properties of PVAc. One of the most famous reports from 1940 by Perrin et al.7 has described in detail, for the first time, copolymerization of ethylene with vinyl-acetate: The product poly(ethylene-co-vinyl-acetate) has then been widely used in various types of commercial products due to its much higher ductility and lower water sensitivity compared to pure PVAc. Recently, nanocomposites with improved properties achieved by adding nanosized reinforcements into PVAc, have received a great attention. Kaboorani et al. studied the effects of admixing of nanoclays and cellulose nanocrystals on the adhesive properties of PVAc, especially at elevated temperatures and in wet conditions.5,6 Khan et al. improved the adhesive strength and toughness of PVAc dramatically by adding only 0.1 vol% of graphene.8 Mathew et al. investigated the moisture absorption and its effect on the mechanical properties of PVAc reinforced by cellulose nanocrystals.9 Gong et al. studied the viscoelastic properties and toughness of PVAc nanocomposites with cellulose nanofibers.10,11
Alternatively, crosslinking PVAc with certain crosslinkers, for instance, sodium tetraborate (borax), is another possible approach to enhance the mechanical and thermal properties and moisture resistance of PVAc. Borax, an environmentally benign mineral mined directly from the ground, is well known to crosslink diol-containing molecules in aqueous media under alkaline conditions and to form borate complexes. Many studies have been done on crosslinking of poly(vinyl alcohol) by borax or its derivatives,12–16 and crosslinking of partially hydrolysed PVAc to form gel-like materials has also been reported. Angelova et al. studied the structure and rheological properties of PVAc/borate gel after absorbing different organic liquids,17,18 and this type of gel was further developed by Natali et al. for application as a cleaner for painted surfaces.19
In our previous research,20 we combined both methods – reinforcing with nanocellulose and crosslinking with borax – to improve the properties of PVAc, and we found very interesting behaviour of borax-crosslinked PVAc films. Some experiments indicated that borate additives can not only provide crosslinking but also have a plasticizing effect on PVAc films prepared at specific pH, although this has not yet been fully explored. Thus, in this report, both plasticizing and crosslinking effects of borate additives on PVAc/borate samples prepared at different pH are investigated. The morphology of PVAc/borate latex particles as well as the structure, mechanical performance, thermal properties and moisture absorption behaviour of PVAc/borate films are explored. Furthermore, the relationship between the structure and properties of the PVAc/borate materials is also discussed in detail.
Experimental
Materials
Vinyl acetate monomer (99%) was purchased from Alfa Aesar, Karlsruhe, Germany. Potassium peroxodisulfate (KPS) was purchased from VWR International, Leuven, Belgium. Sodium hydroxide (pure pellets) and acetic acid (96%) were purchased from Merck KGaA, Darmstadt, Germany. Sodium tetraborate decahydrate (borax) (≥99.5%), glyceryl triacetate (GTA) (≥99%), docusate sodium salt (≥96%), and sodium bicarbonate (≥99.7%) were all purchased from Sigma-Aldrich, St. Louis, USA. All chemicals were used as received.Sample preparation
Poly(vinyl acetate) (PVAc) was synthesized using an emulsion polymerization method, according to US patent 4812510.21 Briefly, 2.25 g of docusate sodium salt as surfactant and 0.135 g of sodium bicarbonate were dissolved in 255 g of distilled water in a three-necked flask with a water-cooled condenser. The solution was heated to 353 K and kept under stirring. Then, 0.225 g of KPS, as an initiator of polymerization, and 2.25 g of vinyl acetate monomer were added. After 20 min, 42.75 g of vinyl acetate monomer was continuously fed into the flask dropwise over 3 h. Finally, the reaction was maintained at 353 K for another 30 min after feeding. The solid content of the obtained PVAc latex was 15.3 wt% and was measured by weighing before and after overnight drying in an oven at 333 K.The compositions of the samples prepared in this study, with different borax content at various pH values, are given in Table 1. The PVAc/borate films were prepared by a crosslinking/plasticizing reaction, followed by solvent casting and hot pressing. The reaction for each sample was performed by adding a certain amount of a borax saturated solution (293 K) to the PVAc latex dropwise, and then, the pH of the dispersion was controlled to a selected value by sodium hydroxide (0.1 M) or acetic acid. Afterwards, the dispersion was heated at 353 K for 1 h with stirring, and then, the PVAc/borate latex was obtained. Next, GTA was added as a plasticizer and the weight ratio of GTA to PVAc in each sample was kept constant (GTA![[thin space (1/6-em)]](https://www.rsc.org/images/entities/char_2009.gif) :
:![[thin space (1/6-em)]](https://www.rsc.org/images/entities/char_2009.gif) PVAc = 5
PVAc = 5![[thin space (1/6-em)]](https://www.rsc.org/images/entities/char_2009.gif) :
:![[thin space (1/6-em)]](https://www.rsc.org/images/entities/char_2009.gif) 95). Finally, the dispersion was poured into a Teflon Petri dish and dried in an oven with a fan at 313 K for 30 h. The dried film was peeled off and hot pressed using a laboratory press (LabEcon 300, Fontijne Grotnes, Netherlands) at 423 K for 1 min under a pressure of 1.1 MPa, with 2 min of pre-heating. The thickness of the obtained films was ∼0.15 mm. The native PVAc latexes and dried films were prepared, with controlled pH values, as references, in the same manner as described above but without the addition of borax.
95). Finally, the dispersion was poured into a Teflon Petri dish and dried in an oven with a fan at 313 K for 30 h. The dried film was peeled off and hot pressed using a laboratory press (LabEcon 300, Fontijne Grotnes, Netherlands) at 423 K for 1 min under a pressure of 1.1 MPa, with 2 min of pre-heating. The thickness of the obtained films was ∼0.15 mm. The native PVAc latexes and dried films were prepared, with controlled pH values, as references, in the same manner as described above but without the addition of borax.
| Sample coding | Borax content (wt% of dried film) | pH | Tg (K) | Me (%) |
|---|---|---|---|---|
| a Samples are coded as “XaPVAC-b”, where “X” stands for the borax addition, “a” stands for borax content (wt%) in the samples and “b” stands for the controlled pH values during the sample preparation. | ||||
| PVAc-4 | 0 | 4 | 298.9 | 4.7 ± 0.5 |
| X0.5PVAc-4a | 0.5 | 4 | 298.3 | 5.6 ± 1.1 |
| X1PVAc-4a | 1 | 4 | 297.9 | 5.9 ± 1.2 |
| X1.5PVAc-4a | 1.5 | 4 | 297.5 | 5.9 ± 2.7 |
| X2PVAc-4a | 2 | 4 | 297.2 | 4.8 ± 1.1 |
| X3PVAc-4a | 3 | 4 | 296.8 | 6.7 ± 1.4 |
| PVAc-9.3 | 0 | 9.3 | 298.7 | 8.6 ± 0.7 |
| X0.5PVAc-9.3a | 0.5 | 9.3 | 298.9 | 12.3 ± 1.4 |
| X1PVAc-9.3a | 1 | 9.3 | 299.3 | 15.9 ± 0.9 |
| X1.5PVAc-9.3a | 1.5 | 9.3 | 298.6 | 18.6 ± 3.0 |
| X2PVAc-9.3a | 2 | 9.3 | 297.6 | 11.9 ± 0.5 |
| X3PVAc-9.3a | 3 | 9.3 | 297.2 | 12.7 ± 1.5 |
| PVAc-11 | 0 | 11 | 297.7 | 9.8 ± 0.8 |
| X0.5PVAc-11a | 0.5 | 11 | 298.2 | 19.7 ± 3.1 |
| X1PVAc-11a | 1 | 11 | 299.5 | 15.3 ± 1.1 |
| X1.5PVAc-11a | 1.5 | 11 | 299.8 | 21.6 ± 0.5 |
| X2PVAc-11a | 2 | 11 | 300.3 | 17.4 ± 3.3 |
| X3PVAc-11a | 3 | 11 | 298.9 | 15.2 ± 2.8 |
Characterization methods
 | (1) |
 is the slope of the initial linear portion in the moisture absorption curve.
Results and discussion
Structure characterization
| Sample coding | Hydrolysis degree (%) | 13C chemical shift (region C) (ppm) | 13C chemical shift (region D) (ppm) |
|---|---|---|---|
| PVAc-4 | 7.9 | 66.0 | 167.6 |
| PVAc-9.3 | 9.8 | 67.3 | 170.4 |
| PVAc-11 | 9.9 | 68.0 | 174.6 |
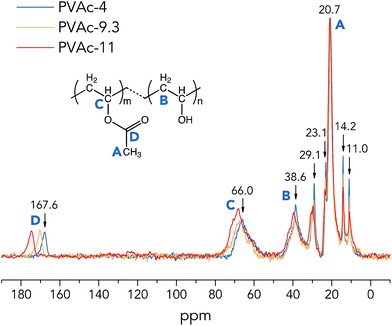 | ||
| Fig. 1 One-pulse 13C MAS NMR spectra of the native PVAc films (partially hydrolysed in various pH conditions). | ||
From Fig. 1, it is clear that the 13C sites of the native PVAc become more de-shielded (chemical shifts move towards higher ppm values) with an increase in pH from 4 to 11, especially for –CHO carbons (region C) and –COO carbons (region D), see Table 2. These spectral observations imply structural changes in PVAc-4, PVAc-9.3 and PVAc-11. Asakawa et al. investigated the hydrogen-bonding effect on 13C NMR chemical shifts of L-alanine residues, and they found that carbon sites become more de-shielded with a decrease in length of hydrogen bonds.24 Similarly, it is suggested here that an additional de-shielding of –CHO and –COO carbon sites in PVAc samples prepared in different pH conditions (see Fig. 1) is also caused by hydrogen bonding effects, as will be discussed in the following text. Table 2 shows that with an increase in pH, the degree of hydrolysis of PVAc is increased from 7.9% in PVAc-4 to 9.9% in PVAc-11, which indicates that there are larger numbers of hydroxyl groups present in PVAc-11, and thus, the polymer chains of PVAc-11 have a higher propensity to form hydrogen bonds with each other. A larger number of hydroxyl groups also contributes to a higher flexibility of the PVAc chains, because bulky acetate side groups (before the hydrolysis) cause larger restrictions in chain movement. As a result of a higher degree of hydrolysis in PVAc-11, polymer chains could pack more closely compared to those in PVAc-4 and generate more hydrogen bonds with a shorter length, which should cause a larger de-shielding of 13C sites. Moreover, it is obvious that an additional de-shielding of resonance lines in regions C and D is significantly larger than that for other resonance lines (see Fig. 1), which implies that the –CHO and –COO carbon sites in PVAc are more strongly influenced by the pH compared with the methyl –CH3 (region A) and methylene –CH2 carbons (region B). This is because a larger number of the –CHO and –COO carbons are involved in the hydrogen bonds in the form of C–O–H⋯O and C![[double bond, length as m-dash]](https://www.rsc.org/images/entities/char_e001.gif) O⋯H–O, respectively,25 and chemical shifts of these carbon sites are obviously more affected by hydrogen bonding compared to chemical shifts of methylene and methyl carbons, which are one more chemical bond further away from the hydrogen bond. However, it should be noted that the degree of hydrolysis of PVAc-9.3 (9.8%) is very close to that of PVAc-11 (9.9%), but according to NMR spectra in Fig. 1, there is an obvious difference in 13C chemical shifts of corresponding carbon sites in these two samples. A possible reason is that polymer chains in PVAc-11 are shorter than in PVAc-9.3 due to a higher degree of cleavage in the harsher alkaline conditions.26,27 Shorter chains have a higher mobility due to a less prominent entanglement effect in polymers,28 that promotes the formation of a larger number of hydrogen bonds in PVAc-11 compared with PVAc-9.3, even though they have a similar degree of hydrolysis.
O⋯H–O, respectively,25 and chemical shifts of these carbon sites are obviously more affected by hydrogen bonding compared to chemical shifts of methylene and methyl carbons, which are one more chemical bond further away from the hydrogen bond. However, it should be noted that the degree of hydrolysis of PVAc-9.3 (9.8%) is very close to that of PVAc-11 (9.9%), but according to NMR spectra in Fig. 1, there is an obvious difference in 13C chemical shifts of corresponding carbon sites in these two samples. A possible reason is that polymer chains in PVAc-11 are shorter than in PVAc-9.3 due to a higher degree of cleavage in the harsher alkaline conditions.26,27 Shorter chains have a higher mobility due to a less prominent entanglement effect in polymers,28 that promotes the formation of a larger number of hydrogen bonds in PVAc-11 compared with PVAc-9.3, even though they have a similar degree of hydrolysis.
To further investigate the crosslinking effects of borate additives, solid-state 11B MAS NMR spectra of dried borax powder and PVAc/borate materials were recorded and are illustrated in Fig. 2. From Fig. 2a, it can be seen that there are two types of boron sites present in the dried borax powder, one is tetra-coordinated boron [Bφ4] denoted in region A (approximately 1 ppm), and the other is tri-coordinated boron [Bφ3] shown in region B (approximately 15 ppm), where φ refers to either O or OH.29 In Fig. 2b, one can see that there are two new resonance lines in the PVAc/borate samples in addition to regions A and B, which is attributed to the crosslinked tetra-coordinated boron species (region C, approximately 5 ppm) and exchanging boron atoms between boric acid and borate ions (region D, approximately 10 ppm), consistent with previous reports.17
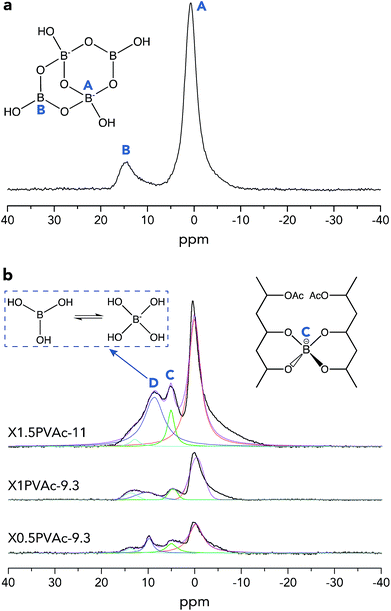 | ||
| Fig. 2 Single-pulse 11B MAS NMR spectra of a dried borax powder treated at pH 11 (a) and PVAc/borate films (b). The spectra of PVAc/borate were deconvoluted using Lorentzian functions. | ||
The basic theory of crosslinking by borax has been introduced in detail in our previous work.20 Here, the crosslinked borate fraction (fc) and the absolute crosslinked borate content (na) of each sample out of the total amount of added borax were estimated from the integrated areas of the corresponding resonance lines in the 11B MAS NMR spectra (Fig. 2b), and the results are tabulated in Table 3. We can see that fc of the sample X1PVAc-9.3 (9.6%) is lower than that for X0.5PVAc-9.3 (16.9%), which illustrates that the conversion efficiency from original borax to the crosslinked borate is reduced with an increase in borax content at a certain pH level. Conversely, na of X1PVAc-9.3 (1.0 × 10⁻⁵ mol) is still larger than that in X0.5PVAc-9.3 (8.9 × 10⁻⁶ mol) due to a larger amount of the added borax. We can speculate that the increase in na will decline gradually as borax content is further increased as a result of the decreasing conversion efficiency. In addition, fc of X1.5PVAc-11 (9.1%) is similar to that for X1PVAc-9.3 (9.6%), although the former sample contains more borax and na of X1.5PVAc-11 (1.5 × 10⁻⁵ mol) is the highest among the three samples in this study (see Table 3). Since the na is related to the total crosslinking degree of a PVAc/borate sample, it can be concluded that with an increase in borax content, the degree of crosslinking in the sample is increased but to a smaller extent at pH > 7; meanwhile, with an increase in pH, the degree of crosslinking in the sample at a constant borax content also increases. This conclusion is in accord with the results reported by Angelova et al.17
| Sample coding | fc (%) | na (mol) |
|---|---|---|
| X0.5PVAc-9.3 | 16.9 | 8.9 × 10⁻⁶ |
| X1PVAc-9.3 | 9.6 | 1.0 × 10⁻⁵ |
| X1.5PVAc-11 | 9.1 | 1.5 × 10⁻⁵ |
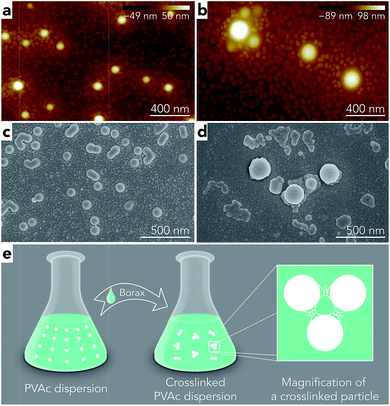
To further investigate the effect of borate additives on the morphology of PVAc, the particle size results from light scattering measurements performed by a Zetasizer are shown in Fig. 4. First, it can be seen that the sizes of the PVAc-9.3 (100 nm) and PVAc-11 (105 nm) particles are larger than the PVAc-4 (62 nm) particles, which can be attributed to the swelling behaviour of the particles in aqueous medium caused by the presence of more hydrolysed PVAc chains that contain a higher ionic strength and absorb more water molecules.31 With an increase in borax content, it is interesting to note that the size of the samples treated at pH 4 grows linearly. This is because the borax solution was added into the PVAc latex first, and then, the pH of the dispersion was adjusted during the sample preparation. Therefore, part of the PVAc particles may have already been crosslinked before the pH was tuned to 4. On the other hand, the particle size in the samples treated at pH 9.3 and 11 is also increased, but the rate of this increase is gradually reduced with a further increase in borax content. This is consistent with the 11B MAS NMR data (see Table 3), indicating that the degree of crosslinking in the sample follows the same trend under alkaline conditions, because the increased particle size is related to the crosslinking reaction, as explained in Fig. 3e.
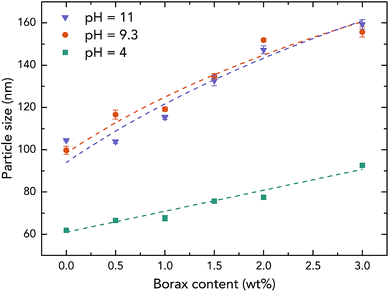 | ||
| Fig. 4 Particle size of the native PVAc and PVAc/borate latexes prepared with different borax content under various pH levels. | ||
However, it can be seen from Fig. 4 that the particle sizes of the samples at pH 9.3 are similar to those at pH 11, although, the samples treated at pH 11 have a larger degree of crosslinking. A possible reason for this is that crosslinking of the PVAc chains may occur within one particle instead of between several particles together that are combined.32 In addition, by comparing the results from microscopy (Fig. 3) and the light scattering measurements (Fig. 4), one can see that the diameters of particles in samples measured by AFM (horizontal size) and SEM are slightly larger than the particles tested by the Zetasizer. This is because the particles were deformed and became ellipsoids on the substrate during the sample preparation for microscopy due to a low glass transition temperature (close to room temperature) of the PVAc materials,33 and SEM samples have a tungsten coating layer (thickness is around 3 nm).
Characterization of properties
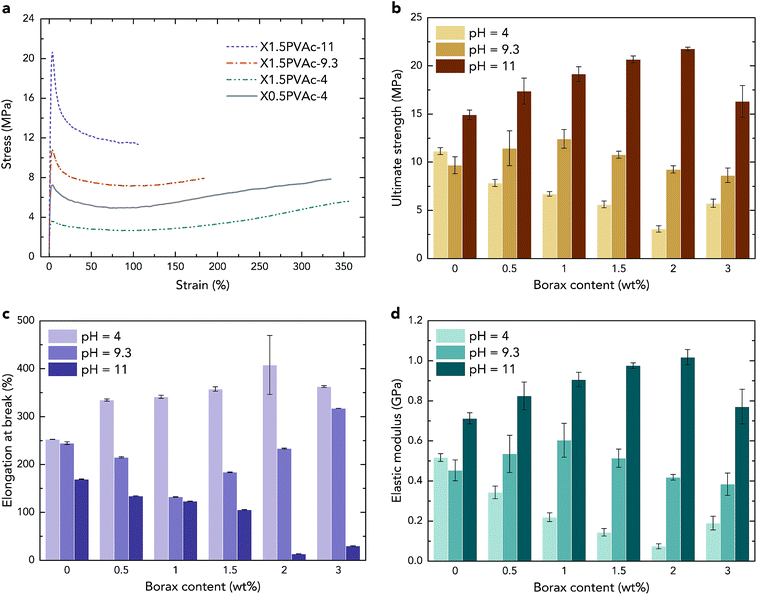
Consequently, in all PVAc/borate samples, both a crosslinker (tetra-coordinated borate ion) and a plasticizer (boric acid) are present, and they are “competing” with each other. At pH 4, the ultimate strength of the samples shown in Fig. 5b is reduced with an increase in borax content, except for the sample with 3 wt% borax. Although a small amount of PVAc was crosslinked as a result of the sample preparation, as described above, the strength of X3PVAc-4 is still much lower than that of PVAc-4 due to the plasticizing effect. It can also be seen in Fig. 5b that at pH 9.3, with an increase in borax content, the strength of the samples is enhanced and reaches the maximum at 1 wt% borax, and then, it drops down for the samples with >1 wt% borax. Similarly, at pH 11, the ultimate strength reaches the maximum at 2 wt% borax content and then decreases. This is also in accord with the NMR results showing that more borax molecules are converted to the tetra-coordinated borate ions at higher pH levels and form more crosslinks in the samples, providing a higher strength, but the conversion rate declines, and boric acid becomes dominant at high borax concentrations. The elastic modulus of the samples illustrated in Fig. 5d follows exactly the same trend as the ultimate strength, and the elongation at break (Fig. 5c) indicates the opposite trend, which further confirms the “competition” between the crosslinking and plasticizing effects in the samples.
Considering the mechanical properties of the native PVAc samples as reference materials, from Fig. 5b and d, it can be seen that both the strength and the elastic modulus of PVAc-9.3 are slightly lower than those for PVAc-4. A possible reason is that the molecular weight of PVAc is reduced with an increase in pH,26 which may lead to smaller entanglement of the polymer chains. However, PVAc-11 has a much larger strength and elastic modulus and a lower elongation at break (see in Fig. 5c) compared to those in PVAc-4 and PVAc-9.3. This could be due to a larger number of hydrogen bonds present in PVAc-11, in accord with the NMR data shown in Fig. 1.
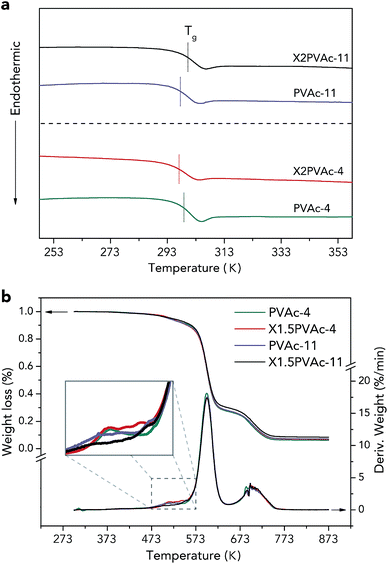 | ||
| Fig. 6 DSC 2nd heating-run thermograms (a) and TGA curves (b) of native PVAc and PVAc/borate films treated at pH 4 and 11. | ||
The thermal stabilities of the samples were characterized by TGA, and the results are demonstrated in Fig. 6b. The weight loss curves indicate that there are two main PVAc degradation steps: one occurs between 523 K and 623 K and represents deacetylation, and the other occurs between 633 K and 733 K and is caused by chain scission reactions.36,37 It can also be seen that X1.5PVAc-11 shows a higher stability, especially when the temperature exceeds 613 K, than all the other samples due to the crosslinking effect of borate additives. From the derivative weight loss curves, it is obvious that X1.5PVAc-11 starts to degrade at approximately 543 K, while the other samples start to degrade at approximately 493 K.
Conclusions
In summary, both crosslinking and plasticizing effects on PVAc can be provided by borate additives, and the conversion between them depends on the pH during sample preparation. The crosslinking effect dominates under alkaline conditions (pH > 7), and the formation of crosslinks in PVAc/borate materials is confirmed by solid-state 13C and 11B MAS NMR spectroscopy. An increase in the concentration of borate additives at pH 9.3 and 11 is correlated with an increase in the degree of crosslinking in PVAc, and the increase is reduced gradually, which leads to similar variation tendencies in the size of PVAc latex particles and the mechanical and thermal properties of the PVAc/borate films. Plasticizing effects may play a key role at pH 4, and consequently, the strength, elastic modulus, thermal properties and moisture resistance of the PVAc/borate films are reduced with an increase in borate additive content. Because borate additives have generally only been considered crosslinkers in materials, many impacts of these additives may be overlooked. This study provides a different perspective on borate additives.Acknowledgements
The authors would like to thank Dr Yvonne Aitomäki, Associate Prof. Aji P. Mathew, Dr Christos Nitsos and Prof. Ulrika Rova for technical assistance and valuable discussions. Financial support from the Wallenberg Wood Science Center and Kempe Foundation are greatly appreciated. A “Bruker” NMR spectrometer and Atomic Force Microscopy has been purchased from funds raised by the Kempe Foundation and Luleå University of Technology.Notes and references
- M. Amann and O. Minge, in Synthetic Biodegradable Polymers, Springer, 2012, pp. 137–172 Search PubMed.
- Y. H. Erbil, Vinyl acetate emulsion polymerization and copolymerization with acrylic monomers, CRC press, 2000 Search PubMed.
- Y. Wei, P. Liu, W.-J. Wang, B.-G. Li and S. Zhu, Polym. Chem., 2015, 6, 2837–2843 RSC.
- E. Bourgeat-Lami, J. Faucheu and A. Noël, Polym. Chem., 2015, 6, 5323–5357 RSC.
- A. Kaboorani and B. Riedl, Composites, Part A, 2011, 42, 1031–1039 CrossRef.
- A. Kaboorani, B. Riedl, P. Blanchet, M. Fellin, O. Hosseinaei and S. Wang, Eur. Polym. J., 2012, 48, 1829–1837 CrossRef CAS.
- M. W. Perrin, E. W. Fawcett, J. G. Paton and E. G. Williams, US Pat., 2,200,429, 1940.
- U. Khan, P. May, H. Porwal, K. Nawaz and J. N. Coleman, ACS Appl. Mater. Interfaces, 2013, 5, 1423–1428 CAS.
- A. P. Mathew, G. Gong, N. Bjorngrim, D. Wixe and K. Oksman, Polym. Eng. Sci., 2011, 51, 2136–2142 CAS.
- G. Gong, J. Pyo, A. P. Mathew and K. Oksman, Composites, Part A, 2011, 42, 1275–1282 CrossRef.
- G. Gong, A. P. Mathew and K. Oksman, Polym. Compos., 2011, 32, 1492–1498 CrossRef CAS.
- H. Ochiai, S. Fukushima, M. Fujikawa and H. Yamamura, Polym. J., 1976, 8, 131–133 CrossRef CAS.
- K. Das, D. Ray, N. Bandyopadhyay, A. Gupta, S. Sengupta, S. Sahoo, A. Mohanty and M. Misra, Ind. Eng. Chem. Res., 2010, 49, 2176–2185 CrossRef CAS.
- J. Han, T. Lei and Q. Wu, Cellulose, 2013, 20, 2947–2958 CrossRef CAS.
- S. H. Kim, K. Hyun, T. S. Moon, T. Mitsumata, J. S. Hong, K. H. Ahn and S. J. Lee, Polymer, 2005, 46, 7156–7163 CrossRef CAS.
- W. Liu, W. Zhang, X. Yu, G. Zhang and Z. Su, Polym. Chem., 2016, 7, 5749–5762 RSC.
- L. V. Angelova, P. Terech, I. Natali, L. Dei, E. Carretti and R. G. Weiss, Langmuir, 2011, 27, 11671–11682 CrossRef CAS PubMed.
- L. Angelova, M. Leskes, B. Berrie and R. Weiss, Soft Matter, 2015, 11, 5060–5066 RSC.
- I. Natali, E. Carretti, L. Angelova, P. Baglioni, R. G. Weiss and L. Dei, Langmuir, 2011, 27, 13226–13235 CrossRef CAS PubMed.
- S. Geng, M. M.-U. Haque and K. Oksman, Compos. Sci. Technol., 2016, 126, 35–42 CrossRef CAS.
- G. W. Barnett and T. T. Chen, US Pat., 4,812,510, 1989.
- C. R. Morcombe and K. W. Zilm, J. Magn. Reson., 2003, 162, 479–486 CrossRef CAS PubMed.
- J. G. Cook, Handbook of Textile Fibres: Natural Fibres, Elsevier, 1984 Search PubMed.
- N. Asakawa, S. Kuroki, H. Kurosu, I. Ando, A. Shoji and T. Ozaki, J. Am. Chem. Soc., 1992, 114, 3261–3265 CrossRef CAS.
- M. J. Sippl, G. Nemethy and H. A. Scheraga, J. Phys. Chem., 1984, 88, 6231–6233 CrossRef CAS.
- O. Wheeler, S. Ernst and R. Crozier, J. Polym. Sci., 1952, 8, 409–423 CrossRef CAS.
- C. Ho, A. Keller, J. Odell and R. Ottewill, Colloid Polym. Sci., 1993, 271, 469–479 CAS.
- W. W. Graessley, in The Entanglement Concept in Polymer Rheology, Springer, 1974, pp. 1–179 Search PubMed.
- B. Zhou, Z. Sun, Y. Yao and Y. Pan, Phys. Chem. Miner., 2012, 39, 363–372 CrossRef CAS.
- J.-S. Song and M. A. Winnik, Macromolecules, 2005, 38, 8300–8307 CrossRef CAS.
- E. Chatzi and C. Kiparissides, Chem. Eng. Sci., 1994, 49, 5039–5052 CrossRef CAS.
- Y. G. Durant, E. J. Sundberg and D. C. Sundberg, Macromolecules, 1997, 30, 1028–1032 CrossRef CAS.
- D. Vrsaljko, M. Leskovac, S. L. Blagojević and V. Kovačević, Polym. Eng. Sci., 2008, 48, 1931–1938 CAS.
- P. S. Columbus, US Pat., 06/074,005, 1981.
- M. G. A. Vieira, M. A. da Silva, L. O. dos Santos and M. M. Beppu, Eur. Polym. J., 2011, 47, 254–263 CrossRef CAS.
- B. Rimez, H. Rahier, G. Van Assche, T. Artoos, M. Biesemans and B. Van Mele, Polym. Degrad. Stab., 2008, 93, 800–810 CrossRef CAS.
- M. Pracella, M. M.-U. Haque and D. Puglia, Polymer, 2014, 55, 3720–3728 CrossRef CAS.
- R. W. Korsmeyer and N. A. Peppas, J. Membr. Sci., 1981, 9, 211–227 CrossRef CAS.
- N. Gontard, S. Guilbert and J. L. Cuq, J. Food Sci., 1993, 58, 206–211 CrossRef CAS.
- R. S. Mahendran, Characterisation of cross-linking and moisture ingress detection in an epoxy/amine resin using fibre-optic sensors, University of Birmingham, 2010 Search PubMed.
Footnote |
| † Electronic supplementary information (ESI) available: 1H NMR spectra of PVAc-4, PVAc-9.3 and PVAc-11 in DMSO-d6; equation for calculation of PVAc hydrolysis degree; 13C NMR spectra of PVAc-4, PVAc-9.3 and PVAc-11 in DMSO-d6; solid-state 13C CP-MAS NMR spectra of PVAc-4, PVAc-9.3 and PVAc-11; and toughness of each sample. See DOI: 10.1039/c6ra28574k |
| This journal is © The Royal Society of Chemistry 2017 |

