 Open Access Article
Creative Commons Attribution 3.0 Unported Licence
L-Cysteine electrooxidation in alkaline and acidic media: a combined spectroelectrochemical and computational study†
André H. B. Douradoa,
Ana P. de Lima Batista b,
Antonio G. S. Oliveira-Filho
 b,
Paulo T. A. Sumodjo‡
a and
Susana I. Cordoba de Torresi
 *a
*a
aDepartamento de Química Fundamental, Instituto de Química, Universidade de São Paulo, Av. Prof. Lineu Prestes, 748, 05508-000 São Paulo, SP, Brazil. E-mail: storresi@iq.usp.br
bDepartamento de Química, Faculdade de Filosofia, Ciências e Letras de Ribeirão Preto, Universidade de São Paulo, Ribeirão Preto, SP 14040-901, Brazil
First published on 23rd January 2017
Abstract
Due to the numerous possible oxidation states of sulfur, L-cysteine and L-cystine are very important amino acids that are utilized to understand the adsorption and redox activity of proteins and peptides. Therefore, the study of the adsorption/oxidation of these molecules can be used as a model system to understand protein behaviour. The aim of the present communication is to study this adsorption/oxidation process by infrared spectroscopy and DFT/PBE-D3/def2-SVP/COSMO (water) calculations. A bridge geometry (S bonded to two Pt atoms) was found to be the chemical adsorption link formed, and experimental data corroborate the DFT predictions. For both species, the surface–carboxyl group interaction is stronger at lower pH values, and the conformations of the adsorbed species were found to be dependent on the pH, with the amino group getting closer to the surface along with increases in the electrolyte alkalinity. The oxidation study was also performed at different pH values, and a Kolbe decarboxylation was found to be a side reaction at every pH, being more important in strong acidic solutions. Sulfur-containing adsorbed oxidized species were inferred based on the optimized structures of the adsorbed/desorbed species. A complex oxidation mechanism is proposed here, and species, such as sulfoxide, adsorbed sulfoxide, sulfenic and sulfinic acids and adsorbed sulfone, are suggested as intermediates in the oxidation of L-cysteine to sulfonic acid.
1. Introduction
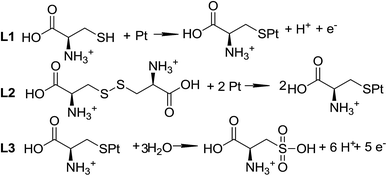
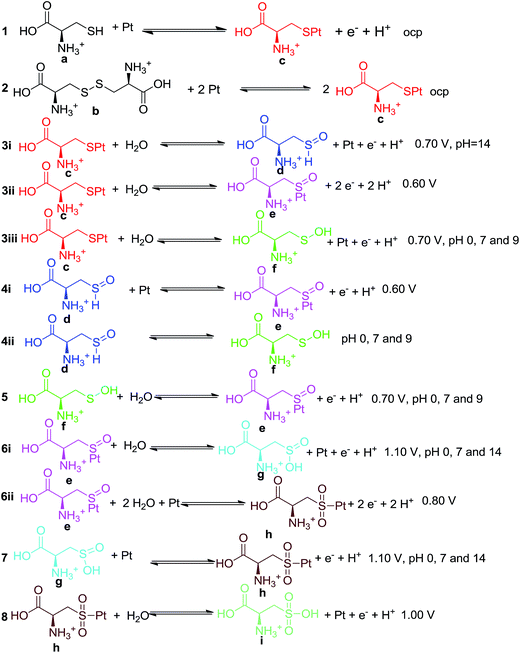
L-Cysteine (L-Cys) and L-cystine (L-Cys2) have attracted attention for a long time1–3 due to their importance as model molecules for enhancing the understanding of the redox activity of peptides and proteins.4,5 However, there are still several aspects concerning the electron transfer reactions of these molecules, with potential interest in biological systems,5 that need clarification and further investigation.The reactions for the adsorption and oxidation of cysteine on solid electrodes, based on the known reactivity of alkanethiols, are displayed in Scheme 1. The proposed mechanism6 is supported by classical electrochemical techniques,1,2,5,7–11 such as cyclic voltammetry,1,2,5,7–9 step potential11 and only a few spectroscopic experiments.3 It is not completely accepted because there is some controversy regarding the oxidation state of the products and the number of electrons involved in each step of the oxidation reaction. For instance, Enache et al.5 and Feliciano-Ramos et al.10 suggest the presence of intermediates that are not adsorbed onto the electrode surface, such as sulfenic and sulfinic acids5 and desorbed sulfone;10 while other authors2 note the occurrence of other adsorbed intermediates, such as sulfone species.
To elucidate the chemistry of L-Cys and L-Cys2 on metallic electrodes, a combination of techniques that includes spectroscopic and computational approaches have been employed.12–20 Among these, we highlight the use of surface-enhanced Raman spectroscopy (SERS)12,13 and surface-enhanced second-harmonic generation (SESHG)16 measurements to determine the orientation of L-Cys molecules adsorbed on a silver electrode and the use of density functional theory (DFT) calculations to investigate the adsorption of L-Cys onto both Au(111)19,20 and Ag(111).15–18
In this work, we report an investigation of the interaction between L-cysteine, and its oxidation products, with a platinum electrode, in acidic and alkaline media. Spectroelectrochemical experiments in the infrared region (Infrared Reflection Absorption Spectroscopy – IRRAS) and DFT calculations were employed to explore the reaction intermediates of L-Cys and L-Cys2 oxidation to contribute to the understanding and elucidation of the electrooxidation process of these molecules.
2. Experimental details
L-Cysteine and L-cystine (Sigma-Aldrich) were used without further purification. The following electrolytic solutions were used: H2SO4 0.50 mol L−1, Na2SO4 0.50 mol L−1 and NaOH 0.50 mol L−1. L-Cys was used in 0.1 mol L−1, while L-Cys2 in saturated solution (0.5 × 10⁻³ mol L−1). The pH of the neutral solution was adjusted by the addition of NaOH and/or H2SO4 for the intermediate values. Milli-Q water was used for preparing all solutions, all experiments were handled at room temperature, and N2 was bubbled for an O2 free solution.A Thermo-Nicolet 6700 FTIR spectrometer (gain 4, 0.6329 optical velocity, 4 cm−1 resolution, 98 accumulations, 59.49 s per measurement) coupled with an Autolab potentiostat/galvanostat (AUT85732) was used for the spectroelectrochemical experiments. A thin layer electrochemical cell with a ZnSe window was used, with pathlength around 0.072 cm (estimated by b = n/(2Δν), with b as pathlength, n the number of fringes and Δν the wavelength range). A Pt disk (5 mm radius) was used as the working electrode. A Pt grid and an Ag|AgCl (KClsat) were used as the auxiliary and the reference electrodes, respectively. The working electrode was polished using alumina (3 and 0.5 μm) and chemically cleaned by piranha solution (4![[thin space (1/6-em)]](https://www.rsc.org/images/entities/char_2009.gif) :
:![[thin space (1/6-em)]](https://www.rsc.org/images/entities/char_2009.gif) 1 v/v H2SO2
1 v/v H2SO2![[thin space (1/6-em)]](https://www.rsc.org/images/entities/char_2009.gif) :
:![[thin space (1/6-em)]](https://www.rsc.org/images/entities/char_2009.gif) H2O2). The cell, Luggin capillary and counter electrode were also cleaned in piranha solution 20 hours before the measurements.
H2O2). The cell, Luggin capillary and counter electrode were also cleaned in piranha solution 20 hours before the measurements.
For electrochemical measurements, the electrode was placed in the thin layer cell, wait for the adsorption process to occur, while spectra were accumulated, and then polarized to more positive potential values. After each potential, the electrode was taken from the solution and cleaned in piranha solution again. While this procedure was performed, the cell was purged with N2. After, the electrode was inserted in the cell again and the adsorption/polarization procedure was performed for a more positive potential. This protocol was used to assure the absence of atmospheric gases, as O2 and CO2, since the use of just one process for all potential values should take a long time, which could contaminate the solution.
3. Theoretical approach
3.1 Computational methods
All computational calculations were performed using the ORCA program package (version 3.0.3).21 The conductor-like screening model (COSMO)22 was used to simulate water (ε = 80.4) solvation effects. Energies, frequencies and geometric parameters were obtained with the PBE23 density functional in conjunction with the resolution-of-the-identity (RI) approximation.24 To take into account dispersion effects, Grimme's dispersion (D3) correction25,26 with the Becke–Johnson (BJ) damping parameter27 was considered. The PBE density functional was chosen because it has been broadly used in studies involving Pt surfaces. In the explored potential energy surfaces (PES), all the structures were characterized as minima presenting only non-imaginary frequencies.The Ahlrichs def2-SVP28,29 basis set was employed for all atoms, and an effective core potential (ECP) (SD(60, MWB))30 and matching basis sets were used for the Pt atoms all throughout this work. The def2-SVP/J Coulomb fitting basis was applied for the resolution of identity.31,32 The present level of theory is referred to as DFT/PBE-D3/def2-SVP/COSMO (water) throughout this work.
3.2 Molecular cluster models
The purpose of these calculations is to identify potential structures for the L-Cys and L-Cys2 molecules, and their oxidized forms, adsorbed on the Pt electrode surface. The first step towards this goal consists in the selection of a ideal Pt surface model. In broad terms, there are two ways to model surfaces and the interaction between surfaces and molecules: the slab and the cluster models.33 In this study, we use the cluster model. It is worth to mention that cluster models might be subject to the following limitations: the coverage effect, as a single molecule interacts with the surface; the edge effects, as a small cluster may not represent the structure of the bulk, especially around the edges; and the charge effects, as in a cluster there is a small number of atoms, compared to the bulk, to delocalize the charge. For examples of the use of slab models, please see ref. 34–38.The use of models that include a finite number of atoms allows the description of local electronic properties. A molecular cluster with 20 Pt atoms as displayed in Fig. 1 modelled the electrode surface. This cluster was used by Daramola and Botte39 to investigate NH3 adsorption on the Pt(111) surface and by Dhar and Cavallotti40 in the study of the electrochemical reduction of carbon dioxide on Pt electrodes. To avoid edge effects, only the Pt atoms in the first layer were allowed to relax during the optimizations (Fig. 1a), while the Pt atoms in the second and third layers had their positions fixed. In the ground state, which is the electronic state considered in the current investigation, this cluster is neutral and its spin multiplicity is 15.39 Considering the Wigner–Witmer rules for spin coupling, the allowed multiplicities for the electronic states of a supermolecule formed by the Pt20 cluster (with spin multiplicity 15) and the cysteine radical, and its derivatives, (with spin multiplicity 2) are 14 and 16. As the chemisorption of cysteine and its derivatives on the Pt surface is effective with the paring of electrons on a bonding orbital, the spin multiplicity of the electronic state investigated in our work is 14. As the reaction proceeds adiabatically on this electronic state, all bonded structures also correspond to electronic states with spin multiplicity 14.
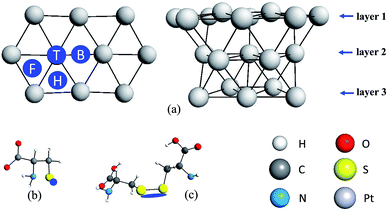 | ||
| Fig. 1 The Pt cluster and its interaction with L-Cys and L-Cys2 systems. The sites on the surface and the interacting region of the molecule are highlighted in dark blue. | ||
The adsorption of L-Cys was investigated with the molecule in a radical form, without the hydrogen atom of the thiol group. The sulfur atom was placed near the Pt surface in four different positions. The different interaction sites, depicted in Fig. 1a, are labelled top (T), bridge (B), face-centred cubic (F) and hexagonal close-packed (H) positions. For each one of these sites, the L-Cys radical is parallel to the surface, i.e., in a prone position, as displayed in Fig. 1b. This conformation provides extended contact between the Pt surface and the L-Cys functional groups, thus yielding a more stabilized structure when compared to a conformation that is perpendicular to the surface.
The study of the possible protonated, unprotonated, neutral, and oxidized forms of the L-Cys molecule on the Pt cluster were carried out only at the most energetically favoured adsorption site, the bridge position. Protonated and unprotonated forms of the L-Cys–Pt systems are potential structures in acidic and alkaline media, respectively. A neutral species, however, should be present at a pH close to its neutral value. For the L-Cys2 system, the S–S moiety, which is the interacting part of this dimer and, as indicated in Fig. 1c, was placed nearby the bridge position of the Pt cluster prior to the geometry optimization calculation.
4. Results and discussion
4.1 1-Protonated, unprotonated and neutral forms of the L-Cys and L-Cys2 systems
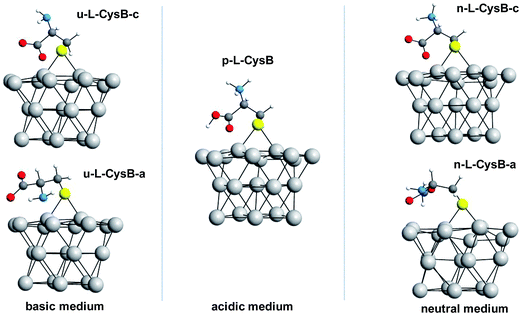
By exploring the L-Cys adsorption at the sites T, B, F and H of the Pt surface, we found that the radical form of the L-Cys molecule adsorbs preferably at the bridge position (B site) on the Pt surface. From now on, the explored forms of L-Cys adsorbed on this site will be referred as L-CysB. Protonated (p-L-CysB), neutral (n-L-CysB) and unprotonated (u-L-CysB) structures were explored.For each one of these, two different conformations were analysed. The first conformation presents the carboxylate moiety close to the surface and the second one shows the carboxylic group away from the surface, they are identified by the letters c and a, respectively. Fig. 2 shows all these optimized structures. For the protonated system, p-L-CysB, only one conformation was found as a minimum in the explored potential energy surface. The attempt to identify a p-L-CysB conformation with the carboxylic group away from the surface lead to the same structure that the optimization with the carboxylic group near the surface.
For the unprotonated conformations of L-Cys, u-L-CysB-a and u-L-CysB-c, the u-L-CysB-a system is lower in energy than u-L-CysB-c by approximately 22.6 kcal mol−1. In Fig. 2, it can be observed that this former conformation allows both the NH2 and COO− groups to interact with the Pt surface, which explains such stabilization. However, for the neutral structures n-L-CysB-a and n-L-CysB-c, the conformation with both functional groups close to the metal surface does not provide the same stabilization. The system n-L-CysB-c, in which the COO− moiety interacts better with the surface, is lower in energy by 20.7 kcal mol−1 than n-L-CysB-a. By comparing n-L-CysB-a and u-L-CysB-a, in Fig. 2, it can be noted that the protonated NH3+ group in n-L-CysB-a does not interact in the same way with the surface as does the NH2 group in u-L-CysB-a. The protonated p-L-CysB system, as shown in Fig. 2, adopts a structure where the COOH group is closer to the metal surface.
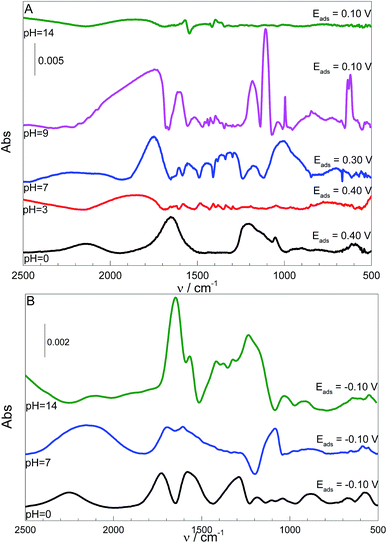
The theoretical results are supported by the IR spectra shown in Fig. 3, where the L-Cys adsorption on the Pt surface was accomplished over a range of pH values.
Table 1 lists the computed vibrational frequencies and the assignments of the structures presented in Fig. 2 and the observed vibrational bands related to the adsorbed L-Cys at different pH values, as shown in Fig. 3.
| Assignment | Calculated frequencies/cm−1 | Observed frequencies/cm−1 | ||||||
|---|---|---|---|---|---|---|---|---|
| p-L-CysB | n-L-CysB-c | u-L-CysB-a | pH | |||||
| 0 | 3 | 7 | 9 | 14 | ||||
| νC–S(ads) | 595–644 | 650 | 621 | 551–667 | 595–830 | 615–780 | 630 | 668–875 |
| νC–S(ads) + δCS–CH2 | 744 | 811 | 776–798 | 722–840 | 849 | 915(shoulder) | 650–942 | 774 |
| δNH2 | 1015 | 1119 | 960 | 1008 | 995 | 1000 | ||
| δCOO(H)⋯Pt | 1364 | 1260 | 1222 | 1213 | 1160–1270 | 1290 | ||
| Scissoring δNH2/NH3 | 1543 | 1506 | 1512 | 1481 | 1550 | 1515 | 1460 | |
νC![[double bond, length as m-dash]](https://www.rsc.org/images/entities/char_e001.gif) O O |
1682 | 1660 | 1674 | 1613 | 1606 | 1570 | ||
| νCOO(assym) | 1674 | 1580 | 1545 | |||||
According to the data in Table 1 and the IR spectra in Fig. 3A, the bands related to the carboxylic group are more prominent at pH 0, while the N–H bending mode is not observed. Therefore, the p-L-CysB structure, which was also predicted by borrowing the SERS41 technique, is supported. The p-L-CysB system, however, is distinct from previous proposals related to Au19,20 and Ag13,15,16 experiments performed in similar conditions. These last surfaces are protonated systems with the amino group closer to the surface. Such a difference is based on the high affinity of the Pt electrode for H atoms, which are more acidic while bonding to the O atom than the N atom.
The carboxylic acid group is deprotonated (pKa1 = 1.71)42 as the pH increases. The IR spectra in Fig. 3A show the appearance of bands related to the amine group (960–1008, 1460–1550 cm−1) together with the intensity diminution of carboxylate bands (1213–1290, 1570–1613, 1545–1580 cm−1). Spectra taken at pH 3 and 7 show the similar bands, but the spectrum taken at pH 7 is significantly more intense than that at pH 3. The band observed in the pH 0 spectrum at 1213 cm−1 and attributed to the vibration related to carboxyl–H–Pt group can also be observed at pH 3 and 7 but as an enlargement of the band located between 1160 and 1270 cm−1 for pH 3 and a single band at 1290 cm−1 at pH 7. This shift in wavenumber can be related to differences in the force constant of the vibrations. The calculations indicated a shift in the opposite direction but, it must be noted that the calculations did not consider the contribution of H(ads) derived from the solution, just from L-Cys. This species can interfere with the spectra in two ways, one as a competitive adsorption, what justify the low intensity of the spectrum at pH 3, and because of the lower H+ concentration at pH 7, it allows a higher adsorption of L-Cys. The second way would be as the possibility of carboxyl–H–Pt group interaction, even when the L-Cys in solution is already deprotonated, and making possible the observation of the vibration of this group closer than the calculated to p-L-CysB than to n-L-CysB-a or -c.
The n-L-CysB-c calculated structure, which has lower energy, can explain the experimental results better than n-L-CysB-a since the former indicates a higher presence of horizontal vibrations, that could not be observed in a surface spectroscopic technique.43,44 All adsorption procedures were performed at open circuit potential (ocp), due to the spontaneity of the thiol adsorption. The difference between their ocp values is not very important (ΔE = 0.10 V), and can be related with the shift of the potential window of the electrode due the pH variation (ΔE ≅ 0.10 V, estimated by Nernst equation).
At pH 9, with the thiol group is deprotonated (pKa2 = 8.53,42 meaning 3[thiolate]/[thiol]), the spectrum is quite different. It is already known that the nucleophilic character of the thiolate species is higher than the protonated one, and the ocp value changes (ΔE = 0.30 V) to a higher extent than the shift observed at pH 0; thus, the deprotonation could also justify a higher affinity between the thiolate species and the surface. The observed bands can be explained by a structure similar to n-L-CysB-c, which is quite expected. Since the protonation states of the carboxyl and amino groups remain the same, the only possible difference between these two situations could be that at pH 9 the molecule can be more twisted, positioning the carboxylate closer to the surface, and consequently more vertical, leading to the increase of carboxyl related bands observed at this condition. This twisted geometry makes sense if one takes into consideration the activity increase of the starting molecule, a fact that due the Frumkin model behaviour of adsorption,9,41 would be followed by some rearrangement of the adsorbed species, making possible to decrease the repulsion between adsorbed and solution species, allowing a higher surface coverage.
At pH 14, L-Cys is fully deprotonated (pKa3 = 10.36),42 the u-L-CysB-a and u-L-CysB-c systems should provide a realistic picture of the structures adsorbed on the Pt surface. At this pH, the coverage of the surface should be low since the absorbance is much lower than for the other pH values. Additionally, at this condition, the contribution of COO− almost vanished; thus, a structure with the –NH2 closer to the surface and a laid-down carboxyl can be expected. Additionally, this kind of behaviour can be expected for structures similar to u-L-CysB-a.
Others bands can be observed, at 1054, 1047, 1178 and 1040 cm−1, from pH 0 to 9, could be related to sulphate (SO42−) stretching bands. Additionally, the ones at 1653, 1850, 1749, 1753 and 1856 cm−1, from pH 0 to 14, must be related to water bending. That appears even with the background subtraction, due to a rearrangement of water molecules close to the electrode surface, resulting in changes in its intensity due the surface spectroscopy selection rules.43,44
Focusing on L-Cys2 species, a similar analysis was performed. The DFT/PBE-D3/def2-SVP/COSMO (water) optimizations carried out for the L-Cys2 system, as described in Section 3.2 and shown in Fig. 1. Fig. 3B shows the IR spectra for the L-Cys2 adsorption. According to Watanabe's work,12 species containing a Pt–S(R)–S–R moiety are expected in this kind of experiment. However, the current calculations and IR spectra suggest that the adsorption can lead to dissociation of the S–S bond.
Considering the spectra displayed in Fig. 3B and the assignments given in Table 2, one can expect that the adsorption experiment using L-Cys2 as the reactant yields similar adsorbed structures to those shown in Fig. 2 for the L-Cys system, would be as follows: p-L-CysB for pH 0, n-L-CysB-a for pH 7 and u-L-CysB-c for pH 14. The bands related to the electrolyte were found at 888, 1085 and 1200 (negative) cm−1 (pH 0, 7 and 14), while the water related ones at 1728, 1700 and 1648 cm−1 (pH 0, 7 and 14).
| Assignment | Observed frequencies/cm−1 | ||
|---|---|---|---|
| pH | |||
| 0 | 7 | 14 | |
| νC–S(ads) | 571 | 590 | 581–760 |
| νC–S(ads) + δCS–CH2 | 794–1016 | 916 | |
| δNH2 | 794–1016 | 1032 | |
| δCOO(H)⋯Pt | 1289 | ||
| Scissoring δNH(3)2 | 1606 | 1569 | |
νC![[double bond, length as m-dash]](https://www.rsc.org/images/entities/char_e001.gif) O O |
|||
| νCOO(assym) | 1579 | ||
The vibrational band related to the C–S bond stretching is dependent on the conformation of the adsorbed molecules (as listed in Table 1) as follows: lower frequency values should be observed for the fully protonated species, p-L-CysB, and higher ones for the neutral structure, n-L-Cys-c. For all pH values, the observed band was found to be large and the band is displaced to higher wavenumbers in alkaline media. The contribution of the amino group vibrations also becomes more important under these conditions. This pattern is observed for experiments using both L-Cys and L-Cys2.
4.2 Electrooxidation and oxidized L-Cys structures
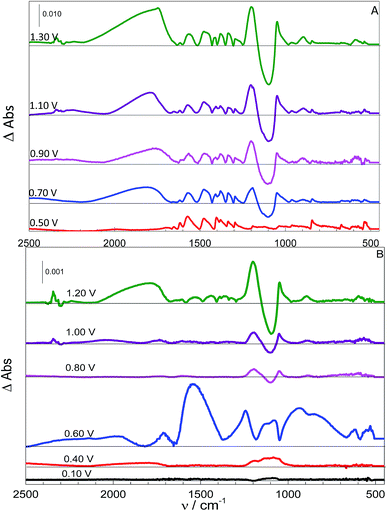
Following the adsorption procedure, the potential was switched to more positive values with each spectrum taken after the current reached a constant value. In the sequence, the electrochemical system was turned off and the working electrode was inserted in a piranha solution during 20 min for chemical cleaning. At the same time, the electrolytic solution was purged with N2. To observe spectra corresponding to more positive potentials, the adsorption procedure was repeated, followed by the application of a more positive potential, and then the spectra were recorded. The adsorption spectra were subtracted from those taken at different potentials. Fig. 4 shows a set of these spectra for the systems using L-Cys (A) and L-Cys2 (B) as reactants, obtained at pH 7. Results obtained at other pH values are given as ESI.†The experiments conducted with systems A and B indicate that the beginning of the oxidation is followed by the decrease of the SO42− band (approximately 1100 cm−1), that became a negative band, and the rise of the well-known HSO4− bands (approximately 1000 and 1250 cm−1). The presence of this species can be explained by the oxidation of the organic molecules at the surface of the electrode and this process would generate H+ in the interface, responsible for the decrease of the interfacial pH and the generation of HSO4−. This behaviour started approximately 0.60 and 0.70 V, depending on the pH, for both molecules, which is in agreement with that expected from the literature for the beginning of the oxidation of these molecules.9
Fig. 4 also shows bands approximately 2300 cm−1 for the highest potential applied that can be related to the presence of CO2. It is worth mentioning that after each applied oxidation potential the system was purged, just to assure the absence of any significant amount of CO2. This procedure is quite efficient since all experiments were performed until the same final time and those bands were not observed at more negative potentials, suggesting that this time is not enough to obtain CO2 transported to the pathlength. The fact that this band only appears at high potentials, combined with the decrease of –COO− bands, that become negative bands in some cases, indicates that the adsorbed molecules are decarboxylated via a Kolbe reaction;45,46 this process can be observed for the oxidation of oxygenated molecules at high overpotentials. This side reaction is favoured under conditions where the carboxyl group is unprotonated,45,46 and since the pKa of this organic function is 1.71,42 this is not expected to be observed at pH = 0. However, the CO2 bands are present even when the carboxylate group should be protonated (spectra for acidic pH are given in the ESI†). This apparent contradiction can be reconciled if we consider the proposed adsorbed structures of p-L-CysB, given in Fig. 2. The most stable structure for adsorbed L-Cys in an acidic medium corresponds to a conformation in which the –COOH group is close to the surface. The interaction between the acidic hydrogen and the electrode surface weakens the O–H bond. As the Kolbe reaction45 proceeds by an inner sphere electron transfer, involving a –COO–M bond, it would be most favourable for structures with a carboxylic group close to the surface, thus facilitating the process. These two facts can explain why this side reaction is more expressive at lower pH values. In addition, they justify the negligible formation of CO2 at higher pH values (9 or 14).
Furthermore, we carried out DFT/PBE-D3/def2-SVP/COSMO (water) calculations of potentially oxidized structures of the adsorbed L-Cys. Oxidized structures of u-L-CysB-a, n-L-CysB-c and p-L-CysB were investigated; the optimized structures are shown in Fig. 5. We noted that u-L-CysB-a and n-L-CysB-c are the most stable forms of u-L-CysB and n-L-CysB conformations, while for the p-L-CysB species only one minimum was found. Two different adsorbed oxidized forms were considered for u-L-CysB-a, n-L-CysB-c and p-L-CysB species as follows: the adsorbed sulfoxide (Ox1) and sulfone (Ox2) structures.
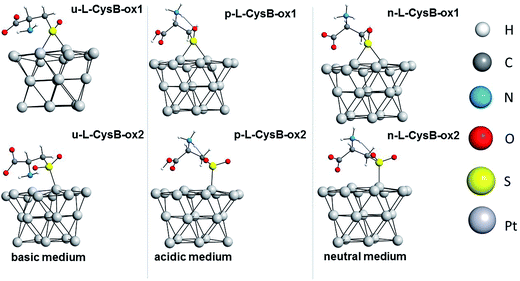 | ||
| Fig. 5 Optimized structures of the oxidized forms, Ox1 and Ox2, for u-L-CysB-a, n-L-CysB-c and p-L-CysB species. | ||
Guided by the experimental evidence present in the current investigation, the desorbed species, sulfenic acid (a), sulfoxide (b), sulfinic acid (c), sulfone (d) and sulfonic acid (e) were also explored at the DFT/PBE-D3/def2-SVP/COSMO (water) level of theory. Their optimized geometries are presented in Fig. 6.
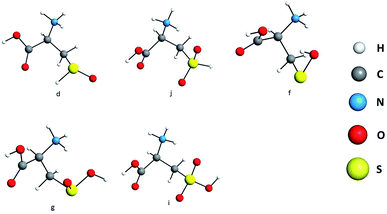 | ||
| Fig. 6 Optimized structures of desorbed oxidized species considered in the current investigation: sulfoxide (d), sulfone (j), sulfenic acid (f), sulfinic acid (g), and sulfonic acid (i). | ||
The identification of the oxidized species followed the same strategy applied for the adsorbed structures; the experimental bands were compared with the calculated ones. Based on our experimental evidence, Table 3 lists the free and adsorbed organic species that are assumed to be present, their calculated vibrational frequencies, their experimental ones and the experimental conditions in which they were found (pH and potential).
| Molecule | Assignment | Calculated frequencies/cm−1 | Observed frequencies/cm−1 | pH | E/V | Reactant |
|---|---|---|---|---|---|---|
| p-L-CysB | νC–S | 595–644 | 535–648 | 0 | All | L-Cys2 |
| n-L-CysB-c | 650 | 623–675 | 3, 7, 9 | 0.50 | L-Cys | |
| u-L-CysB-a | 621 | 588 | 14 | All | L-Cys2 | |
| Ox1 | νC–S | 631 | 630–670 | 0 | 0.60–0.8 | L-Cys/L-Cys2 |
| 594, 627 | 620–680 | 7, 9 | 0.60–1.10 | L-Cys/L-Cys2 | ||
νS![[double bond, length as m-dash]](https://www.rsc.org/images/entities/char_e001.gif) O O |
969 | 963–970 | 0 | 0.80–1.20 | L-Cys/L-Cys2 | |
| 974 | 960–966 | 7, 9 | 0.70–1.20 | L-Cys | ||
| d | νC–S | 657–750 | 628–700 | 7, 9, 14 | 0.70–1.10 | L-Cys/L-Cys2 |
νS![[double bond, length as m-dash]](https://www.rsc.org/images/entities/char_e001.gif) O O |
1027 | 1044–1049 | 0–14 | 1.00–1.10 | L-Cys/L-Cys2 | |
| νS–H | 2360 | 2166–2170 | 14 | 1.10–1.30 | L-Cys/L-Cys2 | |
| Ox2 | νC–S | 637 | 595–673 | 0 | 0.80–1.00 | L-Cys/L-Cys2 |
| 616–849 | 670 | 7, 9 | 0.90–1.10 | L-Cys/L-Cys2 | ||
| 630, 787–852 | 525–850 | 14 | 1.00–1.10 | L-Cys/L-Cys2 | ||
| ν(sym)SO2 | 953 | 963–968 | 0 | 0.80–1.00 | L-Cys/L-Cys2 | |
| 961 | 960–970 | 3, 7, 9 | 0.80–1.00 | L-Cys/L-Cys2 | ||
| 852 | 825–958 | 14 | 1.00–1.10 | L-Cys/L-Cys2 | ||
| ν(assym)SO2 | 1122 | 1135–1137 | 0 | 0.80–1.00 | L-Cys/L-Cys2 | |
| 1110 | 1103 | 14 | 0.80–1.00 | L-Cys/L-Cys2 | ||
| i | νS–OH | 800 | 840–890 | 0–9 | 1.00–1.30 | L-Cys/L-Cys2 |
| 825–958 | 14 | 1.10–1.30 | L-Cys/L-Cys2 | |||
| δSOH | 1038 | 1040 | 0 | 1.00–1.20 | L-Cys/L-Cys2 | |
| ν(sym)SO2 | 1106 | 1130–1135 | 0, 7 | 1.00–1.30 | L-Cys | |
| ν(assym)SO2 | 1292 | 1292–1336 | 0–14 | 1.00–1.31 | L-Cys/L-Cys2 |
The existence of desorbed species in acidic media at potentials more positive than 0.80 V was already proposed in an earlier publication.41 Based on the results presented in Table 3, the assumption of potently free species is quite feasible. It is possible to verify that the groups related to desorbed oxidized species were found only at more positive potentials at acid media. This behaviour is also observed under other pH conditions.
Considering the species detected by the spectroscopic measurements (Fig. 4, Table 3) and the DFT results presented during the previously sections, the mechanism in Scheme 2 is presented. Some of the species listed in Scheme 2, such as the adsorbed sulfone, were previously mentioned in the literature2 but without any spectroscopic evidence.
From Table 3, it can be inferred that bands that can be related to sulfoxide groups are present using both reactants when the pH was high. The thiol S–H bond is not expected to be observed at such alkaline pH values; thus, a functionality, such as sulfoxide, that presents an oxygen atom also bonded to the sulfur and is expected to be more acidic; therefore, it would be more likely to observe other species that are known to be more stable,47 such as sulfenic acid (f), but only one band that could be related to the SOH angular deformation was observed (846 cm−1 at 0.80 V and pH 3, 845 cm−1 at 0.70 V and 836 cm−1 at 0.90 V at pH 7, 839 cm−1 at both 0.70 and 0.90 V at pH 9). The f species can be formed from sulfoxide (d) by isomerization (Scheme 2), but as ex situ techniques are not able to detect such systems, its disproportionation is more likely. Only one band is observed that would be related to f instead of two bands, as presented in Table 3. This acid was already suggested as an intermediate by Oliveira-Brett5 but using a different system. Another suggested intermediate is the sulfinic acid (g), which could be related to one band (1135 cm−1 at 1.00 V and 1140 cm−1 at 1.20 V at pH 0, 1130 cm−1 at 1.10 V and pH 7, related to δSOH and 1010 cm−1 at 0.70 V and pH 14, related to νS![[double bond, length as m-dash]](https://www.rsc.org/images/entities/char_e001.gif) O).
O).
Each step presented in Scheme 2 is followed by the potential applied to the system when the bands started to be noticed; in the cases where some bands were found only under special pH conditions, those are also highlighted. Consequences of this procedure are empirical suggestions regarding to the energetics of each step. Steps 3i, 3ii and 3iii are expected to be in competition. The generation of sulfoxide, possibly related to three bands at pH 14 and more probable to occur at this condition, can be found in competition with the sulfenic acid and the adsorbed sulfoxide. The sulfenic acid is more stable than the sulfoxide as already stated, and they can also be involved in the equilibrium of isomerization (4ii). The adsorbed sulfoxide was frequently found in these measurements; therefore, 3ii is expected to be always present, while the others apparently only appear at specified pH conditions.
Other steps that would compete are 6i and 6ii, both of which involve oxidized adsorbed sulfoxide species. Step 6i seems to be less effective than 6ii since the bands assumed to be related to adsorbed sulfone are observed over 0.80 V in all pH values.
The desorbed sulfone, suggested for a Pd electrocatalyst10 was not detected in the Pt electrode studies.
The presence of a band assigned to the thiol function vibration (νS–H expected to be at 915 cm−1) was found at almost all pH values for the system with the L-Cys2 (893 cm−1 region) as a reactant, suggesting that even when the dimer is used as a starting molecule, a desorbed monomeric molecule can be generated. This is probably due to the low concentration observed in the L-Cys2 case, inducing a low coverage degree of the surface and making it less possible to observe redimerization. One may expect that since the starting molecule was a dimer,48 both adsorption sites should be really close, but some have suggested that this is not a one step process, it can be an oxidation followed by a reduction process.48 Thus, some species can be adsorbed in sites that are not very close to each other and consequently, not be involved in the desorption process at the same time.
5. Conclusions
The interaction of L-cysteine and its dimer, L-Cys2, with a platinum electrode and their oxidation products were explored experimental and theoretically. Using DFT calculations, the most stable adsorbed conformations for the different protonation states were predicted and supported by IRRAS. This experimental approach allowed a study of the adsorption for both molecules under different pH conditions, a variable that strongly influences the adsorption potential of the molecule.The joint exploration encompassing the DFT and IR spectra (IRRAS technique) investigations for the oxidation process of these amino acids lead us to propose a new and more complex mechanism.
Acknowledgements
The authors would like to thank Prof. Dr Hans Viertler for data discussion and useful and helpful suggestions. AHBD thanks the São Paulo Research Foundation (Fapesp) for the scholarship grant #2013/25592-8. A. P. d. L. B. and A. G. S. O.-F. thank grants #2015/22203-6 and #2015/11714-0 (FAPESP) and the support of the High Performance Computing of Universidade de São Paulo (HPC-USP)/Rice University (National Science Foundation Grant OCI-0959097).References
- D. G. Davis and E. Bianco, J. Electroanal. Chem., 1966, 12, 254–260 CAS.
- J. Pradac and J. Koryta, J. Electroanal. Chem. Interfacial Electrochem., 1968, 17, 167–175 CrossRef CAS.
- J. A. Reynaud, B. Malfoy, P. Canesson and C. D. B. Moldculaire, J. Electroanal. Chem. Interfacial Electrochem., 1980, 114, 195–211 CrossRef CAS.
- C. Jacob, G. I. Giles, N. M. Giles and H. Sies, Angew. Chem., Int. Ed., 2003, 42, 4742–4758 CrossRef CAS PubMed.
- T. A. Enache and A. M. Oliveira-Brett, Bioelectrochemistry, 2011, 81, 46–52 CrossRef CAS PubMed.
- V. Hans, J. Gruber and V. L. Pardini, in Organic electrochemistry, 2001, pp. 621–668 Search PubMed.
- J. Koryta and J. Pradac, J. Electroanal. Chem. Interfacial Electrochem., 1968, 17, 177–183 CrossRef CAS.
- J. Koryta and J. Pradac, J. Electroanal. Chem. Interfacial Electrochem., 1968, 17, 185–189 CrossRef CAS.
- Z. Samec, Z. Makysheva, J. Koryta and J. Pradac, J. Electroanal. Chem., 1975, 65, 573–586 CrossRef CAS.
- I. Feliciano-Ramos, M. Caban-Acevedo, M. Aulice Scibioh and C. R. Cabrera, J. Electroanal. Chem., 2010, 650, 98–104 CrossRef CAS.
- P. J. Vandeberg and D. C. Johnson, Anal. Chem., 1993, 65, 2713–2718 CrossRef CAS.
- T. Watanabe and H. Maeda, J. Phys. Chem., 1989, 93, 3258–3260 CrossRef CAS.
- A. G. Brolo, P. Germain and G. Hager, J. Phys. Chem. B, 2002, 106, 5982–5987 CrossRef CAS.
- M. Bieri and T. Bürgi, J. Phys. Chem. B, 2005, 109, 22476–22485 CrossRef CAS PubMed.
- E. Santos, L. Avalle, K. Pötting, P. Vélez and H. Jones, Electrochim. Acta, 2008, 53, 6807–6817 CrossRef CAS.
- E. Santos, L. B. Avalle, R. Scurtu and H. Jones, Chem. Phys., 2007, 342, 236–244 CrossRef CAS.
- N. B. Luque, P. Vélez, K. Pötting and E. Santos, Langmuir, 2012, 28, 8084–8099 CrossRef CAS PubMed.
- N. B. Luque and E. Santos, Langmuir, 2012, 28, 11472–11480 CrossRef CAS PubMed.
- R. Di Felice, A. Selloni and E. Molinari, J. Phys. Chem. B, 2003, 107, 1151–1156 CrossRef CAS.
- R. Di Felice and A. Selloni, J. Chem. Phys., 2004, 120, 4906–4914 CrossRef CAS PubMed.
- F. Neese, Wiley Interdiscip. Rev.: Comput. Mol. Sci., 2012, 2, 73–78 CrossRef CAS.
- A. Klamt and G. Schüürmann, J. Chem. Soc., Perkin Trans. 2, 1993, 799 RSC.
- J. P. Perdew, K. Burke and M. Ernzerhof, Phys. Rev. Lett., 1996, 77, 3865–3868 CrossRef CAS PubMed.
- K. Eichkorn, O. Treutler, H. Öhm, M. Häser and R. Ahlrichs, Chem. Phys. Lett., 1995, 240, 283–290 CrossRef CAS.
- S. Grimme, J. Antony, S. Ehrlich and H. Krieg, J. Chem. Phys., 2010, 132, 154104 CrossRef PubMed.
- S. Grimme, Wiley Interdiscip. Rev.: Comput. Mol. Sci., 2011, 1, 211–228 CrossRef CAS.
- S. Grimme, S. Ehrlich and L. Goerigk, J. Comput. Chem., 2011, 32, 1456–1465 CrossRef CAS PubMed.
- A. Schäfer, H. Horn and R. Ahlrichs, J. Chem. Phys., 1992, 97, 2571 CrossRef.
- F. Weigend and R. Ahlrichs, Phys. Chem. Chem. Phys., 2005, 7, 3297–3305 RSC.
- D. Andrae, U. Häußermann, M. Dolg, H. Stoll and H. Preuß, Theor. Chim. Acta, 1990, 77, 123–141 CrossRef CAS.
- R. A. Kendall and H. A. Früchtl, Theor. Chem. Acc., 1997, 97, 158–163 CrossRef CAS.
- M. Feyereisen, G. Fitzgerald and A. Komornicki, Chem. Phys. Lett., 1993, 208, 359–363 CrossRef CAS.
- L. A. Curtiss and M. S. Gordon, Computational materials chemistry: methods and applications, Kluwer Academic Publishers, 2004 Search PubMed.
- M. Otani, I. Hamada, O. Sugino, Y. Morikawa, Y. Okamoto and T. Ikeshoji, Phys. Chem. Chem. Phys., 2008, 10, 3609 RSC.
- O. Sugino, I. Hamada, M. Otani, Y. Morikawa, T. Ikeshoji and Y. Okamoto, Surf. Sci., 2007, 601, 5237–5240 CrossRef CAS.
- R. Ferreira de Morais, A. A. Franco, P. Sautet and D. Loffreda, ACS Catal., 2015, 5, 1068–1077 CrossRef CAS.
- M. Mamatkulov and J.-S. Filhol, Phys. Chem. Chem. Phys., 2011, 13, 7675 RSC.
- M. Mamatkulov and J.-S. Filhol, J. Phys. Chem. C, 2013, 117, 2334–2343 CAS.
- D. A. Daramola and G. G. Botte, Comput. Theor. Chem., 2012, 989, 7–17 CrossRef CAS.
- K. Dhar and C. Cavallotti, J. Phys. Chem. A, 2014, 118, 8676–8688 CrossRef CAS PubMed.
- A. H. B. Dourado, R. Queiroz, M. L. A. Temperini and P. T. A. Sumodjo, J. Electroanal. Chem., 2016, 765, 87–91 CrossRef CAS.
- G. Hager and A. G. Brolo, J. Electroanal. Chem., 2009, 625, 109–116 CrossRef CAS.
- R. F. Willis, A. A. Lucas and G. D. Mahan, in The Chemical Physics of Solid Surfaces and Heterogeneous Catalysis – Volume 2, Adsorption at Solid Surfaces, ed. D. A. King and D. P. Woodruff, Elsevier B.V., Amsterdam, 1st edn, 1983, pp. 59–163 Search PubMed.
- N. V. Richardson and N. Sheppard, in Vibrational Spectroscopy of Molecule on Surfaces, ed. J. T. Yates and T. E. Madey, Plenum Press, New York, 1st edn, 1987, pp. 1–48 Search PubMed.
- a. K. Vijh and B. E. Conway, Chem. Rev., 1967, 67, 623–664 CrossRef CAS.
- W. H. Wang, Y. Himeda, J. T. Muckerman, G. F. Manbeck and E. Fujita, Chem. Rev., 2015, 115, 12936–12973 CrossRef CAS PubMed.
- S. Oae, Organic Chemistry of Sulfur, Plenum Press, New York, 1st edn, 1977 Search PubMed.
- W. Paik, S. Eu, K. Lee, S. Chon and M. Kim, Langmuir, 2000, 16, 10198–10205 CrossRef CAS.
Footnotes |
| † Electronic supplementary information (ESI) available: Spectra taken for L-Cys and L-Cys2, at pH ≠ 0. See DOI: 10.1039/c6ra26576f |
| ‡ In memoriam. |
| This journal is © The Royal Society of Chemistry 2017 |

