 Open Access Article
Wetting mechanism of a PVDF hollow fiber membrane in immersed membrane contactors for CO2 capture in the presence of monoethanolamine
Zhaohui Zhangab,
Xiaona Wuc,
Liang Wang *ab,
Bin Zhaoab,
Junjing Lib and
Hongwei Zhangab
aState Key Laboratory of Separation Membranes and Membrane Processes, No.399, Binshui West Street, Xiqing District, Tianjin 300387, China. E-mail: mashi7822@163; Fax: +86-22-83955392; Tel: +86-22-83955392
bDepartment of Environmental Engineering, Tianjin Polytechnic University, Tianjin 300387, China
cSchool of Environmental Science and Engineering, Tianjin University, Tianjin 300350, China
First published on 28th February 2017
Abstract
As an emerging technology, membrane gas absorption (MGA) contactors for carbon dioxide (CO2) capture exhibit great advantages compared to conventional chemical CO2 absorption processes. However, the decline in membrane flux, caused by the membrane's wetting, is a serious technical problem. In this study, to better understand the wetting mechanism of a polyvinylidene fluoride (PVDF) hollow fiber membrane in an immersed membrane contactor for CO2 capture, a 30 day operation of CO2 absorption was conducted, in which, 2 M monoethanolamine (MEA) solution and deionized water were used as the absorbents. The results showed that the presence of MEA in the absorbent solution aggravated the wetting phenomenon, thus significantly decreasing the membrane flux and membrane hydrophobicity. X-ray photoelectron spectroscopy (XPS) and attenuated total reflection-infrared spectroscopy (ATR-IR) analyses for the wetted membranes proved that no chemical reactions occurred between the MEA and the membrane. Furthermore, no hydrophobic components of the wetted membrane dissolved in the MEA solution. Instead, the presence of MEA was observed in the cross-linked network of the membrane wetted by the MEA absorbent. Field emission scanning electron microscope (FE-SEM) images of the outer surfaces of the wetted membranes suggested that the membrane morphologies changed and the membrane walls thickened, especially for the membrane wetted by the MEA absorbent. Both the presence of MEA molecules in the cross-linked network of the wetted membrane and the thickening of the membrane wall were important characteristics of membrane swelling. The changes in mechanical strengths of the wetted membranes also testified that membrane swelling occurred. Based on the above results, it was concluded that the membrane swelling caused the membrane wetting in the immersed PVDF membrane contactor for CO2 capture, and the presence of MEA in the absorbent further aggravated the process of membrane swelling.
1 Introduction
Global warming is caused by greenhouse gas emissions, and has received increased attention in recent years. Carbon dioxide (CO2) is considered as a major greenhouse gas, and research on its emission control and reduction has received a great deal of attention. Among several global anthropogenic emission sources, more than one-third of CO2 emissions come from the combustion of fossil fuels in power plants.1 According to the prediction of the International Energy Agency, fossil fuels will remain the dominant component of the world energy consumption until 2030.2 In the next few decades, the use of fossil fuels will continue to increase, and so will CO2 emissions. Therefore, the development of a separation process is urgently needed to remove and recover CO2 from coal-fired flue gas. The control of CO2 emissions from coal-fired flue gas is of great significance in the emission reduction of greenhouse gases.Membrane gas absorption (MGA) technology is a new hybrid technology, which combines membrane separation and chemical absorption. Qi and Clussler3,4 were the pioneers to use microporous polypropylene (PP) membranes for the absorption of CO2 in NaOH solution. Different from the conventional chemical absorption, the MGA process integrates the advantages of membrane technology (high surface area per volume, modularity and compact structure) and chemical absorption (high selectivity). The operational flexibility of the MGA processes, such as independent gas and liquid flows, helps avoid problems that are often encountered in conventional absorption processes, such as flooding, foaming, entrainment, and channeling.5–11 Some researchers have reported that MGA can provide high and well-defined contact area per equipment volume, which is 4–30 times more than that of the conventional absorption columns. For the same processing liquid and gas flow rates, the absorption rate of CO2 using a membrane was 4–6 times higher than that of the conventional chemical absorption.12,13 However, after long-term operation, membrane wetting occurs, which significantly decreases the efficiency of a membrane contactor.14–20 For example, when a PP hollow fiber membrane was used in an MGA contactor with diethanolamine (DEA) solution as the absorbent, the CO2 absorption rates in the non-wetted mode were six times higher than those in the wetted mode.17
Although polytetrafluoroethylene (PTFE) membrane possesses excellent resistance to wetting during MGA processes, it is too expensive to be widely applied.21 As the frequently-used hydrophobic membranes for the MGA processes, PP and polyvinylidene fluoride (PVDF) membranes were also wetted by the alkanolamine absorbents after a long-term exposure. A previous research has proved that the wetting resistance of the ordinary PVDF membrane was not as good as the PP membrane, whereas the CO2 flux of PVDF membrane was 13% higher than that of the PP membrane after 30 days of the operation.22 Furthermore, other properties of PVDF membranes are superior to PP membranes. For instance, the mechanical strength of PVDF membrane is higher than that of the PP membrane. Additionally, since PP membrane is usually produced by the stretching method, the relatively low porosity of PP membrane restricts a significant increase in the absorption flux. As a result, the main advantage of the microporous hollow fiber membrane, which has a high area-to-volume ratio, cannot by fully exerted. By contrast, the PVDF membrane is fabricated by the phase inversion method, which can obtain a higher porosity of membrane than the PP membrane. The porosity of different membranes reported in previous studies is summarized in Table 1.
Some studies have shown that the increase in the hydrophobicity of PVDF membrane can significantly increase its wetting resistance, and the improvement in its preparation method was one of the important means to increase the membrane hydrophobicity.24–27 Thereby, understanding the wetting mechanism of PVDF membrane is very important for improving the preparation of superhydrophobic membranes and selecting the appropriate absorption liquid. However, previous reports on the membrane wetting mechanism mainly focused on PP membranes, whereas their findings seem to be contradictory. Wang et al.23 attributed the PP membrane wetting to the chemical reaction between the PP membrane and DEA solution. Lv and Mahmud et al.28–30 found that absorbent molecules diffused into the PP polymers during the long-term exposure, thereby swelling the membranes. By contrast, the wetting mechanism of PVDF membrane is still unknown, and the relevant research is scarce. As the preparation methods, and materials of PP and PVDF membranes are different, the wetting mechanisms for PVDF and PP membranes are not confirmed to be identical. Therefore, a systematic investigation of the wetting mechanism of PVDF membrane is needed to fill the gaps in literature. The current study attempts to explore the wetting mechanism of PVDF membrane in alkanolamine absorbents, which are widely used for CO2 capture in MGA processes. For the test experiment, 2 M monoethanolamine (MEA) was used as the absorbent, while deionized water was used as the absorbent in the control experiment. The membrane flux and contact angles over 30 days of operation were analyzed to discuss the effect of MEA molecules on the wetting of PVDF membrane. Evidence of possible interaction between the MEA molecules and PVDF membrane was examined by X-ray photoelectron spectroscopy (XPS) and attenuated total reflection-infrared spectroscopy (ATR-IR). Moreover, membrane morphologies and mechanical breaking strengths of PVDF membranes before and after the wetting were also analyzed to further discuss the membrane wetting mechanism.
2 Experimental
2.1 Materials
The PVDF hollow fiber membranes used in the experiment were provided by the Institute of Biological and Chemical Engineering, Tianjin Polytechnic University, China. Various parameters of the PVDF membrane module used in the membrane contactor are listed in Table 2. Commercial N2 and CO2 gas cylinders (purity >99%, Tianjin Wanxin Gas Co., Ltd., China) were used. MEA with 99.5% purity (Tianjin Guangfu Chemical Co., Ltd., China) was dissolved in deionized water to prepare 2 M absorbent solution.| Parameters | Values |
|---|---|
| Fiber outer diameter (mm) | 1.1 |
| Fiber inner diameter (mm) | 0.8 |
| Membrane porosity (%) | 85 |
| Average membrane pore size (μm) | 0.16 |
| Number of fibers | 50 |
| Inner surface area of fibers (m2) | 0.0101 |
| Outer surface area of fibers (m2) | 0.0138 |
| Fiber length (m) | 0.08 |
2.2 CO2 absorption experiment
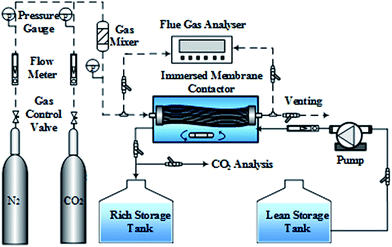
To investigate the wetting performance of the PVDF membrane, 30 day experiments of CO2 absorption were performed. Test and control experiments were conducted, to analyze the influence of MEA molecules on the wetting behavior of PVDF membrane in the MGA system with MEA used as the liquid absorbent. In the test experiment, 2 M MEA aqueous solution was used as the absorbent. In the control experiment, deionized water was used as the absorbent. The schematic of the experimental setup is shown in Fig. 1. The PVDF membrane module was immersed in a membrane contactor, which contained 3 L solution. A magnetic stirrer at the bottom of the contactor was used to stir the solution. The N2/CO2 mixture with a volumetric ratio of 85/15 was used as the simulated flue gas and passed through the tube-side of the hollow fiber membranes. The gas flow rate was 55 L h−1. The compositions of the inlet and outlet gas streams were analyzed using a flue gas analyzer (Testo350XL, Germany). The fresh absorbent entered the membrane contactor from the lean storage tank at a flow rate of 1.5 L h−1. The effluent of the membrane contactor (termed hereafter as the rich solution) was transferred to the rich storage tank. After thirty days of operation, several PVDF hollow fibers were taken out of the membrane contactor. These fibers were washed several times with deionized water, and then dried at 40 °C for 10 h under vacuum for further analysis (contact angle, XPS, ATR-IR and FE-SEM).23,282.3 Membrane immersion test
In order to determine whether the hydrophobic components of the PVDF membrane were lost due to the physical dissolution after long-term exposure to MEA solution, five pieces of new PVDF hollow fibers were immersed in pure MEA for thirty days. At the end of the immersion, these membrane fibers were taken out, and the socked solution was analyzed using ATR-IR. At the same time, pure MEA was also analyzed using ATR-IR. It should be noted that, in this immersion test, pure MEA was used instead of 2 M MEA solution, because the infrared spectrum of aqueous MEA solution would be seriously interfered by the water peak.2.4 Membrane characterization
3 Results and discussion
3.1 CO2 absorption performance during long-term operation
The membrane flux of CO2 absorption during thirty days of operation was analyzed, and the results are shown in Fig. 2. For convenience, the PVDF membrane used in the test experiment was named as the test membrane, and the PVDF membrane used in the control experiment was named as the control membrane. After thirty days of operation, the membrane flux of both the membranes decreased. The membrane flux of the test membrane and control membrane decreased by 54.5 and 36%, respectively. The experimental results indicated that even though water molecules can wet the PVDF membrane, the presence of MEA significantly intensified the degree of membrane wetting.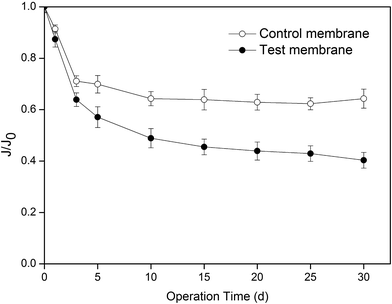 | ||
| Fig. 2 Change in membrane flux with operating time (J is the membrane flux, J0 is the initial membrane flux, and J0 = 5.01 mol m−2 h−1). | ||
3.2 Change in properties of PVDF membrane after long-term exposure to MEA solution
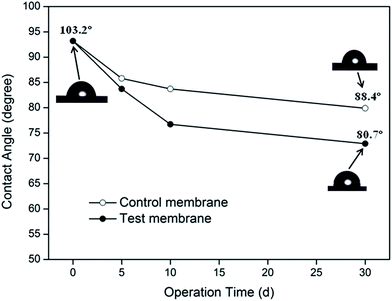
During the absorption experiments, a piece of 40 mm-long hollow fiber was removed from the membrane module after 0, 5, 10 and 30 days of operation, and the contact angles of the membrane's outer surface were measured. The values of the contact angle of the membrane fibers in the test and control experiments are plotted as a function of operating time, as shown in Fig. 3. The images of the water-drops on the membrane surface are also shown.Fig. 3 suggested that the hydrophobicity of the PVDF membrane decreased as it was wetted by the absorbent. The value of the contact angle of the test membrane decreased from 103.2° to 80.7° after thirty days of operation (a decline of 21.8%). The contact angle of the membrane, wetted by deionized water in the control experiment, decreased by 14.3%. These results implied that the decrease in the membrane's hydrophobicity may be the basic reason for membrane's wetting in the MGA system. The difference in the membrane hydrophobicity for both the absorption systems further demonstrated that the presence of MEA significantly increased the loss of degree of hydrophobicity of PVDF membrane. However, the reason for loss in the degree of hydrophobicity still need to be analyzed.
3.3 Analysis of wetting mechanism of the PVDF membrane after long-term exposure to MEA solution
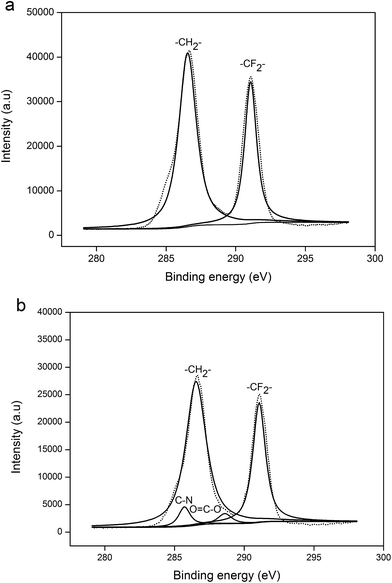
To further determine whether chemical reaction or physical dissolution occurred for the wetted membrane by the MEA solution, both the new (fresh) PVDF membrane and the membrane exposed to the MEA absorbent for thirty days were analyzed using XPS and FTIR analyses techniques.XPS measurements were performed for both the new PVDF membrane and the membrane used in the test experiment. The spectrum of new PVDF membrane fits well with typical peaks at the binding energies of 284.6 and 290.1 eV, assigned to C–H and C–F bonds, respectively. Furthermore, when the membrane fibers were exposed to MEA solution for thirty days in the test experiment (as shown in Fig. 4(b)), two new peaks appeared. The peaks at the binding energies of 285.7 and 287.9 eV were assigned to C–N and O–C![[double bond, length as m-dash]](https://www.rsc.org/images/entities/char_e001.gif) O bonds, respectively. Some researchers also discovered C–N bond using XPS, as they studied the wetting mechanism of the PP membrane. Wang et al.18 and Sedghi et al.31 have insisted that chemical reactions occurred between the PP membrane and DEA absorbent, forming the C–N bond. However, the experimental results from Lv et al.28 suggested that the presence of C–N bond was attributed to the diffusion of absorbent molecules into the PP polymer (membrane swelling). Actually, all of the above possibilities may happen. The C–N and O–C
O bonds, respectively. Some researchers also discovered C–N bond using XPS, as they studied the wetting mechanism of the PP membrane. Wang et al.18 and Sedghi et al.31 have insisted that chemical reactions occurred between the PP membrane and DEA absorbent, forming the C–N bond. However, the experimental results from Lv et al.28 suggested that the presence of C–N bond was attributed to the diffusion of absorbent molecules into the PP polymer (membrane swelling). Actually, all of the above possibilities may happen. The C–N and O–C![[double bond, length as m-dash]](https://www.rsc.org/images/entities/char_e001.gif) O bonds found on the membrane surface region might be the new groups formed due to chemical reaction between the PVDF and MEA, or these might be the result of membrane swelling. As the membrane swelling occurred, the MEA molecules and their carbonate products could penetrate the membrane matrix, which cannot be removed completely by the pretreatment before the XPS analysis. Therefore, the presence of C–N and O–C
O bonds found on the membrane surface region might be the new groups formed due to chemical reaction between the PVDF and MEA, or these might be the result of membrane swelling. As the membrane swelling occurred, the MEA molecules and their carbonate products could penetrate the membrane matrix, which cannot be removed completely by the pretreatment before the XPS analysis. Therefore, the presence of C–N and O–C![[double bond, length as m-dash]](https://www.rsc.org/images/entities/char_e001.gif) O bonds may also be derived from the residual MEA and its carbonate products in the membrane matrix. The existence of chemical reactions or physical swelling cannot be confirmed merely based on the presence of C–N and O–C
O bonds may also be derived from the residual MEA and its carbonate products in the membrane matrix. The existence of chemical reactions or physical swelling cannot be confirmed merely based on the presence of C–N and O–C![[double bond, length as m-dash]](https://www.rsc.org/images/entities/char_e001.gif) O bonds on the membrane surface region, and therefore, further research is needed in this regard.
O bonds on the membrane surface region, and therefore, further research is needed in this regard.
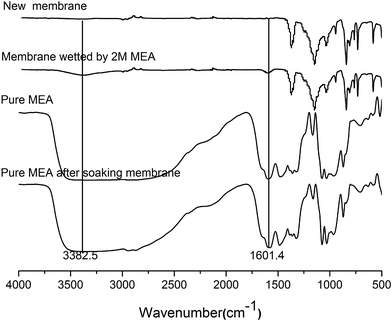
Fig. 5 showed the ATR-IR spectra of the new membrane and the membrane wetted by the MEA solution. Compared to the new membrane, two absorption peaks at ca. 3382.5 and 1601.4 cm−1 appeared for the wetted membrane used in the MEA absorption test (Fig. 5). These two peaks were attributed to the aggregation of polyhydroxy compounds and the bending vibration of NH2 groups, respectively. These two peaks coincided with the main typical peaks of MEA molecule.28,32,33 The results demonstrated that MEA molecules have diffused into the cross-linked network of PVDF polymer when the PVDF membrane was wetted by the MEA absorbent. The pretreatment process before the ATR-IR analysis can only remove MEA molecules from membrane pores instead of cross-linked network of the PVDF polymer. In other words, the presence of MEA molecules in the PVDF membrane matrix should be the result of membrane swelling, which further supported the results that the C–N and O–C![[double bond, length as m-dash]](https://www.rsc.org/images/entities/char_e001.gif) O bonds, found in the XPS analysis, were derived from the residual MEA and its carbonate products in the membrane matrix. Therefore, it can be concluded that no chemical reaction occurred for the membrane wetted by MEA, instead the process of membrane swelling took place during the absorption process.
O bonds, found in the XPS analysis, were derived from the residual MEA and its carbonate products in the membrane matrix. Therefore, it can be concluded that no chemical reaction occurred for the membrane wetted by MEA, instead the process of membrane swelling took place during the absorption process.
Meanwhile, the ATR-IR spectra of pure MEA before and after soaking the new PVDF membrane for thirty days were also shown in Fig. 5. Obviously, the ATR-IR spectrum of pure MEA after soaking the PVDF membrane had no relevant typical peaks of PVDF. This result demonstrates that PVDF materials do not dissolve in MEA solution. Consequently, the hydrophobic components of the PVDF membrane were not lost, as the membrane was wetted by the MEA solution. The decline in the hydrophobicity of the wetted membrane was the result of membrane swelling. After the membrane swelling occurred, both the water and MEA molecules intruded into the cross-linked network of the PVDF polymer. The intrusion of the polar molecules leads to the increase in the surface energy of PVDF membrane, which caused a decline in the hydrophobicity of the membrane. Moreover, since the polarity of MEA is higher than that of the water molecule, a bigger decrease in the membrane's hydrophobicity was observed for the membrane wetted by MEA.
Fig. 6 shows the outer surface and cross-sectional images of the PVDF membranes after thirty days of operation. Because the PVDF membrane was prepared via the wet-phase inversion method, the pore structure of the new membrane surface could not be seen clearly (Fig. 6(a1)). Compared to the new membrane, a small amount of macro-pores appeared on the membrane's surface in the control experiment after long-term operation (Fig. 6(b1)). However, a large number of macro-pores with irregular shapes emerged on the membrane's surface in the MEA absorption test (Fig. 6(c1)). These changes were the result of liquid intrusion into the membrane pores. Kamo et al.34 observed a similar phenomenon on the polyethylene membrane surface after contact with various organic solvents. The authors34 proposed that, when the liquid intruded into certain membrane pores, the fibrils separating large pores from neighbouring smaller pores were displaced in a manner that caused the latter pores to decrease in size and possibly close completely. Thus, the larger pores became larger and the smaller pores became smaller. The images in Fig. 6(a2, b2, and c2) further confirmed that the change in membrane's surface morphology was caused by the liquid intrusion into membrane pores, because the finger-like structure of the wetted membranes enlarged in scale, while their side walls became thinner than that of the new membrane. Obviously, more serious liquid intrusion (see Fig. 6(c2)) led to a more significant change in membrane's surface morphology (see Fig. 6(c1)). Meanwhile, more serious liquid intrusion also reflected more serious membrane wetting.
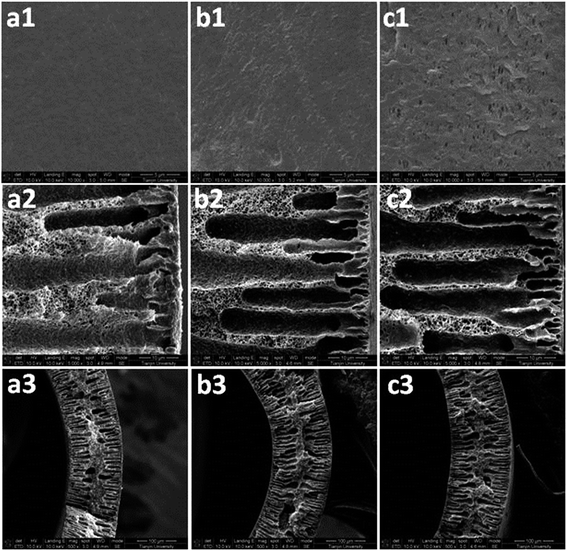 | ||
| Fig. 6 FE-SEM images of the outer surface and cross-section of the PVDF membranes: (a) new membrane, (b) control membrane, and (c) test membrane. | ||
Fig. 6(a3, b3, and c3) showed a marked thickening of the membrane walls of the hollow fibres, as they were wetted by the liquid absorbent. Furthermore, a thicker membrane wall for the test membrane was also observed compared to that of the control membrane (Fig. 6(b3 and c3)). From another aspect, this proved the occurrence of membrane swelling for the wetted membrane because the volume expansion is an important mark of swelling.35,36 It has been reported that many polymers swelled after long-term immersion in some ionic liquids or organic solutions.37,38 Therefore, based on the XPS, ATR-IR and FE-SEM analyses, it can be confirmed that the membrane swelling is the real reason for membrane wetting after long-term operation. Stronger affinity of MEA molecules to PVDF material and their higher molecular polarity than water molecules resulted in more severe membrane swelling, which led to more serious membrane wetting in the test experiment.
The values in Table 3 show the change in mechanical strength as the PVDF membrane was wetted by the MEA aqueous solution and deionized water. Compared with the new membrane, a decrease in the elongation and increase in the breaking strength were found for both the wetted membranes, and this change was found more significant for the membrane wetted by the MEA solution than that by the deionized water. The results of Table 2 further confirmed the occurrence of membrane swelling and also indicated more severe swelling in the PVDF–MEA aqueous solution system than that in the PVDF-deionized water system.
| Samples | Elongation at break (%) | Breaking strength (cN) |
|---|---|---|
| New membrane | 243.15 ± 0.88 | 121.69 ± 0.52 |
| The membrane immersed in 2 M MEA | 212.70 ± 4.89 | 130.74 ± 2.68 |
| The membrane immersed in deionized water | 215.26 ± 1.85 | 128.24 ± 0.79 |
4 Conclusions
The experimental studies on the CO2 absorption using 2 M MEA as the absorbent were conducted in an immersed PVDF hollow fiber membrane contactor for thirty days. A control experiment using deionized water as the absorbent (instead of MEA) was also conducted to compare the effect of MEA molecules on the PVDF membrane's wetting. The results indicated that the presence of MEA molecules in the absorbent significantly increased the degree of wetting of PVDF membrane, thus considerably decreasing the membrane flux and membrane hydrophobicity. The results from XPS and ATR-IR analyses indicated that as the membrane was wetted by the MEA liquid absorbent, neither the chemical reaction between the PVDF membrane and MEA molecules nor dissolution of the hydrophobic components of PVDF membrane into the MEA solution occurred. However, XPS and ATR-IR spectra of the wetted membrane demonstrated that MEA molecules had intruded into the cross-linked network of PVDF membrane matrix, which indicated that the membrane swelling had occurred. FE-SEM images further testified that the membrane swelling was responsible for the membrane wetting process. The surface energy of the PVDF membrane changed as the membrane swelling occurred, which led to the decline of membrane's hydrophobicity, thereby aggravating the membrane's wetting process. Since MEA molecules have stronger affinity to PVDF material and higher polarity than water molecules, more serious membrane swelling and membrane wetting occurred for the membrane wetted by the MEA absorbent than that by the deionized water.Acknowledgements
This study was financially supported by the National Natural Science Foundation of China (51678408, 51478314, 51638011 and 51508385); National Key Research and Development Program of China (2016YFC0400503); Tianjin Natural Science Foundation (14JCQNJC09000); and The Science and Technology Plans of Tianjin (No. 15PTSYJC00240, 15PTSYJC00230).References
- E. Favre, Chem. Eng. J., 2011, 171, 782–793 CrossRef CAS.
- IEA, Energy technology transitions for industry strategies for the next industrial revolution, International Energy Agency, Paris, France, 2009 Search PubMed.
- Z. Qi and E. L. Cussler, J. Membr. Sci., 1985, 23, 321–332 CrossRef CAS.
- Z. Qi and E. L. Cussler, J. Membr. Sci., 1985, 23, 333–345 CrossRef CAS.
- A. L. Ahmad and W. K. W. Ramli, Purif. Technol., 2013, 103, 230–240 CrossRef CAS.
- Y. S. Kim and S. M. Yang, Sep. Purif. Technol., 2000, 21, 101–109 CrossRef CAS.
- S. Khaisri, D. deMontigny, P. Tontiwachwuthikul and R. Jiraratananon, J. Membr. Sci., 2011, 376, 110–118 CrossRef CAS.
- J. G. Lu, A. C. Hua, Z. W. Xu, J. T. Li, S. Y. Liu, Z. L. Wang, Y. L. Zhao and C. Pan, J. Membr. Sci., 2013, 431, 9–18 CrossRef CAS.
- P. Luis, T. V. Gerven and B. V. Bruggen, Prog. Energy Combust. Sci., 2012, 38, 419–448 CrossRef CAS.
- A. Mansourizadeh and A. F. Ismail, Desalination, 2011, 273, 386–390 CrossRef CAS.
- A. Gabelman and S. T. Hwang, J. Membr. Sci., 1999, 159, 61–106 CrossRef CAS.
- M. Simioni, S. E. Kentish and G. W. Stevens, J. Membr. Sci., 2011, 378, 18–27 CrossRef CAS.
- E. Favre, J. Membr. Sci., 2009, 294, 50–59 CrossRef.
- S. Atchariyawut, C. S. Feng, R. Wang, R. Jiraratannanon and D. T. Liang, J. Membr. Sci., 2006, 285, 272–281 CrossRef CAS.
- J. G. Lu, L. J. Wang, X. Y. Sun, J. S. Li and X. D. Liu, Ind. Eng. Chem. Res., 2005, 44, 9230–9238 CrossRef CAS.
- M. C. García-Payo, M. A. Izquierdo-Gil and C. Fernández-Pineda, J. Colloid Interface Sci., 2000, 230, 420–431 CrossRef PubMed.
- Q. S. Zheng, Y. Yu and Z. H. Zhao, Langmuir, 2005, 21, 12207–12212 CrossRef CAS PubMed.
- R. Wang, H. Y. Zhang, P. H. M. Feron and D. T. Liang, Sep. Purif. Technol., 2005, 46, 33–40 CrossRef CAS.
- M. Mavroudi, S. P. Kaldis and G. P. Sakellaropoulos, J. Membr. Sci., 2006, 272, 103–115 CrossRef CAS.
- V. Y. Dindore, D. W. F. Brilman, F. H. Geuzebroek and G. F. Versteeg, Sep. Purif. Technol., 2004, 40, 133–145 CrossRef CAS.
- S. Khaisri, D. deMotigny, P. Tontiwachwuthikul and R. Jiraratananon, Sep. Purif. Technol., 2009, 65, 290–297 CrossRef CAS.
- L. Wang, Z. H. Zhang, B. Zhao, H. W. Zhang, X. L. Lu and Q. Yang, Sep. Purif. Technol., 2013, 116, 300–306 CrossRef CAS.
- R. Wang, D. F. Li, C. Zhou, M. Liu and D. T. Liang, J. Membr. Sci., 2004, 229, 147–157 CrossRef CAS.
- A. Gugliuzza and E. Drioli, J. Membr. Sci., 2007, 300, 51–62 CrossRef CAS.
- A. Gugliuzza and E. Drioli, Desalination, 2009, 240, 14–20 CrossRef CAS.
- Z. R. Zheng, Z. Y. Gu, R. T. Huo and Y. H. Ye, Appl. Surf. Sci., 2009, 255, 7263–7267 CrossRef CAS.
- A. Razmjou, E. Arifin, G. X. Dong, J. Mansouri and V. Chen, J. Membr. Sci., 2012, 415, 850–863 CrossRef.
- Y. X. Lv, X. H. Yu, S. T. Tu, J. Y. Yan and E. Dahlquist, J. Membr. Sci., 2010, 362, 444–452 CrossRef CAS.
- H. Mahmud, A. Kumar, R. M. Narbaitz and T. Matsuura, J. Membr. Sci., 2000, 179, 29–41 CrossRef CAS.
- H. Mahmud, A. Kumar, R. M. Narbaitz and T. Matsuura, Chem. Eng. J., 2004, 97, 69–75 CrossRef CAS.
- S. M. Sedghi, J. Brisson, D. Rodrigue and M. C. Iliuta, Sep. Purif. Technol., 2011, 80, 338–344 CrossRef CAS.
- E. S. Tarleton, J. P. Robinson and M. Salman, J. Membr. Sci., 2006, 280, 442–451 CrossRef CAS.
- Y. H. Wan and X. J. Zhang, J. Membr. Sci., 2002, 196, 185–201 CrossRef CAS.
- J. Kamo, T. Hirai and K. Kamada, J. Membr. Sci., 1992, 70, 217 CrossRef CAS.
- S. Tarleton, J. P. Robinson, S. J. Smith and J. J. W. Na, J. Membr. Sci., 2005, 261, 129–135 CrossRef.
- E. S. Tarleton, J. P. Robinson and M. Salman, J. Membr. Sci., 2006, 280, 442–451 CrossRef CAS.
- P. Izak, S. Hovorka, T. Bartovsky, L. Bartovska and J. G. Crespo, J. Membr. Sci., 2007, 296, 131–138 CrossRef CAS.
- H. L. Zhou, L. Lv, G. P. Liu, W. Q. Jin and W. H. Xing, J. Membr. Sci., 2014, 471, 47–55 CrossRef CAS.
| This journal is © The Royal Society of Chemistry 2017 |

