 Open Access Article
A green porous solid carbon source supports denitrification in low C/N salinity wastewater†
Hua Li ,
Jiasong Zhang‡
,
Ziming Zhou,
Qingsong Liu,
Hongbiao Dong,
Yafei Duan and
Chunhou Li*
,
Jiasong Zhang‡
,
Ziming Zhou,
Qingsong Liu,
Hongbiao Dong,
Yafei Duan and
Chunhou Li*
Key Lab of South China Sea Fishery Resources Exploitation & Utilization, Ministry of Agriculture, South China Sea Fisheries Research Institute, Chinese Academy of Fishery Science, Guangzhou, 510300, China. E-mail: scslch@vip.163.com; Tel: +86-20-89108353
First published on 27th March 2017
Abstract
A green porous composite was prepared using two kinds of natural polysaccharides, konjac glucomannan (KGM) and semen litchi (SL) in aqueous medium under mild conditions. The effect of mass ratios of KGM![[thin space (1/6-em)]](https://www.rsc.org/images/entities/char_2009.gif) :
:![[thin space (1/6-em)]](https://www.rsc.org/images/entities/char_2009.gif) SL on structures and denitrification was systematically investigated. The intermolecular hydrogen bonds and other synergistic interactions between KGM and SL gave the composite an amorphous phase and honeycomb network structure with a wide range of macropores. Its high porosity and biocompatibility meant the composite had short acclimation time. Nitrate removal rate could reach up to 98.8% on the first day and denitrification rate could reach up to 320.2 ± 5.82 mg N (L−1 d−1). In particular, the KGM
SL on structures and denitrification was systematically investigated. The intermolecular hydrogen bonds and other synergistic interactions between KGM and SL gave the composite an amorphous phase and honeycomb network structure with a wide range of macropores. Its high porosity and biocompatibility meant the composite had short acclimation time. Nitrate removal rate could reach up to 98.8% on the first day and denitrification rate could reach up to 320.2 ± 5.82 mg N (L−1 d−1). In particular, the KGM![[thin space (1/6-em)]](https://www.rsc.org/images/entities/char_2009.gif) :
:![[thin space (1/6-em)]](https://www.rsc.org/images/entities/char_2009.gif) SL = 3
SL = 3![[thin space (1/6-em)]](https://www.rsc.org/images/entities/char_2009.gif) :
:![[thin space (1/6-em)]](https://www.rsc.org/images/entities/char_2009.gif) 3 composite exhibited better mechanical property and much longer lifetime during the denitrification reaction. The porous composite can be used as an economical and effective carbon source for denitrification in low C/N wastewater.
3 composite exhibited better mechanical property and much longer lifetime during the denitrification reaction. The porous composite can be used as an economical and effective carbon source for denitrification in low C/N wastewater.
1. Introduction
Increased nitrogen pollutants have caused serious eutrophication and algal blooms in most areas of the world.1 Additionally, nitrate in drinking water has caused increasing methaemoglobinaemia in infants and alimentary canal cancer in human beings.2 Consequently, strict regulations have been imposed on nitrogen emission and drinking water quality criteria. For environmental and human health, a reduction in nitrate concentrations in wastewater and groundwater is vital.Heterotrophic denitrification is an environmentally friendly and economical process for removal of nitrate from wastewater. In biological denitrification processes, an organic carbon source is necessary as the electron donor for reduction of nitrate and nitrite. Therefore, it is important to add organics to denitrifying systems, especially in wastewater with a lower C/N ratio. Natural, organic substances such as rice husk,3 wood chips,4 wheat straw5 and cotton6 have been developed as cheap and safe carbon sources to remove nitrate from low C/N wastewater. Litchi (Litchi chinensis Sonn.) is a tropical fruit of high commercial value in the international fruit market, with an established production rate of 2![[thin space (1/6-em)]](https://www.rsc.org/images/entities/char_2009.gif) 600
600![[thin space (1/6-em)]](https://www.rsc.org/images/entities/char_2009.gif) 000 ton per a.7,8 As the agricultural waste of litchi, the output of semen litchi is very large. In our previous work,9 we found that semen litchi contained about 48.8% starch, which could be assimilated easily and quickly by microorganisms. Compared with other cellulose matrices, semen litchi exhibited a much higher nitrate removal rate and denitrification rate. However, because of its poor mechanical strength and low porosity, natural semen litchi has a short lifetime and a negative effect on bacterial adhesion and growth.
000 ton per a.7,8 As the agricultural waste of litchi, the output of semen litchi is very large. In our previous work,9 we found that semen litchi contained about 48.8% starch, which could be assimilated easily and quickly by microorganisms. Compared with other cellulose matrices, semen litchi exhibited a much higher nitrate removal rate and denitrification rate. However, because of its poor mechanical strength and low porosity, natural semen litchi has a short lifetime and a negative effect on bacterial adhesion and growth.
Konjac glucomannan (KGM) is a water-soluble non-ionic polysaccharide of high molecular weight, and is extracted from tubers of the Amorphophallus konjac plant in large quantities.10 KGM can form strong, elastic, heat-stable gels after removal of the acetyl groups on molecular chains when heated with mild alkali. It has been widely used in processed food, ink and paint, and biomedical materials.10–14
In this paper, a green, cheap and efficient carbon source is prepared from konjac glucomannan and semen litchi for denitrification in low C/N wastewater. Compared with other natural carbon sources, the green porous composite has high porosity and biocompatibility, and can be used as both carbon source and biofilm carrier for denitrifying bacteria. It possesses unique capability to remove nitrate from low C/N salinity wastewater. This kind of composite has good potential applications in denitrification for groundwater or other low C/N wastewater.
2. Materials and methods
2.1 Materials
Semen litchi was collected in Guangzhou city, and washed with tap water before air drying (50 °C). It was then crushed into granules of 200 mesh. The material was preserved in a moisture-free container at room temperature (25 °C). Konjac glucomannan was purchased from the market in Guangzhou and used as received. Other analytical grade chemical reagents were purchased from Sinopharm Group Chemical Reagent Co. Ltd. (Shanghai, China).2.2 Methods
The synthetic high salinity wastewater was prepared according to a previous protocol.15 The concentrations of NO3–N and PO4–P were about 60 mg L−1 and 10 mg L−1, respectively. The wastewater was replaced every day. Samples were taken and filtered through 0.45 μm membrane before analysis. The concentrations of chemical oxygen demandMn (CODMn), NO3–N, NO2–N were measured according to standard methods16 every day. The pH was determined with a digital, portable pH meter (OHAUS, ST10, Parsippany, USA). The DO level was measured with a digital, portable DO meter (YSI, Model 55, Yellow Springs, USA).
![[thin space (1/6-em)]](https://www.rsc.org/images/entities/char_2009.gif) 000.00 psia.
000.00 psia.3. Results and discussion
3.1 Scanning electron microscopy (SEM)
Fig. 1 shows SEM images of 200 mesh semen litchi, KGM and the KGM–SL composite with different ratios. The starch granules of 200 mesh semen litchi were almost monodispersed (Fig. 1a). In Fig. 1b, KGM shows a clear layer structure. During the freezing process, the formation of crystalline ice caused the originally dispersed KGM to be expelled to the boundaries between adjacent ice crystals.12,17 After lyophilization, this formed a porous layer KGM.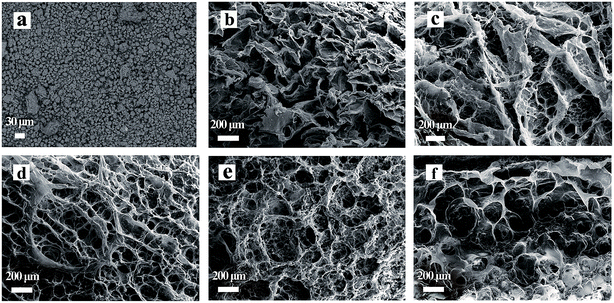 | ||
Fig. 1 SEM images of KGM–SL composites with different KGM![[thin space (1/6-em)]](https://www.rsc.org/images/entities/char_2009.gif) : :![[thin space (1/6-em)]](https://www.rsc.org/images/entities/char_2009.gif) SL ratios. (a) 200 mesh SL, (b) KGM, (c) KGM SL ratios. (a) 200 mesh SL, (b) KGM, (c) KGM![[thin space (1/6-em)]](https://www.rsc.org/images/entities/char_2009.gif) : :![[thin space (1/6-em)]](https://www.rsc.org/images/entities/char_2009.gif) SL = 3 SL = 3![[thin space (1/6-em)]](https://www.rsc.org/images/entities/char_2009.gif) : :![[thin space (1/6-em)]](https://www.rsc.org/images/entities/char_2009.gif) 1, (d) KGM 1, (d) KGM![[thin space (1/6-em)]](https://www.rsc.org/images/entities/char_2009.gif) : :![[thin space (1/6-em)]](https://www.rsc.org/images/entities/char_2009.gif) SL = 3 SL = 3![[thin space (1/6-em)]](https://www.rsc.org/images/entities/char_2009.gif) : :![[thin space (1/6-em)]](https://www.rsc.org/images/entities/char_2009.gif) 3, (e) KGM 3, (e) KGM![[thin space (1/6-em)]](https://www.rsc.org/images/entities/char_2009.gif) : :![[thin space (1/6-em)]](https://www.rsc.org/images/entities/char_2009.gif) SL = 3 SL = 3![[thin space (1/6-em)]](https://www.rsc.org/images/entities/char_2009.gif) : :![[thin space (1/6-em)]](https://www.rsc.org/images/entities/char_2009.gif) 5, (f) KGM 5, (f) KGM![[thin space (1/6-em)]](https://www.rsc.org/images/entities/char_2009.gif) : :![[thin space (1/6-em)]](https://www.rsc.org/images/entities/char_2009.gif) SL = 3 SL = 3![[thin space (1/6-em)]](https://www.rsc.org/images/entities/char_2009.gif) : :![[thin space (1/6-em)]](https://www.rsc.org/images/entities/char_2009.gif) 7. 7. | ||
All the KGM–SL composites exhibited a network structure with macropores, and nitrogen adsorption measurements demonstrated that the composites had almost no mesopores (data not shown). As the initial content of KGM was constant, the additive amount of SL influenced the microstructure of the composite. Semen litchi particles were wrapped in the KGM, causing the layer structure of KGM to gradually transform to a honeycomb structure (Fig. 1b–f).
From Table 1, based on the mercury intrusion measurements, it can be seen that compared with KGM–SL composite, KGM had a small pore size and high porosity. In KGM![[thin space (1/6-em)]](https://www.rsc.org/images/entities/char_2009.gif) :
:![[thin space (1/6-em)]](https://www.rsc.org/images/entities/char_2009.gif) SL = 3
SL = 3![[thin space (1/6-em)]](https://www.rsc.org/images/entities/char_2009.gif) :
:![[thin space (1/6-em)]](https://www.rsc.org/images/entities/char_2009.gif) 1 composite, addition of SL particles destroyed the clear layer structure (Fig. 1b), increased the pore diameter, and decreased the porosity of the KGM
1 composite, addition of SL particles destroyed the clear layer structure (Fig. 1b), increased the pore diameter, and decreased the porosity of the KGM![[thin space (1/6-em)]](https://www.rsc.org/images/entities/char_2009.gif) :
:![[thin space (1/6-em)]](https://www.rsc.org/images/entities/char_2009.gif) SL = 3
SL = 3![[thin space (1/6-em)]](https://www.rsc.org/images/entities/char_2009.gif) :
:![[thin space (1/6-em)]](https://www.rsc.org/images/entities/char_2009.gif) 1 composite. After the layer structure was transformed to a honeycomb structure (Fig. 1d–f), the KGM
1 composite. After the layer structure was transformed to a honeycomb structure (Fig. 1d–f), the KGM![[thin space (1/6-em)]](https://www.rsc.org/images/entities/char_2009.gif) :
:![[thin space (1/6-em)]](https://www.rsc.org/images/entities/char_2009.gif) SL = 3
SL = 3![[thin space (1/6-em)]](https://www.rsc.org/images/entities/char_2009.gif) :
:![[thin space (1/6-em)]](https://www.rsc.org/images/entities/char_2009.gif) 3 composite exhibited a higher porosity (90.76%) and a uniform pore size distribution. However, as the amount of SL continued to increase, the excess SL particles blocked the pores of the honeycomb structure, and the porosity of KGM–SL composite began to decrease (Fig. 1e and f). Compared with KGM
3 composite exhibited a higher porosity (90.76%) and a uniform pore size distribution. However, as the amount of SL continued to increase, the excess SL particles blocked the pores of the honeycomb structure, and the porosity of KGM–SL composite began to decrease (Fig. 1e and f). Compared with KGM![[thin space (1/6-em)]](https://www.rsc.org/images/entities/char_2009.gif) :
:![[thin space (1/6-em)]](https://www.rsc.org/images/entities/char_2009.gif) SL = 3
SL = 3![[thin space (1/6-em)]](https://www.rsc.org/images/entities/char_2009.gif) :
:![[thin space (1/6-em)]](https://www.rsc.org/images/entities/char_2009.gif) 5 composite, in parts of the KGM
5 composite, in parts of the KGM![[thin space (1/6-em)]](https://www.rsc.org/images/entities/char_2009.gif) :
:![[thin space (1/6-em)]](https://www.rsc.org/images/entities/char_2009.gif) SL = 3
SL = 3![[thin space (1/6-em)]](https://www.rsc.org/images/entities/char_2009.gif) :
:![[thin space (1/6-em)]](https://www.rsc.org/images/entities/char_2009.gif) 7 composite, some large diameter pores appeared, making the average pore diameter and porosity higher than those of the KGM
7 composite, some large diameter pores appeared, making the average pore diameter and porosity higher than those of the KGM![[thin space (1/6-em)]](https://www.rsc.org/images/entities/char_2009.gif) :
:![[thin space (1/6-em)]](https://www.rsc.org/images/entities/char_2009.gif) SL = 3
SL = 3![[thin space (1/6-em)]](https://www.rsc.org/images/entities/char_2009.gif) :
:![[thin space (1/6-em)]](https://www.rsc.org/images/entities/char_2009.gif) 5 composite. Mercury intrusion measurements showed that the ratio of KGM to SL = 3
5 composite. Mercury intrusion measurements showed that the ratio of KGM to SL = 3![[thin space (1/6-em)]](https://www.rsc.org/images/entities/char_2009.gif) :
:![[thin space (1/6-em)]](https://www.rsc.org/images/entities/char_2009.gif) 3 was a more appropriate ratio.
3 was a more appropriate ratio.
| Average pore diameter (μm) | Porosity (%) | |
|---|---|---|
| KGM | 9.64 | 86.37 |
KGM![[thin space (1/6-em)]](https://www.rsc.org/images/entities/char_2009.gif) : :![[thin space (1/6-em)]](https://www.rsc.org/images/entities/char_2009.gif) SL = 3 SL = 3![[thin space (1/6-em)]](https://www.rsc.org/images/entities/char_2009.gif) : :![[thin space (1/6-em)]](https://www.rsc.org/images/entities/char_2009.gif) 1 1 |
7.41 | 79.89 |
KGM![[thin space (1/6-em)]](https://www.rsc.org/images/entities/char_2009.gif) : :![[thin space (1/6-em)]](https://www.rsc.org/images/entities/char_2009.gif) SL = 3 SL = 3![[thin space (1/6-em)]](https://www.rsc.org/images/entities/char_2009.gif) : :![[thin space (1/6-em)]](https://www.rsc.org/images/entities/char_2009.gif) 3 3 |
79.2 | 90.76 |
KGM![[thin space (1/6-em)]](https://www.rsc.org/images/entities/char_2009.gif) : :![[thin space (1/6-em)]](https://www.rsc.org/images/entities/char_2009.gif) SL = 3 SL = 3![[thin space (1/6-em)]](https://www.rsc.org/images/entities/char_2009.gif) : :![[thin space (1/6-em)]](https://www.rsc.org/images/entities/char_2009.gif) 5 5 |
38.65 | 62.0 |
KGM![[thin space (1/6-em)]](https://www.rsc.org/images/entities/char_2009.gif) : :![[thin space (1/6-em)]](https://www.rsc.org/images/entities/char_2009.gif) SL = 3 SL = 3![[thin space (1/6-em)]](https://www.rsc.org/images/entities/char_2009.gif) : :![[thin space (1/6-em)]](https://www.rsc.org/images/entities/char_2009.gif) 7 7 |
42.25 | 70.2 |
Moreover, the pore wall thickness also increased with the increasing amount of SL. The higher precursor concentration leads to a thicker pore wall because of retarded ice crystal growth with increased mixture viscosity.12 SEM results indicated that addition of SL to KGM changed the structure of KGM and improved the porosity and increased the pore wall thickness of the KGM–SL composite.
3.2 Fourier transform infrared spectrum
FTIR spectra of KGM and KGM–SL composites are shown in Fig. 2, with similar main characteristic absorptions. The peak at approximately 1730 cm−1 of KGM, which was found to be assigned to acetyl groups in previous work,18,19 was eliminated in all samples after addition of alkaline and heating. In the KGM sample (e), the stretching and bending vibration of the hydrogen bonding groups assigned to the intermolecular hydrogen bonds and C–H of methyl in KGM occurred at 3404 cm−1 and 2943 cm−1, respectively. The peak at 1645 cm−1 in the spectrum of KGM was assigned to the intramolecular hydrogen bonds, and the characteristic peak bands of mannose in KGM appeared at 807 cm−1 and 752 cm−1.20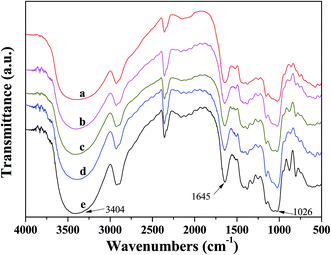 | ||
Fig. 2 FTIR spectra of different samples. (a) KGM![[thin space (1/6-em)]](https://www.rsc.org/images/entities/char_2009.gif) : :![[thin space (1/6-em)]](https://www.rsc.org/images/entities/char_2009.gif) SL = 3 SL = 3![[thin space (1/6-em)]](https://www.rsc.org/images/entities/char_2009.gif) : :![[thin space (1/6-em)]](https://www.rsc.org/images/entities/char_2009.gif) 7, (b) KGM 7, (b) KGM![[thin space (1/6-em)]](https://www.rsc.org/images/entities/char_2009.gif) : :![[thin space (1/6-em)]](https://www.rsc.org/images/entities/char_2009.gif) SL = 3 SL = 3![[thin space (1/6-em)]](https://www.rsc.org/images/entities/char_2009.gif) : :![[thin space (1/6-em)]](https://www.rsc.org/images/entities/char_2009.gif) 5, (c) KGM 5, (c) KGM![[thin space (1/6-em)]](https://www.rsc.org/images/entities/char_2009.gif) : :![[thin space (1/6-em)]](https://www.rsc.org/images/entities/char_2009.gif) SL = 3 SL = 3![[thin space (1/6-em)]](https://www.rsc.org/images/entities/char_2009.gif) : :![[thin space (1/6-em)]](https://www.rsc.org/images/entities/char_2009.gif) 3, (d) KGM 3, (d) KGM![[thin space (1/6-em)]](https://www.rsc.org/images/entities/char_2009.gif) : :![[thin space (1/6-em)]](https://www.rsc.org/images/entities/char_2009.gif) SL = 3 SL = 3![[thin space (1/6-em)]](https://www.rsc.org/images/entities/char_2009.gif) : :![[thin space (1/6-em)]](https://www.rsc.org/images/entities/char_2009.gif) 1, (e) KGM. 1, (e) KGM. | ||
In the typical spectrum of the KGM–SL composite, the characteristic peaks of stretching vibration for both hydrogen-bonded hydroxyl and C–O groups were broadened and showed shifts with increasing SL content in the composite. For example, the stretching vibrations of hydrogen-bonded hydroxyl groups were located at 3404 cm−1 in KGM. But with an increase of SL from 1 g to 7 g, this peak broadened and shifted from 3400 cm−1 (KGM![[thin space (1/6-em)]](https://www.rsc.org/images/entities/char_2009.gif) :
:![[thin space (1/6-em)]](https://www.rsc.org/images/entities/char_2009.gif) SL = 3
SL = 3![[thin space (1/6-em)]](https://www.rsc.org/images/entities/char_2009.gif) :
:![[thin space (1/6-em)]](https://www.rsc.org/images/entities/char_2009.gif) 1) to 3371 cm−1 (KGM
1) to 3371 cm−1 (KGM![[thin space (1/6-em)]](https://www.rsc.org/images/entities/char_2009.gif) :
:![[thin space (1/6-em)]](https://www.rsc.org/images/entities/char_2009.gif) SL = 3
SL = 3![[thin space (1/6-em)]](https://www.rsc.org/images/entities/char_2009.gif) :
:![[thin space (1/6-em)]](https://www.rsc.org/images/entities/char_2009.gif) 7). This indicated the number of intermolecular hydrogen bonds between KGM and SL was increased. Furthermore, the stretching vibration for C–O located at 1026 cm−1 and the peak at 1645 cm−1 assigned to the intramolecular hydrogen bonds were broadened and shifted to a lower wave number with increasing SL content, suggesting that new hydrogen bonds between KGM and SL molecules were formed in the composite.21 Based on these results, it can be concluded that the good miscibility between KGM and SL resulted from formation of synergistic interaction and intermolecular hydrogen bonds during the blending and forming processes.22
7). This indicated the number of intermolecular hydrogen bonds between KGM and SL was increased. Furthermore, the stretching vibration for C–O located at 1026 cm−1 and the peak at 1645 cm−1 assigned to the intramolecular hydrogen bonds were broadened and shifted to a lower wave number with increasing SL content, suggesting that new hydrogen bonds between KGM and SL molecules were formed in the composite.21 Based on these results, it can be concluded that the good miscibility between KGM and SL resulted from formation of synergistic interaction and intermolecular hydrogen bonds during the blending and forming processes.22
3.3 X-ray diffraction analysis
The X-ray diffraction patterns of KGM and KGM–SL composites are shown in Fig. 3. The patterns of KGM displayed a broad peak at 2θ = 20.6° with a small and weak peak appearing at 11.7°, which indicated that the KGM was in the amorphous phase.23 Incorporation of SL had an effect on the crystalline structure of the KGM. On the whole, the XRD patterns of the KGM–SL composites still retained characteristic peaks of KGM. But the diffraction peaks at 11.7° had disappeared and the diffraction peak (2θ = 20.6°) shifted to a lower angle as SL content increased. This indicated that incorporation of SL starch into KGM increased the distance between D-mannose and D-glucose on the KGM chain and decreased the intermolecular force, leading to increased movement of the KGM chain.20 Hence, the composite displayed a more porous network structure as shown in Fig. 1. Apparently, when SL content increased, the broad hump located around 2θ = 17.2° displayed ill-defined diffraction peaks which were attributed to the characteristic peaks of starch.24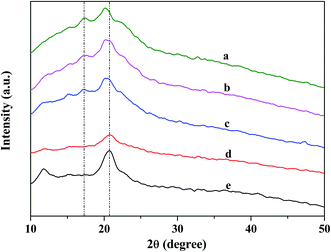 | ||
Fig. 3 XRD curves of KGM and KGM![[thin space (1/6-em)]](https://www.rsc.org/images/entities/char_2009.gif) : :![[thin space (1/6-em)]](https://www.rsc.org/images/entities/char_2009.gif) SL composites. (a) KGM SL composites. (a) KGM![[thin space (1/6-em)]](https://www.rsc.org/images/entities/char_2009.gif) : :![[thin space (1/6-em)]](https://www.rsc.org/images/entities/char_2009.gif) SL = 3 SL = 3![[thin space (1/6-em)]](https://www.rsc.org/images/entities/char_2009.gif) : :![[thin space (1/6-em)]](https://www.rsc.org/images/entities/char_2009.gif) 7, (b) KGM 7, (b) KGM![[thin space (1/6-em)]](https://www.rsc.org/images/entities/char_2009.gif) : :![[thin space (1/6-em)]](https://www.rsc.org/images/entities/char_2009.gif) SL = 3 SL = 3![[thin space (1/6-em)]](https://www.rsc.org/images/entities/char_2009.gif) : :![[thin space (1/6-em)]](https://www.rsc.org/images/entities/char_2009.gif) 5, (c) KGM 5, (c) KGM![[thin space (1/6-em)]](https://www.rsc.org/images/entities/char_2009.gif) : :![[thin space (1/6-em)]](https://www.rsc.org/images/entities/char_2009.gif) SL = 3 SL = 3![[thin space (1/6-em)]](https://www.rsc.org/images/entities/char_2009.gif) : :![[thin space (1/6-em)]](https://www.rsc.org/images/entities/char_2009.gif) 3, (d) KGM 3, (d) KGM![[thin space (1/6-em)]](https://www.rsc.org/images/entities/char_2009.gif) : :![[thin space (1/6-em)]](https://www.rsc.org/images/entities/char_2009.gif) SL = 3 SL = 3![[thin space (1/6-em)]](https://www.rsc.org/images/entities/char_2009.gif) : :![[thin space (1/6-em)]](https://www.rsc.org/images/entities/char_2009.gif) 1, (e) KGM. 1, (e) KGM. | ||
From the SEM, FTIR and XRD results, it was found that intermolecular hydrogen bonds between SL and KGM induced a high porosity network structure of KMG-SL, important properties required for bio-media to form a biofilm. Moreover, KGM–SL consists of two kinds of natural nontoxic polysaccharides, which make it nontoxic, biodegradable and biocompatible. Finally, the simple and environmental friendly preparation process means that KGM–SL has good application prospects for engineering.
3.4 Denitrification removal rate of KGM–SL
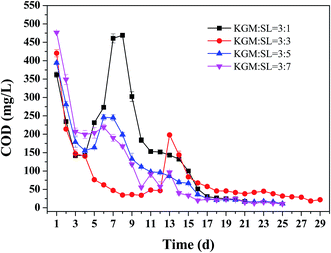
First, the lifetime and the denitrification removal rate of the KGM–SL composites were investigated. The changes of COD in effluent water during the denitrification reactions are shown in Fig. 4. At the beginning, a significant amount of COD in effluent water was observed because some organic matter in KGM–SL had already been released during the blending process and had been adsorbed on the surface of composite. When the composites were put into the denitrification reactor, the absorbed organic matter was released quickly and led to a high concentration in effluent water. Days later, the concentration of COD decreased rapidly because the number of microorganisms was increased and more carbon source was used. From the 5th to the 8th day, the COD in effluent water suddenly increased except for the KGM![[thin space (1/6-em)]](https://www.rsc.org/images/entities/char_2009.gif) :
:![[thin space (1/6-em)]](https://www.rsc.org/images/entities/char_2009.gif) SL = 3
SL = 3![[thin space (1/6-em)]](https://www.rsc.org/images/entities/char_2009.gif) :
:![[thin space (1/6-em)]](https://www.rsc.org/images/entities/char_2009.gif) 3 composite. This abnormal phenomenon can be partly explained by the SEM images of composites after 6 days denitrification (Fig. S1†). Numbers of bacteria were grown extensively on the backbone of KGM–SL, resulting in collapse of the porous structure then most of the soluble carbon was washed out and caused the sudden increase of COD.3 Although much more bacteria was grown on the backbone of KGM
3 composite. This abnormal phenomenon can be partly explained by the SEM images of composites after 6 days denitrification (Fig. S1†). Numbers of bacteria were grown extensively on the backbone of KGM–SL, resulting in collapse of the porous structure then most of the soluble carbon was washed out and caused the sudden increase of COD.3 Although much more bacteria was grown on the backbone of KGM![[thin space (1/6-em)]](https://www.rsc.org/images/entities/char_2009.gif) :
:![[thin space (1/6-em)]](https://www.rsc.org/images/entities/char_2009.gif) SL = 3
SL = 3![[thin space (1/6-em)]](https://www.rsc.org/images/entities/char_2009.gif) :
:![[thin space (1/6-em)]](https://www.rsc.org/images/entities/char_2009.gif) 3 composite (Fig. S1b†), the structural collapse of KGM
3 composite (Fig. S1b†), the structural collapse of KGM![[thin space (1/6-em)]](https://www.rsc.org/images/entities/char_2009.gif) :
:![[thin space (1/6-em)]](https://www.rsc.org/images/entities/char_2009.gif) SL = 3
SL = 3![[thin space (1/6-em)]](https://www.rsc.org/images/entities/char_2009.gif) :
:![[thin space (1/6-em)]](https://www.rsc.org/images/entities/char_2009.gif) 3 composite occurred on the 13th day, much later than the other composites. And the size of KGM
3 composite occurred on the 13th day, much later than the other composites. And the size of KGM![[thin space (1/6-em)]](https://www.rsc.org/images/entities/char_2009.gif) :
:![[thin space (1/6-em)]](https://www.rsc.org/images/entities/char_2009.gif) SL = 3
SL = 3![[thin space (1/6-em)]](https://www.rsc.org/images/entities/char_2009.gif) :
:![[thin space (1/6-em)]](https://www.rsc.org/images/entities/char_2009.gif) 3 composite gradually became smaller unlike the others which were broken within 2 days (Fig. S2†). From the results, it was concluded that the KGM
3 composite gradually became smaller unlike the others which were broken within 2 days (Fig. S2†). From the results, it was concluded that the KGM![[thin space (1/6-em)]](https://www.rsc.org/images/entities/char_2009.gif) :
:![[thin space (1/6-em)]](https://www.rsc.org/images/entities/char_2009.gif) SL = 3
SL = 3![[thin space (1/6-em)]](https://www.rsc.org/images/entities/char_2009.gif) :
:![[thin space (1/6-em)]](https://www.rsc.org/images/entities/char_2009.gif) 3 composite had a much longer lifetime and better mechanical property in denitrification.
3 composite had a much longer lifetime and better mechanical property in denitrification.
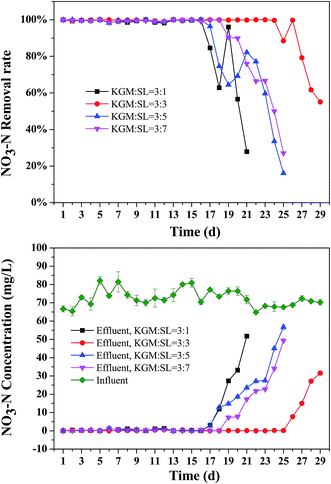
The denitrification performance of KGM–SL is presented in Fig. 5 and S3.† A high denitrification performance was achieved on the first day. During the whole denitrification, nitrate removal rate was kept between 98.8% and 100% and the nitrite was lower than 0.15 mg L−1 (Fig. S3†), indicating that KGM–SL had short acclimation time and salinity did not negatively affect denitrification. After exhaustion of the carbon sources, nitrate removal rate less than 50% occurred on the 21st, 29th, 23rd and 24th days for KGM![[thin space (1/6-em)]](https://www.rsc.org/images/entities/char_2009.gif) :
:![[thin space (1/6-em)]](https://www.rsc.org/images/entities/char_2009.gif) SL = 3
SL = 3![[thin space (1/6-em)]](https://www.rsc.org/images/entities/char_2009.gif) :
:![[thin space (1/6-em)]](https://www.rsc.org/images/entities/char_2009.gif) 1, KGM
1, KGM![[thin space (1/6-em)]](https://www.rsc.org/images/entities/char_2009.gif) :
:![[thin space (1/6-em)]](https://www.rsc.org/images/entities/char_2009.gif) SL = 3
SL = 3![[thin space (1/6-em)]](https://www.rsc.org/images/entities/char_2009.gif) :
:![[thin space (1/6-em)]](https://www.rsc.org/images/entities/char_2009.gif) 3, KGM
3, KGM![[thin space (1/6-em)]](https://www.rsc.org/images/entities/char_2009.gif) :
:![[thin space (1/6-em)]](https://www.rsc.org/images/entities/char_2009.gif) SL = 3
SL = 3![[thin space (1/6-em)]](https://www.rsc.org/images/entities/char_2009.gif) :
:![[thin space (1/6-em)]](https://www.rsc.org/images/entities/char_2009.gif) 5 and KGM
5 and KGM![[thin space (1/6-em)]](https://www.rsc.org/images/entities/char_2009.gif) :
:![[thin space (1/6-em)]](https://www.rsc.org/images/entities/char_2009.gif) SL = 3
SL = 3![[thin space (1/6-em)]](https://www.rsc.org/images/entities/char_2009.gif) :
:![[thin space (1/6-em)]](https://www.rsc.org/images/entities/char_2009.gif) 7 composites, respectively. The KGM
7 composites, respectively. The KGM![[thin space (1/6-em)]](https://www.rsc.org/images/entities/char_2009.gif) :
:![[thin space (1/6-em)]](https://www.rsc.org/images/entities/char_2009.gif) SL = 3
SL = 3![[thin space (1/6-em)]](https://www.rsc.org/images/entities/char_2009.gif) :
:![[thin space (1/6-em)]](https://www.rsc.org/images/entities/char_2009.gif) 3 composite exhibited a much longer lifetime, which would be advantageous for engineering applications. During the experiment, it was found that after the 17th day, when the NO3–N removal rate started to decrease, there was a transient increase in NO3–N removal rate. This is because near the end of the experiment, the composite appeared to thoroughly collapse and some carbon source was released. However, this carbon source was used quickly by denitrifying bacteria, the COD in effluent was not changed but a transient increase of NO3–N removal rate occurred. Then the carbon source was totally exhausted, and the NO3–N removal rate decreased quickly.
3 composite exhibited a much longer lifetime, which would be advantageous for engineering applications. During the experiment, it was found that after the 17th day, when the NO3–N removal rate started to decrease, there was a transient increase in NO3–N removal rate. This is because near the end of the experiment, the composite appeared to thoroughly collapse and some carbon source was released. However, this carbon source was used quickly by denitrifying bacteria, the COD in effluent was not changed but a transient increase of NO3–N removal rate occurred. Then the carbon source was totally exhausted, and the NO3–N removal rate decreased quickly.
Table 2 lists the denitrification rate of different solid carbon sources as reported in other literature. Compared with the rice husk (90.6–97.8%),3 corncobs (90%)1 and starch–PCL (93.53–99.13%)25 in fresh water, the nitrate removal rate of KGM–SL (98.8–100%) was much higher even in high salinity water, especially on the first day. Compared with the listed natural carbon source, KGM–SL composite had a better structure and higher assimilation rate by denitrifying bacteria, giving the composite a higher denitrification rate than the other natural carbon sources.
3.5 Denitrification rate of KGM–SL
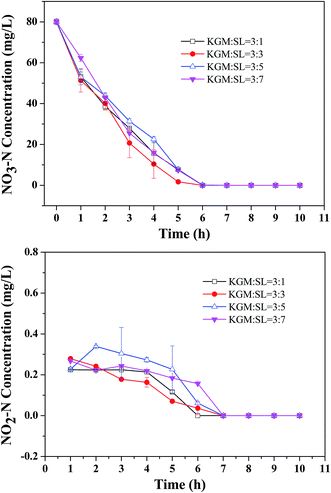
Fig. 6 shows the changes in NO3–N and NO2–N concentrations over time when stable nitrate removal rate was achieved. It can be seen that NO3–N could be removed completely after 6 h. Nitrite concentration ranged from 0.03 to 0.28 mg L−1 in the first 6 h and then decreased to 0 after 6 h. The linear correlation between the concentration of NO3–N and time was investigated and the degrees of correlation r2 were 0.956, 0.962, 0.97 and 0.976 for KGM![[thin space (1/6-em)]](https://www.rsc.org/images/entities/char_2009.gif) :
:![[thin space (1/6-em)]](https://www.rsc.org/images/entities/char_2009.gif) SL = 3
SL = 3![[thin space (1/6-em)]](https://www.rsc.org/images/entities/char_2009.gif) :
:![[thin space (1/6-em)]](https://www.rsc.org/images/entities/char_2009.gif) 1, KGM
1, KGM![[thin space (1/6-em)]](https://www.rsc.org/images/entities/char_2009.gif) :
:![[thin space (1/6-em)]](https://www.rsc.org/images/entities/char_2009.gif) SL = 3
SL = 3![[thin space (1/6-em)]](https://www.rsc.org/images/entities/char_2009.gif) :
:![[thin space (1/6-em)]](https://www.rsc.org/images/entities/char_2009.gif) 3, KGM
3, KGM![[thin space (1/6-em)]](https://www.rsc.org/images/entities/char_2009.gif) :
:![[thin space (1/6-em)]](https://www.rsc.org/images/entities/char_2009.gif) SL = 3
SL = 3![[thin space (1/6-em)]](https://www.rsc.org/images/entities/char_2009.gif) :
:![[thin space (1/6-em)]](https://www.rsc.org/images/entities/char_2009.gif) 5 and KGM
5 and KGM![[thin space (1/6-em)]](https://www.rsc.org/images/entities/char_2009.gif) :
:![[thin space (1/6-em)]](https://www.rsc.org/images/entities/char_2009.gif) SL = 3
SL = 3![[thin space (1/6-em)]](https://www.rsc.org/images/entities/char_2009.gif) :
:![[thin space (1/6-em)]](https://www.rsc.org/images/entities/char_2009.gif) 7 composites, respectively. Results indicated that the denitrification process supported by KGM–SL followed a zero-order reaction.26,27 The denitrification rate of KGM
7 composites, respectively. Results indicated that the denitrification process supported by KGM–SL followed a zero-order reaction.26,27 The denitrification rate of KGM![[thin space (1/6-em)]](https://www.rsc.org/images/entities/char_2009.gif) :
:![[thin space (1/6-em)]](https://www.rsc.org/images/entities/char_2009.gif) SL = 3
SL = 3![[thin space (1/6-em)]](https://www.rsc.org/images/entities/char_2009.gif) :
:![[thin space (1/6-em)]](https://www.rsc.org/images/entities/char_2009.gif) 3 was calculated to be about 320.2 ± 5.82 mg N (L−1 d−1), which was much higher than the liquorice (6.2 mg N (L−1 d−1)),28 wheat straw (53 mg N (L−1 d−1))12 and cotton (81 mg N (L−1 d−1))3 (Table 2).
3 was calculated to be about 320.2 ± 5.82 mg N (L−1 d−1), which was much higher than the liquorice (6.2 mg N (L−1 d−1)),28 wheat straw (53 mg N (L−1 d−1))12 and cotton (81 mg N (L−1 d−1))3 (Table 2).
4. Conclusions
In this paper, porous composites were prepared from KGM and semen litchi and used as a solid carbon source for denitrification in low C/N wastewater. The synergistic interaction and intermolecular hydrogen bonds between KGM and SL gave the composite a porous network structure with macropores. During the denitrification reaction, because of the high porosity and biocompatibility the KGM–SL composite showed short acclimation time, high nitrate removal rate, and fast denitrification rate compared with other solid carbon sources. In particular, the KGM![[thin space (1/6-em)]](https://www.rsc.org/images/entities/char_2009.gif) :
:![[thin space (1/6-em)]](https://www.rsc.org/images/entities/char_2009.gif) SL = 3
SL = 3![[thin space (1/6-em)]](https://www.rsc.org/images/entities/char_2009.gif) :
:![[thin space (1/6-em)]](https://www.rsc.org/images/entities/char_2009.gif) 3 composite exhibited higher porosity (90.76%), better mechanical property, and much longer lifetime. Nitrate removal rate could reach up to 98.8% on the first day and denitrification rate could reach up to 320.2 ± 5.82 mg N (L−1 d−1). This porous composite could be used as an economical and environmentally friendly carbon source for denitrification in high salinity low C/N wastewater.
3 composite exhibited higher porosity (90.76%), better mechanical property, and much longer lifetime. Nitrate removal rate could reach up to 98.8% on the first day and denitrification rate could reach up to 320.2 ± 5.82 mg N (L−1 d−1). This porous composite could be used as an economical and environmentally friendly carbon source for denitrification in high salinity low C/N wastewater.
Acknowledgements
The research work was financially supported by the Guangdong Province marine economic development of regional innovation demonstration projects (GD2012-A02-011), Shenzhen ocean economic innovation and development of regional demonstration projects (SZHY2012-B02-001), the special fund for fishery science of Guangdong Province (A201301D02), central public welfare research institutes the fundamental research funds for the project (2014TS20, 2015TS11) and Shenzhen strategic emerging industries and future industrial development projects (201605051733565380).References
- Z.-X. Xu, L. Shao, H.-L. Yin, H.-Q. Chu and Y.-J. Yao, Water Environ. Res., 2009, 81, 242–247 CrossRef CAS PubMed.
- B. Ovez, S. Ozgen and M. Yuksel, Process Biochem., 2006, 41, 1539–1544 CrossRef CAS.
- L. Shao, Z. Xu, W. Jin and H. Yin, Pol. J. Environ. Stud., 2009, 18, 693–699 CAS.
- W. J. B. Saliling, P. W. Westerman and T. M. Losordo, Aquacult. Eng., 2007, 37, 222–233 CrossRef.
- M. I. M. Soares and A. Abeliovich, Water Res., 1998, 32, 3790–3794 CrossRef CAS.
- C. Della Rocca, V. Belgiorno and S. Meriç, Water SA, 2007, 31, 229–236 CrossRef.
- D. Zhang and P. C. Quantick, Postharvest Biol. Technol., 1997, 12, 195–202 CrossRef CAS.
- S. Mitra and P. Pathak, III International Symposium on Longan, Lychee, and other Fruit Trees in Sapindaceae Family, 2008, vol. 863, pp. 29–36 Search PubMed.
- H. Li, Z. M. Zhou, Q. S. Liu, H. B. Dong, Y. F. Duan, C. H. Li, J. S. Zhang and H. X. Tan, RSC Adv., 2015, 5, 92836–92842 RSC.
- G. K. Athira and A. N. Jyothi, Starch-Starke, 2015, 67, 549–558 CrossRef CAS.
- S. Wang, B. Zhou, Y. Wang and B. Li, Food Res. Int., 2015, 67, 111–116 CrossRef CAS.
- J. Li, T. Ye, B. Zhou and B. Li, RSC Adv., 2014, 4, 22251–22254 RSC.
- Y. Zhou, D. Zhao, C. G. Winkworth-Smith, T. J. Foster, S. Nirasawa, E. Tatsumi and Y. Cheng, Carbohydr. Polym., 2015, 116, 182–188 CrossRef CAS PubMed.
- Y. Zhou, C. G. Winkworth-Smith, Y. Wang, J. Liang, T. J. Foster and Y. Cheng, Carbohydr. Polym., 2014, 114, 357–364 CrossRef CAS PubMed.
- ASTM, Standard practice for the preparation of substitute ocean water, 1998, pp. 1141–1998 Search PubMed.
- E. W. Rice, L. Bridgewater and A. P. H. Association, Standard methods for the examination of water and wastewater, American Public Health Association, Washington, DC, 2012 Search PubMed.
- M. C. Gutierrez, M. L. Ferrer and F. del Monte, Chem. Mater., 2008, 20, 634–648 CrossRef CAS.
- X. Du, J. Li, J. Chen and B. Li, Food Res. Int., 2012, 46, 270–278 CrossRef CAS.
- H. Zhang, M. Yoshimura, K. Nishinari, M. A. K. Williams, T. J. Foster and I. T. Norton, Biopolymers, 2001, 59, 38–50 CrossRef CAS PubMed.
- C. Wu, S. Peng, C. Wen, X. Wang, L. Fan, R. Deng and J. Pang, Carbohydr. Polym., 2012, 89, 497–503 CrossRef CAS PubMed.
- J. Chen, C. Liu, Y. Chen, Y. Chen and P. R. Chang, Carbohydr. Polym., 2008, 74, 946–952 CrossRef CAS.
- X. Wen, X. Cao, Z. Yin, T. Wang and C. Zhao, Carbohydr. Polym., 2009, 78, 193–198 CrossRef CAS.
- J. Li, T. Ye, X. Wu, J. Chen, S. Wang, L. Lin and B. Li, Food Hydrocolloids, 2014, 40, 9–15 CrossRef CAS.
- S. B. Nair and A. N. Jyothi, Starch-Starke, 2013, 65, 273–284 CrossRef CAS.
- Z. Shen and J. Wang, Bioresour. Technol., 2011, 102, 8835–8838 CrossRef CAS PubMed.
- W. Wu, F. Yang and L. Yang, Bioresour. Technol., 2012, 118, 136–140 CrossRef CAS PubMed.
- L. Foglar and F. Briški, Process Biochem., 2003, 39, 95–103 CrossRef CAS.
- B. Ovez, Process Biochem., 2006, 41, 1289–1295 CrossRef CAS.
Footnotes |
| † Electronic supplementary information (ESI) available. See DOI: 10.1039/c6ra28447g |
| ‡ These authors contributed to the work equally and should be regarded as co-first authors. |
| This journal is © The Royal Society of Chemistry 2017 |

