 Open Access Article
Creative Commons Attribution 3.0 Unported Licence
Low-cost and massive preparation of nitrogen-doped porous carbon for supercapacitor application†
Yanxia Haoab,
Feng Xuab,
Meng Qianab,
Jijian Xua,
Wei Zhaoa and
Fuqiang Huang *ac
*ac
aState Key Laboratory of High Performance Ceramics and Superfine Microstructure, Shanghai Institute of Ceramics, Chinese Academy of Sciences, Shanghai 200050, P. R. China. E-mail: huangfq@mail.sic.ac.cn
bUniversity of Chinese Academy of Sciences, 19 Yuquan Road, Beijing 100049, P. R. China
cBeijing National Laboratory for Molecular Sciences and State Key Laboratory of Rare Earth Materials Chemistry and Applications, College of Chemistry and Molecular Engineering, Peking University, Beijing 100871, P. R. China
First published on 10th February 2017
Abstract
It is difficult for current supercapacitor electrode materials to meet the growing need for energy storage, considering their complicated preparation methods and high costs. Massive preparation strategies are of great importance for preparing low cost materials with good performance for supercapacitor applications. Herein, we developed a novel double crucible method to synthesize nitrogen-doped porous carbon (NPC) from natural flour in the molten salt of LiCl/KCl at 650 °C. The NPC material has large specific surface area (585 m2 g−1) and high nitrogen doping content (6.5%). When used as an active supercapacitor electrode material, it exhibits a specific capacitance of 261 F g−1 at 1 A g−1 in 1 M H2SO4 and 94% capacitance retention at 15 A g−1 after 10![[thin space (1/6-em)]](https://www.rsc.org/images/entities/char_2009.gif) 000 cycles. The new synthetic method is promising for application in massive production of nitrogen-doped porous carbon for energy storage.
000 cycles. The new synthetic method is promising for application in massive production of nitrogen-doped porous carbon for energy storage.
Introduction
Energy storage devices that possess both high energy and power densities are highly desirable in view of the numerous applications of electronic devices and electric vehicles. Compared to other energy storage devices, such as lithium-ion batteries, supercapacitors can exhibit high power density, rapid charging and discharging rates and superior cycle life. Hence, supercapacitors are emerging as one of the most promising types of energy-storage devices.1,2 Based on their energy storage mechanisms, supercapacitors can be divided into electrical double layer capacitors (EDLC) and pseudocapacitors.3,4 Carbon materials, such as activated carbon,5,6 carbon nanotubes,7 graphene and its derivatives8,9 have been extensively used to fabricate supercapacitor electrodes due to their high specific surface area, excellent conductivity and stability. In carbon-based supercapacitors, charge is stored between carbon electrode/electrolyte interfaces to form the EDLC. However, the relatively low EDLC cannot satisfy the actual application.10–12 Present studies show that doping the carbon-based materials with certain types of heteroatoms (nitrogen, sulfur and fluorine) leads to a reversible faradaic reaction between the heteroatoms and electrolytes, thus endowing additional pseudo-capacitance properties.13,14 Among the different functional groups, which have been incorporated, the redox active pyridine and pyrrole N species have been demonstrated to be highly effective in increasing capacitance.15–17 Therefore, nitrogen atom doping promises to be an important method to improve the performance of the supercapacitor.To date, tremendous effort has been made to improve the capacitance of carbon materials by increasing specific surface area and nitrogen content. For example, Ruoff et al. have reported the development of porous graphene with high specific surface area (3100 m2 g−1) via KOH activation, which exhibited excellent performance in supercapacitors.9 Nitrogen-doped ordered mesoporous carbon (OMFLC-N) with a record specific capacitance of 855 F g−1 has also been reported recently by our team.1 Despite the significant progress of various carbon materials for supercapacitors, cost and production are always crucial factors for industrial large-scale production. These factors add to the complex preparation processes and environmental issues.18,19 The preparation of carbon materials with high specific surface areas and high active nitrogen contents by massive and low-cost methods remains challenging. Recently, the molten salt method has attracted attention due to its simple one-step preparation process and the variety of salts that can be employed. For example, Alshawabkeh et al. reported the preparation of capacitive carbon from waste biomass using molten K2CO3–Na2CO3.20 Antonietti et al. also obtained porous carbon materials using molten ZnCl2 and other salt mixtures.21 In general, molten salts with low melting points can act as activation media for the synthesis of porous carbon materials that are promising for energy storage applications.
Herein, we report a massive and low-cost synthesis of nitrogen-doped porous carbon (NPC) from natural flour via a simple double crucible method, which uses molten LiCl/KCl at 650 °C. The structure of the two crucibles can effectively reduce nitrogen loss and achieve mass production. Molten salt (LiCl/KCl) was used as liquid solvent and activation media. A high level of nitrogen-doping (6.5%) can be realized by introducing LiNO3 as nitrogen source. The optimized nitrogen-doped porous carbon delivered a maximum capacitance of 261 F g−1 at a current density of 1 A g−1 in 1 M H2SO4 electrolyte. Hence, porous carbon synthesized by this method can be regarded as a potential electrode material for supercapacitors.
Experimental
Materials
The flour and angel yeast were bought from a supermarket near the Shanghai Institute of Ceramics. LiCl and KCl were purchased from Aladdin Reagent Co. Ltd (Shanghai, China); these salts were combined in a 45/55 mass ratio, and the mixture had a melting point of 352 °C. LiNO3 was purchased from Sigma Reagent Co. Ltd (Shanghai, China). Water used in this experiment was deionized (Millipore Co. Ltd). All chemicals were used as received without any further purification.Synthesis of nitrogen-doped porous carbon
The flour was converted into the form of porous bread in advance of the subsequent carbonization and activation steps. First, 0.4 g angel yeast and 13 ml deionized water were mixed homogeneously. Then, the flour paste was obtained by slowly pouring the mixed liquid into 20 g flour, followed by kneading by hand. After 50 minutes of fermentation at 38 °C, the flour paste was transferred into an oven at 180 °C for 40 minutes and then taken out for natural cooling.Nitrogen-doped porous carbon (NPC) materials were prepared via a double crucible method in a muffle furnace. In a typical process, the porous bread was first placed in an oven to dry for 12 h at 80 °C. Then, 0.5 g of dried bread was ground into powder with metal chloride salts (LiCl/KCl) in the weight ratio of bread/(LiCl + KCl) = 1![[thin space (1/6-em)]](https://www.rsc.org/images/entities/char_2009.gif) :
:![[thin space (1/6-em)]](https://www.rsc.org/images/entities/char_2009.gif) 10. LiNO3 was also introduced into the molten salt as the activating agent and nitrogen source; the amount was set at 0 g, 0.25 g, and 0.5 g (the corresponding prepared carbon materials were termed as NPC-0, NPC-0.25, and NPC-0.5). For comparison, we also conducted the experiment without any LiCl/KCl molten salt, termed as PC. The homogeneous mixture was put into a ceramic crucible and covered with a ceramic lid. Then, the small crucible was placed inside a larger one, with graphite powder filled in the space between two crucibles to avoid reactions of the materials with air. The double crucible was finally transferred to an oven and heated to the reaction temperature (650 °C) at a rate of 5 °C min−1 for 2 h. After natural cooling to ambient temperature, the as-obtained products were washed with a sufficient amount of hot water to dissolve the salts. The samples were collected via repeated filtration and further dried in a vacuum at 80 °C for 24 h.
10. LiNO3 was also introduced into the molten salt as the activating agent and nitrogen source; the amount was set at 0 g, 0.25 g, and 0.5 g (the corresponding prepared carbon materials were termed as NPC-0, NPC-0.25, and NPC-0.5). For comparison, we also conducted the experiment without any LiCl/KCl molten salt, termed as PC. The homogeneous mixture was put into a ceramic crucible and covered with a ceramic lid. Then, the small crucible was placed inside a larger one, with graphite powder filled in the space between two crucibles to avoid reactions of the materials with air. The double crucible was finally transferred to an oven and heated to the reaction temperature (650 °C) at a rate of 5 °C min−1 for 2 h. After natural cooling to ambient temperature, the as-obtained products were washed with a sufficient amount of hot water to dissolve the salts. The samples were collected via repeated filtration and further dried in a vacuum at 80 °C for 24 h.
Characterization
The morphology and microstructure were examined using a field emission Magellan 400 microscope (FEI Company) and a transmission electron microscope (JEOL 2011, operating at 200 kV). N2 adsorption/desorption isotherms of obtained materials were measured at 77 K by a Micromeritics Tristar 3000 system. All samples were degassed at 150 °C under vacuum for 10 h before the measurements. The specific surface area was calculated by Brunauer–Emmett–Teller (BET) method, and pore volume and pore size distribution plots were analysed from the adsorption branch of the isotherms using the non-linear density functional theory (NLDFT) model. Raman spectra were collected using a Thermal Dispersive Spectrometer using an excitation wavelength of 532 nm with a 10 MW laser. The surface chemical compositions of the samples were analysed using an X-ray photoelectron spectrometer (XPS) (VG Scientific ESCALAB Mark II spectrometer) with Al Kα radiation.Electrochemical measurements
For three-electrode electrochemical measurements, the working electrode was prepared by mixing the as-prepared NPC with PVDF in NMP to form a slurry. Then, the slurry was coated onto the 3D graphene foam, which, in advance, was adhered to the graphite plate with the binder. The obtained working electrodes were dried at 120 °C for 12 h in a vacuum oven. The mass loading of the active material was 1 mg. The electrochemical tests were performed at room temperature using CHI 760 electrochemical workstation with a three-electrode system in 1 M H2SO4 aqueous solution. An Ag/AgCl electrode and Pt wire served as the reference and counter electrodes, respectively. Cyclic voltammetry (CV) and galvanostatic charging–discharging (GCD) were tested over the voltage range −0.2 to 0.8 V. Electrochemical impedance spectroscopy (EIS) was carried out with an amplitude of 5 mV in the frequency from 0.01 Hz to 100 kHz.Gravimetric specific capacitance (Cg) values of the electrodes were calculated from GCD curves using the following equation,
| Cg = Idt/mdV |
Results and discussion
The NPC samples were prepared by a simple double crucible method as illustrated in Fig. 1a. The placement of graphite between the two crucibles effectively protects samples from air and minimizes nitrogen loss. Flour, which is a common raw food material consisting mainly of starch (72–80%) and protein (8–12%), can be used for the economical synthesis of various carbon-based materials.22 In this study, flour was made into porous bread as an intermediate step. Bread has fixed porous structure,23 which is beneficial for the subsequent reaction process. A LiCl/KCl mixture was used as the molten salt. LiNO3, which can react with carbon atoms at high temperature, was used as an activating agent and nitrogen source to obtain nitrogen-doped porous carbon.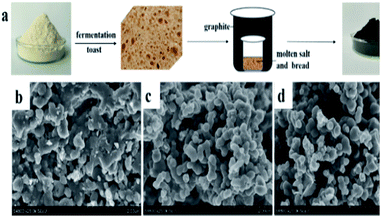 | ||
| Fig. 1 (a) Schematic synthesis of NPC samples and SEM images of NPC-0 (b), NPC-0.25 (c) and NPC-0.5 (d). | ||
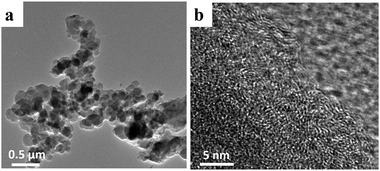
Fig. 1b–d show SEM images of the NPC-0, NPC-0.25 and NPC-0.5 samples. Clearly, NPC-0.25 and NPC-0.5 exhibit similar connected irregular particles with diameters less than 500 nm. NPC-0, which was prepared without the addition of LiNO3, shows a more compact structure. This demonstrates that LiNO3 can react with carbon materials and be used as an activating agent. SEM images with higher magnification (Fig. S1a–c†) more clearly show the carbon particles and the pore channels that resulted from the connection of these particles. As seen in Fig. S2,† the PC sample prepared without LiCl/KCl molten salt exists in the form of large blocks, relative to the NPC samples. Overall, we have shown that the aggregation of small particles can generate abundant pore channels and result in high specific surface area, which may have great significance for energy storage. The TEM image of NPC-0.5 (Fig. 2a) similarly shows the aggregation of small, irregular particles which is consistent with the SEM images. The high-resolution TEM micrograph of NPC-0.5 (Fig. 2b) shows that the sample is partially graphitized.
N2 adsorption–desorption isotherm analysis were performed on the obtained samples to determine their specific surface areas and pore size distributions. Fig. 3a shows isotherms of similar shape, which can be identified as type IV according to the International Union of Pure and Applied Chemistry.24 The specific surface areas (SSA) obtained using the Brunauer–Emmett–Teller (BET) model are 262 m2 g−1, 328 m2 g−1 and 585 m2 g−1 for NPC-0, NPC-0.25 and NPC-0.5, respectively (Table 1). All the curves show sharp increases over low relative pressures, indicating that those materials have abundant micropores. The micropore SSAs of the NPC samples are also shown in Table 1. Furthermore, a long small hysteresis loop can be seen at intermediate relative pressures in each curve, suggesting that the NPC samples contain some mesopores as well (Fig. 3a and S3a†).25 However, the PC sample prepared without any molten LiCl/KCl exhibits a relatively low SSA of 82 m2 g−1 and low pore volume (Fig. S3b†), thus demonstrating the effectiveness of LiCl/KCl as an activation media for pore formation. Pore size distribution (PSD) results for the NPC samples (Fig. 3b) show that the pore diameter is about 0.5 to 2 nm. The micropore volume is 0.09 cm3 g−1, 0.12 cm3 g−1 and 0.23 cm3 g−1 for NPC-0, NPC-0.25 and NPC-0.5, respectively (Table 1), suggesting that LiNO3 can react with carbon atoms at high temperature to create pores, particularly micropores.
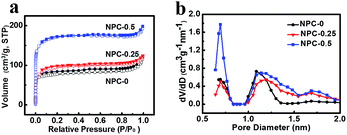 | ||
| Fig. 3 N2 absorption–desorption isotherm (a) and pore size distribution of NPC-0, NPC-0.25 and NPC-0.5 (b). | ||
| Sample | LiNO3 (g) | N (%) | SBET (m2 g−1) | Sc (m2 g−1) | Vta (cm3 g−1) | Vmb (cm3 g−1) |
|---|---|---|---|---|---|---|
| a The total pore volume for pores with diameter less than 353.8717 nm at P/P0 = 0.994.b DFT microspore volume.c The micropore specific surface area. | ||||||
| NPC-0 | 0 | 1.58 | 262 | 188 | 0.18 | 0.09 |
| NPC-0.25 | 0.25 | 4.78 | 328 | 205 | 0.20 | 0.12 |
| NPC-0.5 | 0.5 | 6.53 | 585 | 427 | 0.30 | 0.23 |
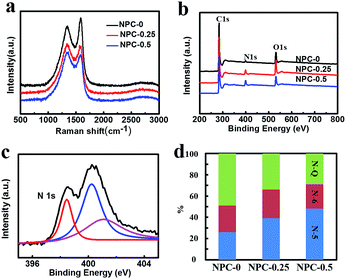
Fig. 4a shows the Raman spectra of the obtained carbon samples. The characteristic peaks located at approximately 1350 cm−1 and 1580 cm−1 are attributed to the D and G bands of the carbon materials, respectively. The G band represents the degree of graphitization, whereas the D band indicates the levels of disorder and defects in carbon materials.26 Hence the intensity ratio IG/ID is directly proportional to the degree of the graphitization and inversely proportional to disorder. As can be seen in Fig. 4a, the IG/ID ratios of NPC-0, NPC-0.25 and NPC-0.5 are 1.31, 0.95 and 0.91, respectively. This trend may be a result of increasing activation via reaction of LiNO3 and carbon atoms, which creates more defects in the carbon materials.
XPS was used to determine the surface elemental compositions of these carbon-based materials. All the samples show similar C, N and O peaks (Fig. 4b). The peak intensities, presented in Table 1, can be used to estimate relative content of the three elements. It is notable that NPC-0, which was synthesized without LiNO3, still has a nitrogen content of 1.85%, which is probably due to protein in the flour we used. More importantly, the sample with the most LiNO3 added, NPC-0.5, had the highest nitrogen content of 6.53%. This result suggests that LiNO3 can effectively serve as a nitrogen source as well as activating agent, as mentioned earlier. High-resolution N1s spectra for all NPC samples are shown in Fig. 4c and S4.† The figures show that the N1s peak could be fitted with three different peaks including pyridine N (N-6, 398 eV), pyrrole N (N-5, 400 eV) and graphitization N (N-Q, 401 eV). The contents of the three different forms of nitrogen in the NPC-0, NPC-0.25 and NPC-0.5 samples are shown in Fig. 4d. We can see that NPC-0.5 possesses a high pyridine N and pyrrole N content of 71%, which can contribute to capacitance via Faraday reaction for a supercapacitor.27,28
Electrochemical properties
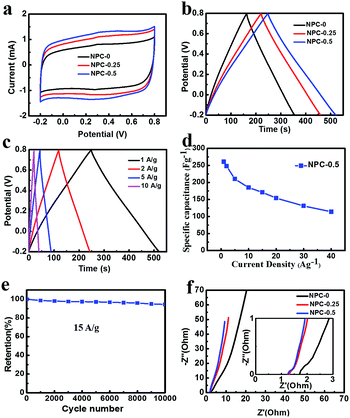
The NPC material with high nitrogen doping content and specific surface area can be a good candidate for supercapacitor electrode material. Fig. 5a shows CV curves (measured at a scan rate of 5 mV s−1 over the range −0.2–0.8 V) for the NPC-0, NPC-0.25 and NPC-0.5 materials. Clearly, all the samples reveal a quasi-rectangular shape, suggesting ideal double-layer capacitance behavior.29 The CV curve of NPC-0.5 had the largest area among all the samples. The observation that this sample had the highest capacitance may have been due to its possession of the highest specific surface area and nitrogen content. Fig. S5† gives the CV curves with different scan rates of all the NPC samples. Clearly, the CV curves of NPC-0.5 present a quasi-rectangular shape, without a sharp variation even at a high scan rate of 500 mV s−1, indicating excellent capacitive behavior.30,31Fig. 5b shows the galvanostatic charging–discharging (GCD) curves of NPC samples at a current density of 1 A g−1. The specific capacitance for NPC-0, NPC-0.25 and NPC-0.5 are 185 F g−1, 220 F g−1 and 261 F g−1 respectively, which is consistent with the CV tests. The specific capacitance (261 F g−1) of sample NPC-0.5 is higher than the previously reported nitrogen-doped carbon and porous carbon materials prepared by a molten salt method.20,32–34 The GCD curves of NPC-0, NPC-0.25 and NPC-0.5 at different current densities are presented in Fig. 5c and S6a and b.† The symmetrical triangular shape curves at different current densities imply good charge–discharge performance, which means excellent electrochemical reversibility. In addition, the GCD curves of PC sample without any molten salt are also shown in Fig. S6c.† Clearly, the PC sample exhibits a low specific capacitance of 45 F g−1, which may result from the poor pore structure and low specific surface area. Fig. 5d shows the specific capacitance of NPC-0.5 from GCD curves at different current densities. As can be seen, the sample can keep 71% of its capacitance retention at 15 A g−1, which indicates good rate performance.
To explore cycle stability of NPC-0.5 electrode material, continuous GCD process was conducted at a current density of 15 A g−1 (Fig. 5e). About 94% of specific capacitance was retained after 10![[thin space (1/6-em)]](https://www.rsc.org/images/entities/char_2009.gif) 000 cycles, implying good cycling stability. Fig. 5f shows electrochemical impedance spectroscopy (EIS) of the NPC samples. As can be seen, the equivalent series resistances (ESR) of NPC-0.25 and NPC-0.5 are smaller than NPC-0 at high frequency in the enlarged plot in Fig. 5f. Furthermore, the nearly upright lines at low frequency indicate ideal double-layer capacitance behaviour for NPC-0.25 and NPC-0.5. As discussed above, the NPC-0.5 and NPC-0.25 materials have better pore channels, which is beneficial for charge transportation and capacitive behaviour.
000 cycles, implying good cycling stability. Fig. 5f shows electrochemical impedance spectroscopy (EIS) of the NPC samples. As can be seen, the equivalent series resistances (ESR) of NPC-0.25 and NPC-0.5 are smaller than NPC-0 at high frequency in the enlarged plot in Fig. 5f. Furthermore, the nearly upright lines at low frequency indicate ideal double-layer capacitance behaviour for NPC-0.25 and NPC-0.5. As discussed above, the NPC-0.5 and NPC-0.25 materials have better pore channels, which is beneficial for charge transportation and capacitive behaviour.
Conclusion
In conclusion, we demonstrated that nitrogen-doped porous carbon (NPC) materials for application in supercapacitors can be prepared from flour using a massive and low-cost double crucible synthetic method. The method used a LiCl/KCl molten salt and LiNO3 was used as activation agent and nitrogen source for reaction with carbon atoms. The best sample obtained has a high nitrogen content of 6.5% and high specific capacitance of 261 F g−1 at 1 A g−1 in 1 M H2SO4 electrolyte.Acknowledgements
Financial support from the National Key Research and Development Program (Grant No. 2016YFB0901600), NSF of China (Grants 61376056, 51672301 and 51672295), Science and Technology Commission of Shanghai (Grants 14520722000, 16ZR1440500 and 16JC1401700), Shanghai Science and Technology Development Funds (Grant 16QA1404200), Key Research Program of Chinese Academy of Sciences (Grant KGZD-EW-T06) and Youth Innovation Promotion Association CAS, is acknowledged.Notes and references
- T. Lin, I. W. Chen, F. Liu, C. Yang, H. Bi, F. Xu and F. Huang, Science, 2015, 350, 1508–1513 CrossRef CAS PubMed.
- Z. S. Wu, K. Parvez, X. Feng and K. Müllen, Nat. Commun., 2013, 4, 2487 Search PubMed.
- H. Jiang, P. S. Lee and C. Li, Energy Environ. Sci., 2013, 6, 41–53 CAS.
- Z. Fan, J. Yan, T. Wei, L. Zhi, G. Ning, T. Li and F. Wei, Adv. Funct. Mater., 2011, 21, 2366–2375 CrossRef CAS.
- V. Ganesh, S. Pitchumani and V. Lakshminarayanan, J. Power Sources, 2006, 158, 1523–1532 CrossRef CAS.
- L. Li, E. Liu, J. Li, Y. Yang, H. Shen, Z. Huang and W. Li, J. Power Sources, 2010, 195, 1516–1521 CrossRef CAS.
- K. H. An, W. S. Kim, Y. S. Park, J. M. Moon, D. J. Bae, S. C. Lim and Y. H. Lee, Adv. Funct. Mater., 2001, 11, 387–392 CrossRef CAS.
- Z. Fan, J. Yan, L. Zhi, Q. Zhang, T. Wei, J. Feng and F. Wei, Adv. Mater., 2010, 22, 3723–3728 CrossRef CAS PubMed.
- Y. Zhu, S. Murali, M. D. Stoller, K. J. Ganesh, W. Cai, P. J. Ferreira and R. S. Ruoff, Science, 2011, 332, 1537–1541 CrossRef CAS PubMed.
- A. G. Pandolfo and A. F. Hollenkamp, J. Power Sources, 2006, 157, 11–27 CrossRef CAS.
- Y. Lv, F. Zhang, Y. Dou, Y. Zhai, J. Wang, H. Liu and D. Zhao, J. Mater. Chem., 2012, 22, 93–99 RSC.
- L. L. Zhang, X. Zhao, M. D. Stoller, Y. Zhu, H. Ji, S. Murali and R. S. Ruoff, Nano Lett., 2012, 12, 1806–1812 CrossRef CAS PubMed.
- J. P. Paraknowitsch and A. Thomas, Energy Environ. Sci., 2013, 6, 2839–2855 CAS.
- H. Guo and Q. Gao, J. Power Sources, 2009, 186, 551–556 CrossRef CAS.
- H. M. Jeong, J. W. Lee, W. H. Shin, Y. J. Choi, H. J. Shin, J. K. Kang and J. W. Choi, Nano Lett., 2011, 11, 2472–2477 CrossRef CAS PubMed.
- X. Y. Chen, C. Chen, Z. J. Zhang, D. H. Xie, X. Deng and J. W. Liu, J. Power Sources, 2013, 230, 50–58 CrossRef CAS.
- L. F. Chen, X. D. Zhang and H. W. Liang, ACS Nano, 2012, 6, 7092–7102 CrossRef CAS PubMed.
- H. Bi, I. W. Chen, T. Lin and F. Huang, Adv. Mater., 2015, 27, 5943–5949 CrossRef CAS PubMed.
- C. Vix-Guterl, E. Frackowiak, K. Jurewicz, M. Friebe, J. Parmentier and F. Béguin, Carbon, 2005, 43, 1293–1302 CrossRef CAS.
- H. Yin, B. Lu, Y. Xu and A. N. Alshawabkeh, Environ. Sci. Technol., 2014, 48, 8101–8108 CrossRef CAS PubMed.
- N. Fechler, T. P. Fellinger and M. Antonietti, Adv. Mater., 2013, 25, 75–79 CrossRef CAS PubMed.
- X. Wu, L. Jiang, C. Long and Z. Fan, Nano Energy, 2015, 13, 527–536 CrossRef CAS.
- Y. Ye, Y. Ding and C. Wang, ACS Appl. Mater. Interfaces, 2016, 8, 16852–16861 Search PubMed.
- C. Zheng, X. Zhou, H. Cao, G. Wang and Z. Liu, J. Power Sources, 2014, 258, 290–296 CrossRef CAS.
- Z. F. Li, H. Zhang, Q. Liu, L. Sun, L. Stanciu and J. Xie, ACS Appl. Mater. Interfaces, 2013, 5, 2685–2691 CAS.
- X. C. Dong, H. Xu, X. W. Wang, Y. X. Huang, M. B. Chan-Park, H. Zhang and P. Chen, ACS Nano, 2012, 6, 3206–3213 CrossRef CAS PubMed.
- B. You, L. Wang, L. Yao and J. Yang, Chem. Commun., 2013, 49, 5016–5018 RSC.
- Y. Lu, F. Zhang, T. Zhang, K. Leng, L. Zhang, X. Yang and Y. Chen, Carbon, 2013, 63, 508–516 CrossRef CAS.
- C. Largeot, C. Portet, J. Chmiola, P. L. Taberna, Y. Gogotsi and P. Simon, J. Am. Chem. Soc., 2008, 130, 2730–2731 CrossRef CAS PubMed.
- W. Xing, S. Z. Qiao, R. G. Ding, F. Li, G. Q. Lu, Z. F. Yan and H. M. Cheng, Carbon, 2006, 44, 216–224 CrossRef CAS.
- L. L. Zhang and X. S. Zhao, Chem. Soc. Rev., 2009, 38, 2520–2531 RSC.
- J. Wang, B. Ding, X. Hao and Y. Xu, Carbon, 2016, 102, 255–261 CrossRef CAS.
- X. Deng, B. Zhao, L. Zhu and Z. Shao, Carbon, 2015, 93, 48–58 CrossRef CAS.
- B. Lu, L. Hu, H. Yin, W. Xiao and D. Wang, RSC Adv., 2016, 6, 106485–106490 RSC.
Footnote |
| † Electronic supplementary information (ESI) available. See DOI: 10.1039/c6ra28354c |
| This journal is © The Royal Society of Chemistry 2017 |

