 Open Access Article
Enhancement of As(V) adsorption from aqueous solution by a magnetic chitosan/biochar composite
Shaobo Liuab,
Binyan Huang *cd,
Liyuan Chaia,
Yunguo Liu
 cd,
Guangming Zengcd,
Xin Wange,
Wei Zengcd,
Meirong Shangcd,
Jiaqin Dengcd and
Zan Zhoucd
aSchool of Metallurgy and Environment, Central South University, Changsha 410083, P. R. China
bSchool of Architecture and Art, Central South University, Changsha 410083, P. R. China
cCollege of Environmental Science and Engineering, Hunan University, Changsha 410082, P. R. China. E-mail: hby617125216@163.com; Fax: +86 731 88822829; Tel: + 86 731 88649208
dKey Laboratory of Environmental Biology and Pollution Control, Hunan University, Ministry of Education, Changsha 410082, P. R. China
eCollege of Resources and Environmental Science, Hunan Normal University, Changsha 410006, P. R. China
First published on 10th February 2017
Abstract
In this study, a magnetic chitosan/biochar composite (MCB) was prepared successfully, and characterized by SEM, TEM, VSM, XRD, FTIR, XPS, and zeta-potential to obtain its physical and chemical properties. The influence of different sorption parameters such as pH, contact time, initial As(V) concentration, and temperature on As(V) removal were studied thoroughly in order to optimize the reaction conditions. The results showed that the MCB adsorbed more As(V) (11.961 mg g−1) than pristine biochar (3.681 mg g−1). In addition, the adsorption behavior could be well described by a pseudo-second-order and Langmuir model. Thermodynamic parameters revealed that the sorption reaction was a spontaneous and endothermic process. The adsorbed MCB could be effectively regenerated by 1.0 mol L−1 NaOH, and the adsorption capacity decreased from 11.823 to 8.078 mg g−1 in five cycles. In conclusion, MCB could be used as an efficient adsorbent for environment purification and conveniently separated from aqueous solution after adsorption.
1. Introduction
Arsenic (As) is known as one of the most toxic chemical elements at very low concentrations, contamination of natural waters by inorganic arsenic (As) has dire consequences for public health all around the world because of its potential synonymy with toxicity.1,2 The release of As can occur naturally from geothermal and groundwater,3 or by anthropogenic activities, such as mining,4 feed additives5 and wood preservation.6 High As concentrations in groundwater have been found in Argentina, Bangladesh, Chile, China, Hungary, Mexico, West Bengal (India), and Vietnam.7,8 Ingestion of arsenic contaminated drinking water can result in both skin cancer and internal cancers, particularly of the lung and urinary tract.9 The predominant form of inorganic arsenic commonly found in natural waters were oxyanions of trivalent arsenite (AsO33−, As(III)) and pentavalent arsenate (AsO43−, As(V)).10 Although, As(V) tends to be less toxic compared with As(III), it is thermodynamically more stable due to which it predominates under normal conditions. Therefore, removal of As(V) is potentially important as As(III) irrespective of toxicity,11 and removing As effectively from water supplies is essential to protecting environmental and human health.Several methods have been developed to remove arsenic from water, such as, membrane technologies,12 ion exchange,13 oxidation/reduction,14 oxidation–coagulation15 and adsorption.16 Among these techniques, the adsorption process is considered one of most promising techniques because it is economical, effective, and no sludge disposal. Various types of sorbents have been developed and applied for water treatment during the past few decades.17
Compared with conventional carbonaceous materials such as commercial activated carbon, the primary advantages of biochar are its low cost and a wealth of sources of biomass.18,19 However, pristine biochar prepared from biomass feedstock without any treatment have relatively low heavy metal sorption capacity, and their sorption for aqueous As, which is in anionic forms of either arsenate (As(V)) or arsenite (As(III)), is relatively low due to most of biochar are predominantly net negatively charged on the surface.20 Several methods have thus been developed to modify biochar to enhance its sorption for As. Chitosan is another sorbent that has been widely used to remove water pollutants because it is abundant, renewable, biodegradable and non-toxic in nature.21 It is characterized by both large sorption capacity owing to the position of –OH and –NH2 groups and high hydrophilicity with a large number of hydroxyl groups of glucose units and the presence of a large number of functional groups (acetamido, primary amino and/or hydroxyl groups).22,23 Using chitosan modified biochar could show good performance to improve the adsorption ability of As(V).
Although the chitosan/biochar composite exhibited good sorption ability, it is cannot be separated easily from aqueous solution. Magnetic fluids have the capability to treat large number of wastewater within a short time and can be conveniently separated from wastewater. What's more, the magnetic fluids can increase the number of adsorption sites and enhance the adsorption capacity for arsenic.24 Thus, coating chitosan with magnetic fluids can expand function of the chitosan, and the method has been reported that it can improve the surface area for adsorption.25 Therefore, the magnetic chitosan modified with biochar could not only enhance the sorption ability but also be magnetically collected after adsorption.
The objective of this paper focused on enhancing the As(V) removal ability by the magnetic chitosan/biochar composite (MCB). The samples were characterized by Fourier transform infrared (FTIR), scanning electron microscope (SEM), transmission electron microscopy (TEM), vibrating sample magnetometry (VSM), X-ray photoelectron spectroscopy (XPS), X-ray diffraction (XRD) and zeta potential. In addition, kinetic, isothermal and thermodynamic analysis have been conducted in this paper. The desorption/regeneration properties of MCB were investigated to determine the reusability of adsorbent and evaluate the economic feasibility. The As(V) removal mechanisms was investigated by XPS analysis.
2. Materials and methods
2.1 Materials
All chemicals used in this study were purchased at analytical reagent grade and without any further purification. Rice straw (RS), the source of biomass, was obtained from Zhuzhou, Hunan province, China. Chitosan (95% acetylation degree) was provided by Hefei Bomei Biotechnology Co., Ltd. Glutaraldehyde was supplied by Sonopharm Chemical Reagent Co., Ltd. The disodium hydrogen arsenate heptahydrate (Na2HAsO4·7H2O) was purchased from Sigma Aldrich with a purity higher than 98%. The stock solution of 100 mg L−1 As(V) was prepared by dissolving 0.4165 g Na2HAsO4·7H2O in 1 L ultra-water, and the required concentrations were obtained by diluting the stock solution with deionized water.2.2 Preparation of adsorbent
The biomass was air-dried for two days, and subsequently oven-dried at 60 °C for 48 h. By pyrolysis of the biomass in a tube furnace at 450 °C with a heating rate of 5 °C min−1 under N2 atmosphere for 2 h, the obtained biochar was ground and sieved through 150-mesh screen.Magnetic fluid was prepared by co-precipitation method according to the former study.26 Briefly, Fe2+ and Fe3+ (molar ratio 2![[thin space (1/6-em)]](https://www.rsc.org/images/entities/char_2009.gif) :
:![[thin space (1/6-em)]](https://www.rsc.org/images/entities/char_2009.gif) 3) solution were added into the beaker with stirring at 55 °C and then dropwise NaOH solution with constant stirring for 10 min until pH reached 9.0. After adjusting the temperature of the reaction vessels to 65 °C, 0.8 mL Tween 80 was added into the mixture with stirring for another 30 min, and adjusted the pH value to 7.0. Then, the product was washed with Milli-Q water three times and was dispersed in ultrasonic device for 40 min. Finally, the solution was diluted to obtain magnetic fluid (40 g L−1).
3) solution were added into the beaker with stirring at 55 °C and then dropwise NaOH solution with constant stirring for 10 min until pH reached 9.0. After adjusting the temperature of the reaction vessels to 65 °C, 0.8 mL Tween 80 was added into the mixture with stirring for another 30 min, and adjusted the pH value to 7.0. Then, the product was washed with Milli-Q water three times and was dispersed in ultrasonic device for 40 min. Finally, the solution was diluted to obtain magnetic fluid (40 g L−1).
The magnetic chitosan modified with biochar (MCB) was synthesized as follow: 2.0 g chitosan was dissolved in 100 mL 2% acetic solution with stirring. Next, 10 mL magnetic fluid was added dropwise into the solution with constantly stirring for 30 min in a water bath at 50 °C. Then 1.0 g biochar was added with constantly stirring for another 60 min. After that, 4 mL glutaraldehyde was injected into the reaction system to form the gel and the pH of the reaction system was adjusted to 8.0–10.0. Finally, the mixture was kept in a water bath for a further 1 h. The precipitate were washed until the pH was about 7, and was dried at 60 °C, and sieved. The composite of chitosan modified with biochar (CB) was synthesized via the preparation of MCB without adding magnetic fluid.
2.3 Characterization and investigation of As(V) sorption by MCB
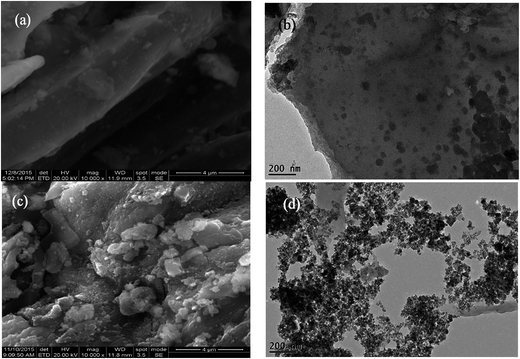
The morphologies of B and MCB were characterized by scanning electron microscopy (SEM) (JEOL JSM-6700. Japan) and transmission electron microscopy (TEM, Tecnai G2 F20, USA). The magnetization measurement of magnetic fluid and MCB were performed by vibrating sample magnetometer (VSM) (MPMS XL-7. America). The X-ray diffraction (XRD) patterns of CB and MCB were obtained by an X-ray diffractometer (Rigaku D/max-2500, Japan) with CuKα radiation. The Fourier transform infrared spectroscopy (FTIR) were measured on a spectrophotometer (Nicolet, Magna 550 spectrometer). Surface chemical composition of B, MCB were confirmed by an ESCALAB 250 Xi X-ray Photoelectron Spectrometer (XPS) (Thermo Fisher, USA). The iron ions concentrations were determined by a flame atomic absorption spectrometry (PerkinElmer AA700, USA). Zeta-potential of MCB was obtained from an Electroacoustic Spectrometer (ZEN3600 Zetasizer UK) under solution pH varying from 3.0 to 11.0.2.4 Sorption experiments
All batch experiments were carried out with 20 mg adsorbent in a 50 mL conical flask with 20 mL As(V) aqueous solutions on a rotary shaker at 150 rpm for specific time. The pH of initial solutions was adjusted by HCl or NaOH. After being mixed for 24 h, the mixture was drawn and separated immediately by an aid of external magnet, and the residual concentrations was determined by atomic fluorescence spectroscopy (AFS-9700, China). The adsorption amount removed by the adsorbent, qe (mg g−1) was calculated as follows:
 | (1) |
The effect of pH on sorption experiment by three different materials (B, CB, MCB) were carried out by varying pH value between 3.0 and 11.0 with 15 mg L−1 As(V) for 24 h, and the mixtures were shaken with a speed of 150 rpm for 24 h at 25 °C.
The kinetic experiments were performed with different time intervals (0, 5, 15, 30, 60, 90, 120, 180, 240, 360, 480, 600, 1020, 1440 min) at pH 5.0, and the other parameters kept constant.
The isotherm experiments were conducted by varying initial concentrations from 0.2 mg L−1 to 50 mg L−1 at three different temperatures (25, 35, 45 °C), and adjusted pH value to 5.0.
All the experimental treatments were performed in three samples and the average values were reported. The relative errors of the data were generally within 5%.
2.5 Desorption experiment
The detailed desorption experiment was implemented as follows: the adsorbent which used to adsorb As(V) was added into 20 mL 1.0 mol L−1 NaOH solution with a shaking speed 150 rpm at 25 °C for 24 h. The adsorbent was subsequently washed to neutral and collected for recycling.The resulted experimental data was obtained from the average of three measured value. The relative errors of the dada were within 5%.
3. Result and discussion
3.1 Characterization
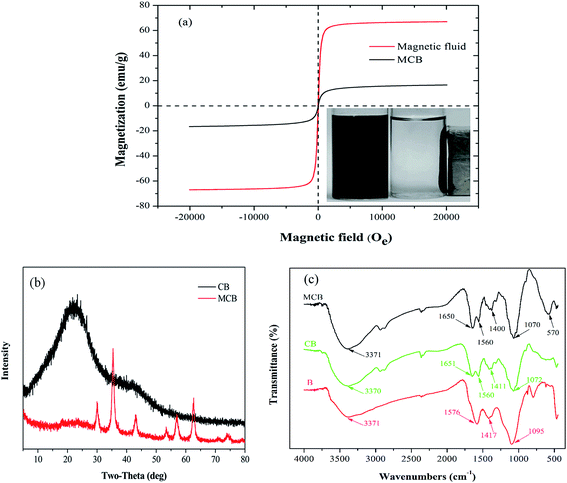
![[double bond, length as m-dash]](https://www.rsc.org/images/entities/char_e001.gif) O) and 3371 cm−1 (–OH) were observed from RS biochar.30 Similarly, in the FTIR spectra of CB, the same functional groups above mentioned were found around the corresponding wavenumber. However, the peak at 1576 cm−1 shift to 1560 cm−1 ascribed to the amide I (C
O) and 3371 cm−1 (–OH) were observed from RS biochar.30 Similarly, in the FTIR spectra of CB, the same functional groups above mentioned were found around the corresponding wavenumber. However, the peak at 1576 cm−1 shift to 1560 cm−1 ascribed to the amide I (C![[double bond, length as m-dash]](https://www.rsc.org/images/entities/char_e001.gif) O stretching) and a new peak was appeared at 1651 cm−1 ascribed to amide II (N–H blending modes), conforming that the carboxyl groups reacted with chitosan during the preparation of the composite.31 In addition, it was obviously to find the stretching vibration of Fe–O peak appeared at around 570 cm−1 in MCB spectrum, and the results confirmed that the MCB was prepared successfully.
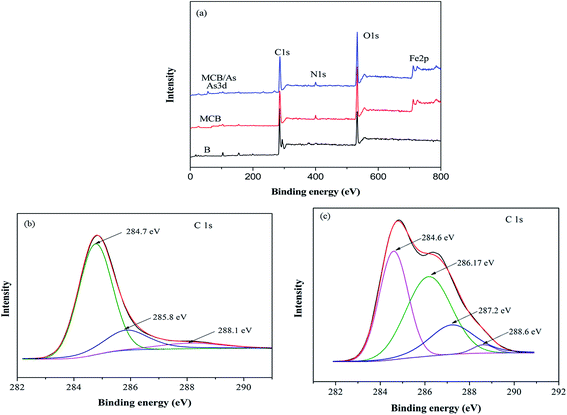
O stretching) and a new peak was appeared at 1651 cm−1 ascribed to amide II (N–H blending modes), conforming that the carboxyl groups reacted with chitosan during the preparation of the composite.31 In addition, it was obviously to find the stretching vibration of Fe–O peak appeared at around 570 cm−1 in MCB spectrum, and the results confirmed that the MCB was prepared successfully.![[double bond, length as m-dash]](https://www.rsc.org/images/entities/char_e001.gif) O (6.7%), respectively.31 However, the C 1s XPS spectrum of MCB in Fig. 3c could be well curve-fitted into four peak components around 284.6, 286.17, 287.2, and 288.6 eV, which was corresponded to C–C (37.2%), C–O (42.7%), C–N (18.0%), and –COOH (2.1%), respectively. The difference between biochar and MCB was probably originated from modifying magnetic chitosan with pristine biochar, and the results further confirmed that MCB was prepared successfully, which were consistent with the FTIR characterization.
O (6.7%), respectively.31 However, the C 1s XPS spectrum of MCB in Fig. 3c could be well curve-fitted into four peak components around 284.6, 286.17, 287.2, and 288.6 eV, which was corresponded to C–C (37.2%), C–O (42.7%), C–N (18.0%), and –COOH (2.1%), respectively. The difference between biochar and MCB was probably originated from modifying magnetic chitosan with pristine biochar, and the results further confirmed that MCB was prepared successfully, which were consistent with the FTIR characterization.
3.2 Effect of pH and comparison experiments
The pH value controls the interaction between adsorbate and adsorbents, which is predominant for the fractional species distribution of As(V) and the surface properties of adsorbents.32 From Fig. 4a, the maximum adsorption capacity of B (3.681 mg g−1), CB (10.600 mg g−1), and MCB (11.533 mg g−1) reached at pH 4.0, 3.0 and 5.0, respectively. For MCB, the sorption capacity increased slowly over the range of 3.0–5.0, and continually decreased from 5.0 to 10.0. This result can be interpreted as follows. In aqueous environment, there are two kind of arsenic species at pH range from 3.0 to 11.0, H2AsO4− is predominant when 3.0 < pH < 7.0, while HAsO42− is the main species at pH 7.0–11.0.33 That is to say the main speciation of As(V) is anionic. As shown in Fig. 4b, the pHpzc (point of zeta charge) of MCB was about 5.25. Under the condition pH < pHpzc, the adsorbent was positively charged, which was beneficial for MCB combination with As(V). When pH > pHpzc, the surface of MCB acquired negative charges, which could go against the As(V) adsorption due to electrostatic repulsion,34 so as to the adsorption efficiency decreased significantly when the pH > 5.0. This result might confirm the hypothesis that electrostatic attraction could be one of the adsorption mechanisms. As it can be seen from Fig. 4a, As(V) adsorption onto three different materials was investigated at various pH. It was clearly to find that CB had an upper hand on As(V) adsorption compared with biochar, indicating that the introduction of chitosan was beneficial for removing As(V). It might be that –NH2 and –OH from chitosan were protonated resulted in positively charged, which hold great promise for sequestrating As(V) due to electrostatic attraction. Thus, the sorption capacity of CB was much higher than biochar. Moreover, as shown in Fig. 4a, it can be also found that the sorption capacity of MCB was higher than that of CB, which is mainly due to the high surface areas and partial positive charges of magnetic fluid that have a strong affinity for As(V) in water.35 However, the maximum adsorption of As(V) on MCB was appeared at pH 5, and the adsorption capacity was gradually reduced as the pH decreased, while the CB has the opposite trend, this is because of the easy oxidation/dissolution of iron nanoparticles, especially at high concentrations of acid solution that lead to a decrease in the sorption capacity of MCB. At the same time, we found that the stronger the acidity, the more dissolved iron ions were detected by the flame atomic absorption (Fig. 4a). When pH increases to 5 and above, leaching of Fe ion significantly reduces. The composite MCB is stable when the pH is above 5. All in all, MCB had superiority in As(V) removal, and could be conveniently separated from after adsorption aqueous solution compared with B and CB.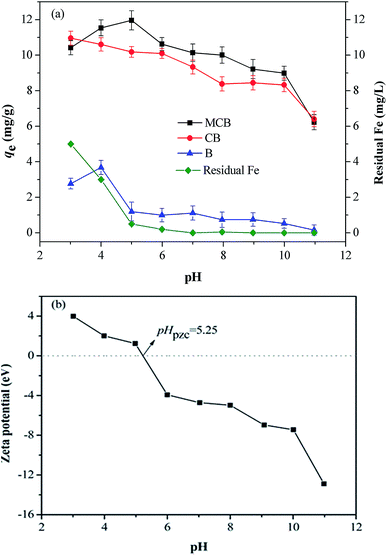 | ||
| Fig. 4 (a) As(V) adsorption capacities of B, CB, MCB and residual Fe in solution with varying pH; (b) zeta-potential of MCB at different solution pH. | ||
3.3 Effect of co-existing ions
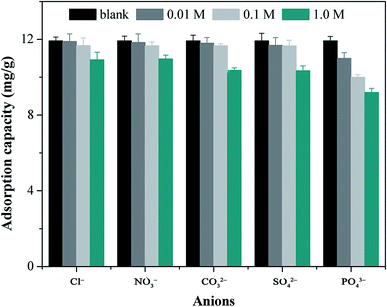
Considering the complexity of water resources, the existence of various ions, such as Cl−, NO3−, CO32−, SO42− and PO43− ions might influence the uptake capacity of MCB to As(V). Therefore, the effect of co-existing ions on adsorption was conducted by batch experiments at different concentrations of NaCl, NaNO3, Na2CO3, Na2SO4, and Na3PO4, and the obtained results are shown in Fig. 5. The adsorption capacity of MCB was decreased in the concentrations of various anions from 0 to 1.0 mol L−1, which might be attributed to the competition between negatively charged anions and HAsO4−. These anions could be easily captured by the adjacent hydroxyl or carboxyl groups that were present on the surface of MCB, which might change the surface state of MCB and decrease the availability of binding sites.36 On the other hand, it was observed that the presence of CO32− and SO42− had a greater impact on As(V) removal compared with the Cl− and NO3−, however, PO43− could cause the greatest decrease in As(V) adsorption, which might be due to the strong competition between the PO43− and As(V) for the binding sites of the adsorbent. Thus, it might occupy more adsorption sites compared to the other anions. In the practical application, some pretreatment before adsorption to reduce the concentration of various anions might be beneficial for contaminant removal.3.4 Effect of contact time and adsorption kinetics
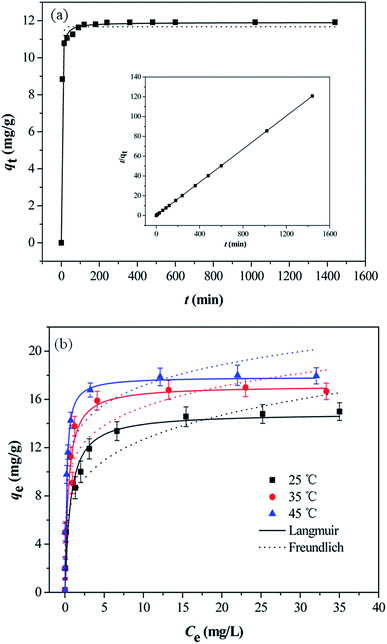
The effect of contact time on As(V) adsorption onto MCB is illustrated in Fig. 6a, and the inset shows the linear plot of pseudo-second-order. The adsorption process could be divided into two regions. In the first stage, the adsorption rate was very fast, and over 90% of the equilibrium adsorption capacity was achieved within 30 min, which could be owing to the existence of abundant active sites on the surface of adsorbents. In the subsequent step, the process was slow, and the equilibrium was reached in about 3 h. It might be attributed to the great decline of binding sites on adsorbents surface and the aggregation between particles.37 The kinetic of As(V) adsorption onto MCB was applied in order to understand the adsorption behaviors of MCB composite. The adsorption data of As(V) at different time intervals was simulated by pseudo-first-order and pseudo-second-order model. The equations are illustrated as follows:Non-linear pseudo-first-order:
| qt = qe,1(1 − e−k1t) | (2) |
Non-linear pseudo-second-order:
 | (3) |
Linear pseudo-second-order:
 | (4) |
| Pseudo-first-order model | Pseudo-second-order model | |||||
|---|---|---|---|---|---|---|
| k1 (min−1) | qe (mg g−1) | R2 | k2 (g mg−1 min−1) | qe (mg g−1) | R2 | qe,exp (mg g−1) |
| 0.273 | 11.681 | 0.988 | 0.048 | 11.907 | 0.999 | 11.920 |
3.5 Adsorption isotherm
To describe the equilibrium established between adsorbed As(V) on the adsorbent and the remaining As(V) in the solution, two widespread-used isotherm models (Langmuir and Freundlich models) were applied to describe the equilibrium characteristics of the adsorption. The Langmuir adsorption model assumed that all the binding sites were equal and the adsorbent surface is homogeneous, while the Freundlich isotherm model was an empirical equation for explaining heterogeneous adsorption process.38 Both the two models were expressed as follows:Langmuir:
 | (5) |
Freundlich:
| qe = KFCe1/n | (6) |
Fig. 6b showed As(V) sorption isotherms on the MCB at three different temperatures. The relative parameters calculated from the Langmuir and Freundlich isotherm models were listed in Table 2. As can be seen from Fig. 6b, the sorption isotherm maximum (17.876 mg g−1) was at 45 °C and minimum (14.928 mg g−1) at 25 °C. This result indicated that As(V) sorption on the MCB was promoted at higher temperature. According to the coefficient correlation (R2) obtained from Table 2, Langmuir isotherm had a better fitting model than the Freundlich isotherms model, suggesting that As(V) sorption on the MCB was a monolayer coverage. Additionally, KL increased with the increasing of the temperature, which indicated that the adsorption of As(V) onto MCB was an endothermic process. Another parameter RL, a dimensionless constant separation parameter, is given by the following equation:
 | (7) |
| Temperature (°C) | Langmuir | Freundlich | ||||
|---|---|---|---|---|---|---|
| qmax (mg g−1) | KL (L mg−1) | R2 | KF (L mg−1) | n | R2 | |
| 25 | 14.928 | 1.354 | 0.970 | 7.839 | 4.703 | 0.914 |
| 35 | 17.164 | 2.275 | 0.906 | 10.604 | 6.094 | 0.898 |
| 45 | 17.876 | 5.805 | 0.945 | 11.992 | 6.676 | 0.900 |
3.6 Adsorption thermodynamic studies
Thermodynamic parameters such as the Gibbs free energy change (ΔG°), enthalpy change (ΔH°), and entropy change (ΔS°) were used to evaluate the feasibility and nature of adsorption reaction. They were determined by using the following equations:
ΔG° = −RT![[thin space (1/6-em)]](https://www.rsc.org/images/entities/char_2009.gif) ln ln![[thin space (1/6-em)]](https://www.rsc.org/images/entities/char_2009.gif) K° K°
| (8) |
 | (9) |
![[thin space (1/6-em)]](https://www.rsc.org/images/entities/char_2009.gif) Kd (Kd = qe/Ce) versus Ce and extrapolating Ce to zero.
Kd (Kd = qe/Ce) versus Ce and extrapolating Ce to zero.
Thermodynamic analysis was investigated at three different temperatures (25, 35, and 45 °C). The calculated results are shown in Table 4. The ΔH° and ΔS° values were found to be 232.630 kJ mol−1 and 56.836 J mol−1 K−1, respectively. The ΔG° values were negative at the studied temperature, which was −2.442 kJ mol−1, −3.612 kJ mol−1 and −4.083 kJ mol−1, at 25, 35, and 45 °C, respectively. It was obvious that the ΔG° values became more negative as the temperature increased, which indicated that the adsorption was spontaneity and more favorable at high temperature. The positive ΔH° value implied that the adsorption reaction was endothermic, and it was the reason why the adsorption capacity of As(V) increased along with the increase of temperature. This was consistent with the isotherm analysis at different temperature. In addition, the positive ΔS° indicated that the degrees of freedom increased at the solid–liquid interface during the adsorption process.
ln![[thin space (1/6-em)]](https://www.rsc.org/images/entities/char_2009.gif) K° K° |
ΔG° (kJ mol−1) | ΔH° (kJ mol−1) | ΔS° (kJ mol−1 K−1) | ||||
|---|---|---|---|---|---|---|---|
| 25 °C | 35 °C | 45 °C | 25 °C | 35 °C | 45 °C | ||
| −0.985 | 1.410 | 1.544 | −2.442 | −3.612 | −4.083 | 232.630 | 56.836 |
3.7 Reusability of adsorbent
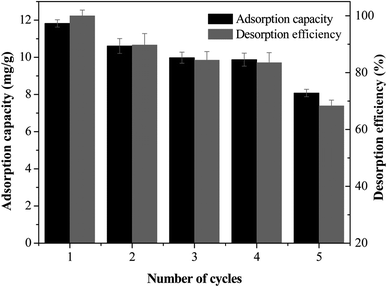
The reversibility and desorption efficiency are important parameters to determine the reusability and economic feasibility. In this study, 1.0 mol L−1 NaOH solution was selected as a stripping reagent to study the reusability and desorption efficiency for 5 times, and the results are presented in Fig. 7. The MCB maintained 11.823 mg g−1 adsorption capacity for As(V) after one adsorption–desorption cycle. After 5 cycles of reuse, the regenerated MCB still retained about 8.078 mg g−1 uptake capacity for As(V), indicting a good reusability of adsorbent for As(V) removal. However, the decreasing of adsorption capacity could be assigned to the reduction of surface area and pore volume, and the relatively weak functional groups.34 The desorption efficiency was decreased slowly from 98% to 68%, and it still presented a relatively high removal efficiency after 5 adsorption–desorption experiments.3.8 Adsorption mechanism
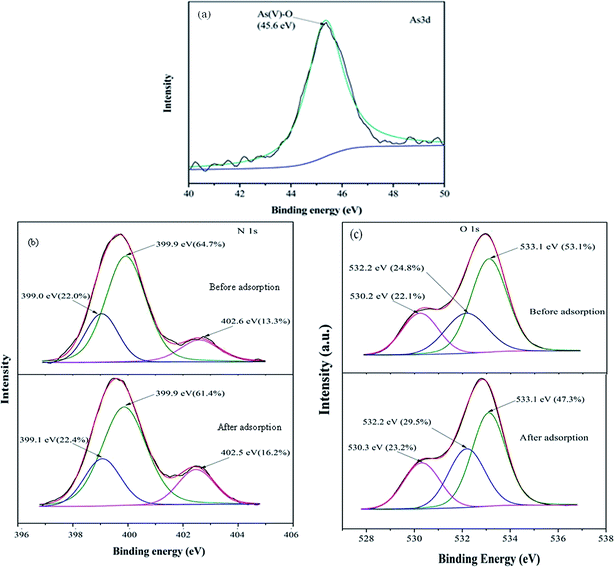
To investigate the mechanism of As(V) removal, XPS analysis has been carried out and the wide XPS spectra of the MCB composite after As(V) adsorption was given in Fig. 3a. After As(V) adsorption, typical As 3d XPS peak appeared. In Fig. 8a, which was assigned to the As(V)–O,43 so it can be demonstrated MCB could be used to eliminate As(V) from aqueous solution. Furthermore, Fig. 8b reflected the N 1s XPS spectra of MCB before and after As(V) adsorption. The N 1s spectrum of MCB could be deconvoluted into three peak component with binding energies (BEs) at 399.0, 399.9, and 402.5 eV, which were consistent with the amine (–NH2), amide(–NH–), and protonated amine (N+), respectively.44 After As(V) adsorption, the molar ratio of N+ increased significantly from 13.3% to 16.2%, the –NH– decreased from 64.7% to 61.4%, and the –NH2 had little changes, which indicated that the N+ might play a key role in As(V) removal owing to the presence of N+ could absorb negatively charged H2AsO4− or HAsO42− through electrostatic attraction and it was explained that the removal efficiency of As(V) was significantly improved after grafting chitosan on biochar. The O 1s XPS spectrum of MCB composite before and after adsorption is shown in Fig. 8c. It was noted that there were three peaks centered at 530.2, 532.2 and 533.1 eV in MCB spectra, which was assigned to Fe–O (22.1%), –OH (24.8%) and O–C–O (53.1%).45 However, after As(V) adsorption, the molar ratio of the surface Fe–O groups increased to 23.2%, which might be due to the formation of Fe–O–As groups on the adsorbent surface after As(V) adsorption, and it also explains why the magnetic fluid modification greatly enhanced CB's sorption ability to As(V). Furthermore, the peaks at 532.2 eV due to –OH group, and the molar ratio increased from 24.8% to 29.5%, which might be owing to the reaction between –OH from MCB and As(V) via electrostatic attraction, and the results were consistent with the pH analysis.4. Conclusion
The magnetic chitosan/biochar composite (MCB) was prepared successfully as a low-cost adsorbent to remove As(V) from aqueous solution. The adsorption experiment indicated that there was an obvious enhanced adsorption capacity of As(V) after modification. The experimental data was better fitted by the pseudo-second-order and Langmuir model, and the maximum adsorption capacity (17.876 mg g−1) was obtained at pH 5, 45 °C. The sorption reaction was an endothermic and spontaneous process. Based on the experiments, the interaction between As(V) and MCB might include electrostatic attraction and the increased adsorption sites that iron provided.Acknowledgements
This work was supported by the National Natural Science Foundation of China (Grant no. 51609268, 41271332, 51521006 and 51478470).References
- I. Andjelkovic, D. N. Tran, S. Kabiri, S. Azari, M. Markovic and D. Losic, ACS Appl. Mater. Interfaces, 2015, 7, 9758–9766 CAS.
- C. H. Liu, Y. H. Chuang, T. Y. Chen, Y. Tian, H. Li, M. K. Wang and W. Zhang, Environ. Sci. Technol., 2015, 49, 7726–7734 CrossRef CAS PubMed.
- C.-W. Huang, C.-C. Wei and V. H.-C. Liao, Chemosphere, 2015, 141, 44–49 CrossRef CAS PubMed.
- Q. Sun, Y. Song, S. Liu, F. Wang, L. Zhang, S. Xi and G. Sun, Atmos. Environ., 2015, 118, 1–6 CrossRef CAS.
- X. Liu, W. Zhang, Y. Hu and H. Cheng, Microchem. J., 2013, 108, 38–45 CrossRef CAS.
- S. S. Nielsen, L. Petersen, P. Kjeldsen and R. Jakobsen, Chemosphere, 2011, 84, 383–389 CrossRef CAS PubMed.
- H. Guo, D. Wen, Z. Liu, Y. Jia and Q. Guo, Appl. Geochem., 2014, 41, 196–217 CrossRef CAS.
- J. Tong, H. Guo and C. Wei, Sci. Total Environ., 2014, 496, 479–487 CrossRef CAS PubMed.
- H. Guo, Y. Ren, Q. Liu, K. Zhao and Y. Li, Environ. Sci. Technol., 2013, 47, 1009–1016 CrossRef CAS PubMed.
- P. Smedley and D. Kinniburgh, Appl. Geochem., 2002, 17, 517–568 CrossRef CAS.
- P. Chutia, S. Kato, T. Kojima and S. Satokawa, J. Hazard. Mater., 2009, 162, 440–447 CrossRef CAS PubMed.
- O. Coronell, B. Mi, B. J. Mariñas and D. G. Cahill, Environ. Sci. Technol., 2012, 47, 420–428 CrossRef PubMed.
- A. Dominguez-Ramos, K. Chavan, V. n. García, G. Jimeno, J. Albo, K. V. Marathe, G. D. Yadav and A. Irabien, Ind. Eng. Chem. Res., 2014, 53, 18920–18927 CrossRef CAS.
- A. Molinari, L. Guadagnini, M. Marcaccio, S. Straface, X. Sanchez-Vila and A. Guadagnini, Sci. Total Environ., 2013, 444, 231–240 CrossRef CAS PubMed.
- S. Bordoloi, S. K. Nath, S. Gogoi and R. K. Dutta, J. Hazard. Mater., 2013, 260, 618–626 CrossRef CAS PubMed.
- I. Ali, Chem. Rev., 2012, 112, 5073–5091 CrossRef CAS PubMed.
- X. Hu, Z. Ding, A. R. Zimmerman, S. Wang and B. Gao, Water Res., 2015, 68, 206–226 CrossRef CAS PubMed.
- L. Lou, L. Yao, G. Cheng, L. Wang, Y. He and B. Hu, PLoS One, 2015, 10, e0137467 Search PubMed.
- X. Tan, Y. Liu, G. Zeng, X. Wang, X. Hu, Y. Gu and Z. Yang, Chemosphere, 2015, 125, 70–85 CrossRef CAS PubMed.
- L. Beesley and M. Marmiroli, Environ. Pollut., 2011, 159, 474–480 CrossRef CAS PubMed.
- Y. Zhou, B. Gao, A. R. Zimmerman, J. Fang, Y. Sun and X. Cao, Chem. Eng. J., 2013, 231, 512–518 CrossRef CAS.
- B. Huang, Y. Liu, B. Li, G. Zeng, X. Hu, B. Zheng, T. Li, L. Jiang, X. Tan and L. Zhou, RSC Adv., 2015, 5, 106339–106349 RSC.
- A. Adamczuk and D. Kołodyńska, Chem. Eng. J., 2015, 274, 200–212 CrossRef CAS.
- Y.-F. Lin, J.-L. Chen, C.-Y. Xu and T.-W. Chung, Chem. Eng. J., 2014, 250, 409–415 CrossRef CAS.
- L. Fan, C. Luo, X. Li, F. Lu, H. Qiu and M. Sun, J. Hazard. Mater., 2012, 215–216, 272–279 CrossRef CAS PubMed.
- X. J. Hu, J. S. Wang, Y. G. Liu, X. Li, G. M. Zeng, Z. L. Bao, X. X. Zeng, A. W. Chen and F. Long, J. Hazard. Mater., 2011, 185, 306–314 CrossRef CAS PubMed.
- C. Cao, L. Xiao, C. Chen, X. Shi, Q. Cao and L. Gao, Powder Technol., 2014, 260, 90–97 CrossRef CAS.
- H. Deng, X. Li, Q. Peng, X. Wang, J. Chen and Y. Li, Angew. Chem., 2005, 117, 2842–2845 CrossRef.
- F.-y. Guo, Y.-g. Liu, H. Wang, G.-m. Zeng, X.-j. Hu, B.-h. Zheng, T.-t. Li, X.-f. Tan, S.-f. Wang and M.-m. Zhang, RSC Adv., 2015, 5, 45384–45392 RSC.
- B. Chen, Z. Chen and S. Lv, Bioresour. Technol., 2011, 102, 716–723 CrossRef CAS PubMed.
- M.-m. Zhang, Y.-g. Liu, T.-t. Li, W.-h. Xu, B.-h. Zheng, X.-f. Tan, H. Wang, Y.-m. Guo, F.-y. Guo and S.-f. Wang, RSC Adv., 2015, 5, 46955–46964 RSC.
- K. Elwakeel, Int. J. Environ. Sci. Technol., 2014, 11, 1051–1062 CrossRef CAS.
- M. X. Loukidou, K. A. Matis, A. I. Zouboulis and M. Liakopoulou-Kyriakidou, Water Res., 2003, 37, 4544–4552 CrossRef CAS PubMed.
- C. Gan, Y. Liu, X. Tan, S. Wang, G. Zeng, B. Zheng, T. Li, Z. Jiang and W. Liu, RSC Adv., 2015, 5, 35107–35115 RSC.
- Y.-F. Pan, C. T. Chiou and T.-F. Lin, Environ. Sci. Pollut. Res., 2010, 17, 1401–1410 CrossRef CAS PubMed.
- H. Wang, X. Yuan, Y. Wu, H. Huang, G. Zeng, Y. Liu, X. Wang, N. Lin and Y. Qi, Appl. Surf. Sci., 2013, 279, 432–440 CrossRef CAS.
- L. Fan, C. Luo, M. Sun, X. Li and H. Qiu, Colloids Surf., B, 2013, 103, 523–529 CrossRef CAS PubMed.
- E. Agrafioti, D. Kalderis and E. Diamadopoulos, J. Environ. Manage., 2014, 133, 309–314 CrossRef CAS PubMed.
- Z. Wu, X. Yuan, H. Zhong, H. Wang, G. Zeng, X. Chen, H. Wang, L. Zhang and J. Shao, Sci. Rep., 2016, 6, 25638 CrossRef CAS PubMed.
- Y. Salameh, A. B. Albadarin, S. Allen, G. Walker and M. N. M. Ahmad, Chem. Eng. J., 2015, 259, 663–671 CrossRef CAS.
- H. S. Altundoğan, S. Altundoğan, F. Tümen and M. Bildik, Waste Manag., 2002, 22, 357–363 CrossRef.
- T.-F. Lin and J.-K. Wu, Water Res., 2001, 35, 2049–2057 CrossRef CAS PubMed.
- Y.-X. Zhang and Y. Jia, Appl. Surf. Sci., 2014, 290, 102–106 CrossRef CAS.
- X. Yang, Y. Tu, L. Li, S. Shang and X.-m. Tao, ACS Appl. Mater. Interfaces, 2010, 2, 1707–1713 CAS.
- N. A. Travlou, G. Z. Kyzas, N. K. Lazaridis and E. A. Deliyanni, Langmuir, 2013, 29, 1657–1668 CrossRef CAS PubMed.
| This journal is © The Royal Society of Chemistry 2017 |

