 Open Access Article
Mixing indexes considering the combination of mean and dispersion information from intensity images for the performance estimation of micromixing†
Hai Fu ,
Xuling Liu and
Songjing Li*
Department of Fluid Control and Automation, School of Mechatronics Engineering, Harbin Institute of Technology, Harbin, Heilongjiang 150000, P. R. China. E-mail: lisongjing@hit.edu.cn
First published on 10th February 2017
Abstract
Herein, micromixing was utilized to achieve chemical reaction, homogenization, emulsification, and in applications of microfluidics. In these applications, efficient mixing is one of the most fundamental and difficult-to-achieve characteristics. To quantitatively represent the mixing performance, nearly all the methods to characterize the micromixing processes in miniaturized devices depend on the images obtained by a microscope coupled with a CCD device or a video camera. The experimental images are generally stored in an RGB or gray-scale format. Intensity information of the micromixing images is most often used to estimate the mixing performance. Reliable quantification of the mixing effects is one of the most important and fundamental issues to study the performances of mixers and to optimize the designs. Thus, mixing indexes are of great significance to quantify the mixing effects. However, mixing indexes merely based on dispersion information cannot always produce reliable results if the variation of the mean intensity with enhanced mixing is neglected. Therefore, mixing indexes that consider the combination of mean and dispersion information from the intensity images in two specific forms were proposed. In addition, two practical criteria were used to evaluate the performances of the quantitative mixing indexes. One is the reliability and the other is repeatability precision. According to the comparisons of different mixing indexes studied herein, mixing indexes that consider the combination of mean and dispersion information can ensure the reliability of the calculated result every time and the repeatability precision was less than ±3.5%. Therefore, it can be concluded that the mixing indexes that consider the combination of mean and dispersion information can more reliably represent the mixing performance.
1 Introduction
Mixing is an important phenomenon in many liquid processes.1 To date, many types of mixers for use in microfluidics have been developed and improved.2,3 In the field of microfluidics, mixing has been a very popular technique to study the dynamics of biological and chemical systems,4–6 and efficient micro-mixing is one of the fundamental challenges that is difficult to achieve.7 Moreover, it is widely utilized to achieve mixing in chemical reactions, homogenization, and emulsification. Although many methods to estimate the mixing performances of these mixers have been proposed, with the development of mixing processes, a robust and quantitative mixing index is essential to reliably and universally evaluate the mixing performance.8There are a number of approaches to characterize the mixing quality in miniaturized devices.9 For single phase liquid mixing, dilution of colored dyes,10–13 dilution of fluorescent species,14–17 acid–base or pH indicator reactions,18 reactions that yield colored species,19 competing parallel reactions,20 and monitoring the concentrations of species21 were utilized. All these methods can be classified as dilution-based characterization methods. Furthermore, most of them can be applied to characterize the mixing performances of the gas–liquid dispersions and liquid–liquid dispersions. Nearly, all the above mentioned methods rely on the digital images obtained by a microscope coupled with a CCD device or a video camera. Therefore, to some extent, the challenge to quantitatively characterize the mixing quality is equivalent to the challenge of obtaining the mixing performance information from these images, which are generally stored in an RGB format or a gray-scale format. Due to the significance of intensity information for colored images, the intensity images extracted from the colored images are usually utilized to obtain the mixing performance information.
The calculation of a quantitative mixing index is the foundation to extract the mixing performance information from the images. In earlier studies, the mixing processes lacked quantitative methods to represent the performance of mixing.22 Recently, several quantitative mixing indexes have been defined and appeared to be very important for the mixing performance estimation based on the handling of the intensity images.
However, almost all the indexes merely utilize the dispersion information from the intensity images. These mixing indexes can give very limited, reliable results due to the change in the mean intensity with the mixing enhancement. To improve the reliability of the estimated mixing performance, mixing indexes that consider mean information and dispersion information have been proposed in this study. In addition, two forms of this class of mixing index have been presented, and two practical criteria of the performances for the quantitative mixing indexes were proposed. Mixing indexes were compared by the use of experimental images.
2 Problems of the mixing indexes based on the intensity dispersion information of digital images
2.1 Mixing indexes based on the intensity dispersion information of images
A mixing index calculated with the maximum intensity was proposed by Liu et al. (2000).23 They used window images obtained by a CCD camera and intensity images of pixels to characterize the reaction between KOH and phenolphthalein, and defined the definition of mixing index IE:
 | (1) |
An improved mixing index, replacing the maximum intensity with mean intensity, was introduced by Lee et al. (2000).24 They obtained the definition of mixing index IE as follows:
 | (2) |
 is the mean intensity of the mixing region in an image. This index was also aimed to limit the value of the mixing index from 0 to 1. The value that estimates complete mixing is equal to 1. However, the initial state cannot be equal to 0 unless I = 0 for every pixel.
A mixing index to estimate the mixing performance of the two confluent streams was proposed by Johnson et al. (2002) when they studied the mixing process of two confluent streams in a T-microchannel at high flow rates.25 They obtained the definition of mixing index IE as follows:
 | (3) |
A mixing index only utilizing the dispersion information of the intensity images calculated with the intensity of segregation was proposed by Luo et al. (2006).26 This mixing index was based on the quantitative index proposed by P. V. Danckwerts (1952).22 Luo et al. obtained the definition of mixing index IE as follows:
 | (4) |
A mixing index based on the coefficient of variation of the intensity was proposed by Jayaraj et al. (2007).8 They obtained the following definition of the mixing index IE:
 | (5) |
This index only utilizes the dispersion information to evaluate the mixing performance. The coefficient of variation was utilized to eliminate the influence between the mean and standard variance. According to the theory of statistics, N − 1 is utilized to study the statistical characteristics of a sample that is sampled from the population. However, when the number of pixels is big enough, the difference caused by N − 1 or N is very small.
A mixing index calculated with the variance was proposed by Liu et al. (2012) when they studied the mixing performance of an asymmetrical T-shaped micromixer27 and obtained the following definition of the mixing index IE:
 | (6) |
This mixing index only utilizes the dispersion information.
The limitations of the mixing indexes based on the formulas from (1) to (6) are summarized in Table 1. Obviously, they only utilize the dispersion information to estimate the effects of micromixing.
| Mixing index | Limitations |
|---|---|
| (1) | Only utilizing the dispersion information |
| (2) | (1) Only utilizing the dispersion information also |
| (2) Value limited to 0–1 but IE ≠ 0 | |
| (3) | (1) Only utilizing the dispersion information |
| (2) Cannot be used in online real-time calculation | |
| (3) Strictly extracting the valid regions | |
| (4) | Only utilizing the dispersion information |
| (5) | Only utilizing the dispersion information |
| (6) | Only utilizing the dispersion information |
2.2 Estimating the effects of mixing indexes based on the intensity dispersion information
In this study, mixing indexes based on the intensity dispersion information were defined by formulas (1), (2) and (4)–(6). For utilizing formula (3) to estimate the mixing performance, the initial and final images were required. The other formulas can work for one image at a moment, which is a common case to estimate the mixing performance. In addition, it needs to ensure that different images are of the same size, especially while extracting the valid regions, which is difficult to accomplish. In addition, online real-time calculation of the mixing performance is difficult to achieve. Therefore, it is not studied herein.To compare the estimated performance of different mixing indexes in graphic form, they were normalized by the following formula:
 | (7) |
The colored images obtained by a CCD camera are usually stored in an RGB color space. To obtain the intensity images, there are several colored space transmissions such as RGB to YUV and RGB to HSI. The most commonly used HSI model was adopted in this study. In HSI model, the intensity I can be obtained by the following equation:
 | (8) |
Reported experimental images were obtained from ref. 28 and 29 to compare the performances of different mixing indexes. To calculate different mixing indexes of these digital images, there are three main steps: (1) obtain the intensity I of a digital image based on formula (8), (2) segment and extract the research areas, and (3) calculate different mixing indexes of an extracted digital image based on the formulas of different mixing indexes.
The first experimental image, as shown in Fig. 1(a), was captured by S. M. Phapal and P. Sunthar when they studied the micromixing process of phospholipid in alcohol and drug in PBS.28 The flow has a low Reynolds number and the dye spreads from the core stream to the outer regions along the horizontal direction. Fig. 1(b) is the corresponding intensity image in the HSI color space. To study the mixing effects along the horizontal direction, the valid mixing region (black dotted rectangle) was divided into eight same smaller rectangles (black rectangles), as shown in Fig. 1(c).
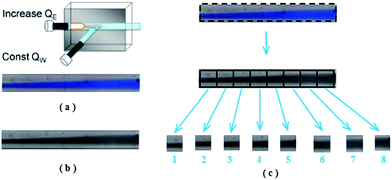 | ||
| Fig. 1 An experimental image obtained by S. M. Phapal and P. Sunthar28 and related processing. (a) The RGB digital image at QW = 100 μL min−1 and QE = 7 μL min−1. (b) Corresponding intensity image in the HSI color space. (c) Principle of image processing. The black dotted rectangle is the valid mixing region of this mixing process. The eight black rectangles were extracted from the valid mixing region to study the mixing index distribution along the horizontal direction. | ||
Fig. 2 shows the computed results of the mixing performance with different mixing indexes for Fig. 1. Different mixing indexes were normalized to 0–1 by formula (7) and I(i) stands for the mixing index based on formula i. The horizontal coordinate represents the eight images, as shown in Fig. 1(c).
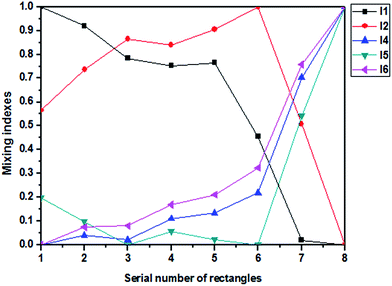 | ||
| Fig. 2 Computed results of different mixing indexes for Fig. 1. I1 is the mixing index based on formula (1), I2 is the mixing index based on formula (2), I4 is the mixing index based on formula (4), I5 is the mixing index based on formula (5), and I6 is the mixing index based on formula (6). | ||
As we can see, the mixing performance is obviously enhanced along the horizontal direction, as shown in Fig. 1(a). Therefore, the change of mixing index should be strictly monotonic according to the actual physical meaning. However, I1, I2, I4, and I5 show non-monotonic characteristic, and only I6 shows a strictly monotonic characteristic, as shown in Fig. 2.
The second experimental image, as shown in Fig. 3(a), was obtained by Lin et al. when they studied the micromixing process of a T-shaped micromixer utilizing the switching electroosmotic flow.29 According to their studies, when the switching frequency is over 4 Hz in a conventional switching mode, the waveform flow will decrease. The switching frequency is the frequency of switching the DC field, which was used to induce the electroosmotic flow. When the frequency is 0, the flow is similar to laminar flow. Fig. 3(b) is the corresponding intensity image in the HSI color space. To study the mixing effects along the horizontal direction, the valid mixing region (white dotted rectangle) was divided into eight same smaller rectangles (white rectangles), as shown in Fig. 3(c).
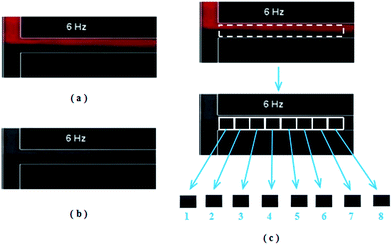 | ||
| Fig. 3 An experimental image obtained by Lin et al.29 and related processing. (a) The RGB digital image at the switching frequency of 6 Hz. (b) Corresponding intensity image in the HSI color space. (c) Principle of image processing. The white dotted rectangle is the valid mixing region of this mixing process. The eight similar white rectangles were extracted from the valid mixing region to study the mixing index distribution along the horizontal direction. | ||
Fig. 4 shows the computed results of mixing performance with different mixing indexes for Fig. 3. Different mixing indexes were also normalized to 0–1 by formula (7), and I(i) stands for the mixing index based on formula i. The horizontal coordinate represents the eight images, as shown in Fig. 3(c).
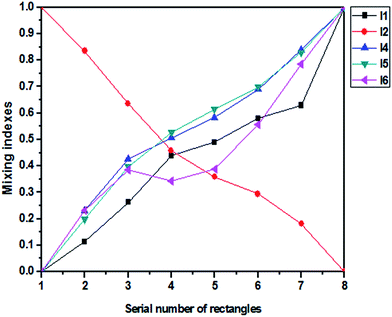 | ||
| Fig. 4 Computed results of different mixing indexes for Fig. 5. I1 is the mixing index based on formula (1), I2 is the mixing index based on formula (2), I4 is the mixing index based on formula (4), I5 is the mixing index based on formula (5), and I6 is the mixing index based on formula (6). | ||
The mixing performance was enhanced in the horizontal direction (Fig. 3(a)). Therefore, the change in the mixing index should be strictly monotonic according to actual physical meaning. However, it can be seen that only I6 cannot satisfy the requirement of strict monotonicity (Fig. 4).
The abovementioned comparison shows that these six mixing indexes may provide unreliable results for some circumstances. Especially, the differences between formulas (2), (5), and (6) need to be noted. The core components of formulas (2) and (5) are nearly the same, and the most important difference between formulas (2) and (6) is the presence of 1/Ī.
3 Mixing indexes considering the combination of mean and dispersion information from digital images
3.1 Analysis of the unreliable problems of mixing indexes based on the intensity dispersion information
Mixing indexes based on intensity dispersion information were developed on the basis of the theory of statistics and data analysis, in which the mean can represent the mean level of a set of data and the standard variance can indicate the dispersion of the data. For micromixing, the standard variance is widely used to represent the dispersion information and has a clear physical meaning. The lower standard variance implies that the difference in the intensity values among all the pixels is small; thus, the mixing performance is high. With the enhancement in mixing, the mean intensity also changes during the mixing process by the dilution of colored dyes or pH indicator reactions to present mixing or reaction performance and should be considered.An important feature of mixing is the change of concentration. A significant law to study the intensity of monochromatic light and concentration of colored dilute solution is the Lambert–Beer law. The intensity of the transmitted light and the intensity of the light source satisfy the following relationship:30
 | (9) |
Considering the negative correlation (Fig. 5(a)), the left picture is in unmixed state and the deep purple area represents a colored solution with a mass fraction of x (0 ≤ x ≤ 1). The mass is m and its area is A. The light purple area represents a colored solution with a mass fraction y (0 ≤ y ≤ x ≤ 1), and the other parameters are the same as those of deep purple area. The right picture is in a completely mixed state. The mass fraction of the purple area is (x + y)/2 (because of (xm + ym)/2m), and the mass and area are 2m and 2A, respectively.
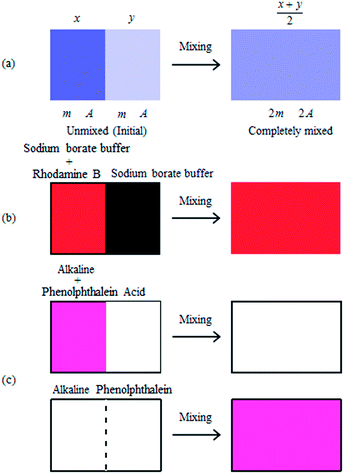 | ||
| Fig. 5 Schematic of the mean change of the intensity in the mixing process. (a) The mean change of the intensity from mixing colored dilute solution. (b) The mean change of the intensity from mixing colored solution under a fluorescence microscope.29 (c) The mean change of the intensity from mixing reactions with pH indicator. | ||
For the left deep purple area, according to formula (9), we obtained
 | (10) |
For the left light purple area, we obtained
 | (11) |
For the right purple area, we obtained
 | (12) |
The total intensities of the left and right images are
| Ileft = AIl(Īt1 + Īt2) = AIl(10−x(Kbc) + 10−y(Kbc)) | (13) |
 | (14) |
However, for the parameters Kbc > 0, Il > 0, and A > 0, we can assume
| f(X) = AIl × 10−(Kbc)X (0 ≤ X ≤ 1) | (15) |
Utilizing formula (15), formulas (13) and (14) can be reorganized
| Ileft = f(x) + f(y) | (16) |
 | (17) |
Due to the existence of f′(X), f′′(X) > 0, and (0 ≤ X ≤ 1) for f(X), it can be observed that f(X) is a lower convex function and can always have the following relationships:
 | (18) |
| Īt1 + Īt2 ≥ 2Īt3 | (19) |
For a positive correlation, as shown in Fig. 5(b),29 the sodium borate buffer with Rhodamine B appears red colored. The sodium borate buffer presents a black color under a fluorescence microscope, and the mean intensity increases with the enhanced mixing. The top images of Fig. 5(c) also belong to the positive correlation cases.
In the mixing process that utilizes colored reagents as indicators or chemical reactions with colored variations, the mean and dispersion information of intensity images both normally change. Namely, at different stages of mixing, different populations (image or valid region) have different mean intensities and different standard variances, which represent the changes in color and dispersion, respectively. Apparently, formulas (1)–(6) merely represent the dispersion information of the experimental images. However, the mean intensities and standard variances gradually change with an improvement in the mixing dispersion. The indexes based on formulas (1)–(6) have not sufficiently utilized the information of experimental images. In our opinion, the mixing performance is a function of the mean intensity and dispersion information. For every population, there exists the following relationship:
| IE = f(Im,D) | (20) |
 of the population were utilized to represent the mean information and dispersion information, respectively.
Due to the existing two types of relationships between Ī and mixing performance, the mixing index should have two forms to satisfy the two situations. If the intensity of the unmixed region is higher than the intensity of the perfectly mixed solutions, the calculated results of the mixing indexes will increase with the decreasing mean intensity. Otherwise, the calculated values will increase as the mean intensity increases. In addition, the standard variance of intensity always decreases with the enhancement of the mixing performance. Hence, if Ī and σ decrease, the mixing performance will be higher. We defined the mixing indexes IE in formulas (21-a) and (22-a) for every population. With higher Ī and lower σ, there will be a higher mixing performance. We defined the mixing indexes IE for every population in formulas (21-b) and (22-b) as follows:
 | (21-a) |
 | (21-b) |
| IE = −Ī × σ | (22-a) |
 | (22-b) |
Formulas (21) and (22) both are special forms of formula (20). To represent negative correlation, a reciprocal relation was used in formula (21). In formula (22), the minus sign was adopted to represent the negative correlation. To represent a positive correlation, a directly proportional relation was used in formula (21). In formula (22), the minus sign and reciprocal relation were adopted to represent a positive correlation. The two special forms can be utilized as the mixing indexes considering the combination of mean and dispersion information from the intensity images.
Herein, the different derivation processes and physical meanings between the core parts of formula (2) and formula (22-b) can be observed although they have the same form. The core part of formula (2) just considers the dispersion information and it was aimed to limit the value of the mixing index from 0 to 1 according to its derivation. This means that the derivation of formula (2) does not consider the mean information of intensity according to ref. 24. In the derivation of formula (22-b), the mean information and dispersion information were both considered.
3.2 Estimating the effects of mixing indexes considering the combination of mean and dispersion information from the digital images
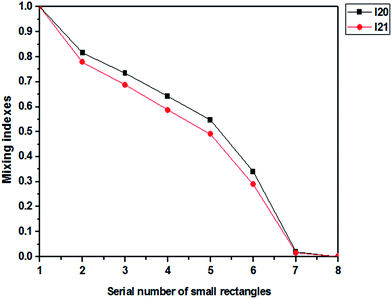
There are two different types of relationships between the mean intensity and mixing performance. Thus, the experimental images can be divided into two categories. The first one is that both the lower mean and standard variance indicate a higher mixing performance. The second one is that the higher mean and lower standard variance imply a higher mixing performance. Moreover, we defined different forms of mixing indexes to fulfill different situations. Therefore, we adopted two types of micromixing experimental images, and the results are normalized to 0–1 by formula (7).Fig. 6 shows the computed results for Fig. 1. I(i) is the mixing index basing on formula i. Obviously, the mixing performance is enhanced along the horizontal direction, as observed from Fig. 1(a). Therefore, the change in the mixing index should be strictly monotonic. As shown in Fig. 6, I20 and I21 show monotonic characteristics. In addition, the curve shapes of I20 and I21 are almost the same, which indicates that the two mixing indexes have similar effects for the performance estimation of micromixing process.
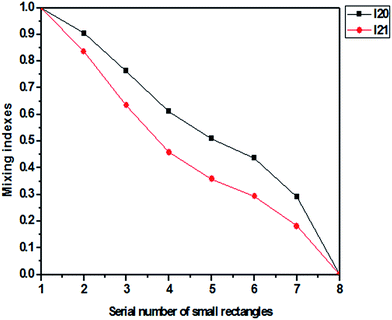
Fig. 7 shows the computed results for Fig. 3. I(i) is the mixing index basing on formula i. Obviously, the mixing performance is enhanced along the horizontal direction, as observed from Fig. 3(a). Therefore, the change in the mixing index should be strictly monotonic. Moreover, I20 and I21 also show monotonic characteristics according to the results shown in Fig. 7. In addition, the curve shapes of I20 and I21 are nearly the same. To some extent, there is only a difference in the middle part of the curves. The same trend between the two curves shows that the two mixing indexes have similar effects for the estimation of the performance of micromixing.
4 Criteria of the performances for the quantitative mixing indexes
P. V. Danckwerts (1952) proposed four criteria to measure the practical value of a quantitative mixing index.22 Moreover, in our opinion, a good quantitative mixing index should ensure that the calculated results are reliable. Otherwise, even if there are quantitative results, it may not be a good characterization for estimating the performance of mixing. Hence, we put forward two practical criteria to measure the performance of a quantitative mixing index. One is the reliability and the other is repeatability precision. The more important criterion is the reliability of a quantitative mixing index because it determines the reliability of the calculated result every time.4.1 Criteria of the quantitative mixing indexes
 | (23) |
4.2 Performance comparisons of different mixing indexes
However, from the calculated results of I20 and I21, as shown in Fig. 6 and 7, the mixing indexes considering the combination of mean and dispersion information proposed herein can always strictly show monotonic characteristics, and we have not found a contradictory situation to date. Thus, considering the analysis of unreliable problems of mixing indexes based on the intensity dispersion information, the mixing indexes considering the combination of mean and dispersion information can solve the unreliable problems and ensure the reliability of the calculated results.
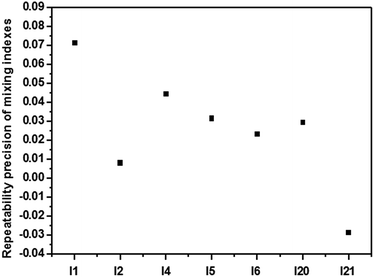
To compare the repeatability precision of different mixing indexes, the third black rectangle of Fig. 1(c) was utilized and computed 8 times, and formula (23) was utilized to measure the repeatability precision. The results are shown in Fig. 8. The repeatability precisions of I20 and I21 are less than ±0.035(±3.5%), whereas the repeatability precision of I1 is more than 0.07(7%) that is generally not accepted. The repeatability precision of other mixing indexes are less than ±0.05(±5%) that are usually accepted. Thus, the mixing indexes considering the combination of mean and dispersion information can ensure the consistency of the calculated results.
5 Conclusions
Reliable quantification of mixing effects is one of the most important and fundamental issues to study the performances of mixers and to improve their designs. Mixing indexes are of great significance to quantify the mixing effects. Hence, mixing indexes used in the field of micromixing should provide reliable calculated results.At present, nearly all the methods to characterize the mixing effects deal with digital images, and intensity information of the digital images is most often applied to estimate the mixing performance. We found the unreliable problems using the mixing indexes based on the intensity dispersion information to estimate the mixing performance. Thus, we inferred that the mixing indexes utilizing only dispersion information of intensity images cannot always give reliable results. In addition, we analyzed the reasons for the unreliable problems in detail. According to the results of the analyses, it was found that the reason for this problem is the mean information of intensity images that changes with the enhancement of mixing. In addition, there are two types of relationships between the mean intensity and mixing performance. One is a positive correlation and the other is a negative correlation. In consideration of the negative correlation between the dispersion information and mixing performance, different formulas are required to define the mixing indexes for estimating the performance of micromixing when the mean information and dispersion information are both considered. To give quantitative and practical mixing indexes, two specific forms of this class of mixing indexes were proposed.
To compare the performances of different mixing indexes, practical criteria of the performances for the quantitative mixing indexes are required. However, currently, there are criteria only to measure the practical value of a quantitative mixing index. Therefore, two practical criteria of performances for the quantitative mixing indexes were put forward to check whether the results are reliable herein. These criteria included reliability and repeatability precision. The more important criterion is the reliability of a quantitative mixing index because it determines the reliability of the calculated result every time. According to the comparisons, the mixing indexes considering the combination of mean and dispersion information can ensure the reliability of the calculated result every time and the repeatability precision was less than ±3.5%.
Therefore, mixing indexes that consider the combination of mean and dispersion information can more reliably represent the mixing performance than the previous mixing indexes.
Acknowledgements
The authors acknowledge the support of the National Natural Science Foundation of China (51175101). The authors would also like to acknowledge the help received from other members of the HIT Fluid and Flow Group.References
- Y. Su, G. Chen and E. Y. Kenig, Lab Chip, 2015, 15, 179–187 RSC.
- T. Matsunaga, H.-J. Lee and K. Nishino, Lab Chip, 2013, 13, 1515–1521 RSC.
- B. Wunderlich, D. Nettels and B. Schuler, Lab Chip, 2014, 14, 219–228 RSC.
- Y. Gambin, C. Simonnet, V. VanDelinder, A. Deniz and A. Groisman, Lab Chip, 2010, 10, 598–609 RSC.
- H. SadAbadi, M. Packirisamy and R. Wüthrich, RSC Adv., 2013, 3, 7296–7305 RSC.
- J. Wang, J. Wang, L. Feng and T. Lin, RSC Adv., 2015, 5, 104138–104144 RSC.
- C.-Y. Lee, C.-L. Chang, Y.-N. Wang and L.-M. Fu, Int. J. Mol. Sci., 2011, 12, 3263–3287 CrossRef CAS PubMed.
- S. Jayaraj, S. Kang and Y. K. Suh, Mechanical Science and Technology, 2007, 21, 536–548 CrossRef.
- J. Aubin, M. Ferrando and V. Jiricny, Chem. Eng. Sci., 2010, 65, 2065–2093 CrossRef CAS.
- V. Hessel, S. Hardt, H. Löwe and F. Schönfeld, AIChE J., 2003, 49, 566–577 CrossRef CAS.
- S. H. Wong, M. C. L. Ward and C. W. Wharton, Sens. Actuators, B, 2004, 100, 359–379 CrossRef CAS.
- F. Schönfeld, V. Hessel and C. Holfmann, Lab Chip, 2004, 4, 2065–2093 RSC.
- S. W. Lee, D. S. Kim, S. S. Lee and T. H. Kwon, J. Micromech. Microeng., 2006, 16, 1067–1072 CrossRef.
- T. J. Johnson, D. Ross and L. Ě. Ĺocascio, Anal. Chem., 2002, 74, 45–51 CrossRef CAS PubMed.
- J. B. Knight, A. Vishwanath, J. P. Brody and R. H. Austin, Phys. Rev. Lett., 1998, 80, 3863–3866 CrossRef CAS.
- M. Hoffmann, M. Schülter and N. Räbiger, Chem. Eng. Sci., 2006, 61, 2968–2976 CrossRef CAS.
- A. D. Stroock, S. K. W. Deřtinger, A. Ajdari, H. A. Stone and G. M. Whitesides, Science, 2002, 295, 647–651 CrossRef CAS PubMed.
- N. Kockmann, T. Kiefer, M. Engler and P. Woias, Microfluid. Nanofluid., 2006, 2, 327–335 CrossRef.
- S. Hardt, H. Pennemann and F. Schönfeld, Microfluid. Nanofluid., 2006, 2, 237–248 CrossRef CAS.
- J.-B. Salmon, A. Ajdari, P. Tabeling, D. Talaga and M. Joanicot, Appl. Phys. Lett., 2005, 86, 094106 CrossRef.
- S. I. Masca, I. R. Rodriguez-Mendieta, C. T. Friel, S. E. Radford and D. A. Smith, Rev. Sci. Instrum., 2006, 77, 055105 CrossRef.
- P. V. P. V. Danckwerts, Appl. Sci. Res., 1952, 3, 279–296 Search PubMed.
- R. H. Liu, M. A. Stremler, K. V. Sharp, M. G. Olsen, J. G. Santiago and R. J. Adrian, J. Microelectromech. Syst., 2000, 9, 190–197 CrossRef.
- Y.-K. Lee, P. T. C. Shih and C.-M. Ho, 2000 ASME International Mechanical Engineering Congress & Exposition Orlando, Florida, 5–10 November 2000, pp. 505–511 Search PubMed.
- T. J. Johnson, D. Ross and L. E. Locascio, Anal. Chem., 2002, 74, 45–51 CrossRef CAS PubMed.
- P. Luo, Y. Cheng, Z. Wang, Y. Jin and W. Yang, Ind. Eng. Chem. Res., 2006, 45, 863–870 CrossRef CAS.
- Z. Liu, Y. Lu, J. Wang and G. Luo, Chem. Eng. J., 2012, 181, 597–606 Search PubMed.
- M. S. Phapal and P. Sunthar, Chem. Phys. Lipids, 2013, 172, 20–30 CrossRef PubMed.
- C.-H. Lin, L.-M. Fu and Y.-S. Chien, Anal. Chem., 2004, 76, 5265–5272 CrossRef CAS PubMed.
- D. F. Swinehart, J. Chem. Educ., 1962, 39, 333–335 CrossRef CAS.
Footnote |
| † Electronic supplementary information (ESI) available: MATLAB program for calculating different mixing indexes of a digital image. See DOI: 10.1039/c6ra23783e |
| This journal is © The Royal Society of Chemistry 2017 |

