
 Open Access Article
 This Open Access Article is licensed under a
 Creative Commons Attribution 3.0 Unported Licence
Nano-metric self-diffusion of Fe: effect of grain size†‡
Jing Gonga,
Neelima Paulb,
Béla Nagyc,
Miklós Dolgosc,
László Bottyánc,
Peter Bönia and
Amitesh Paul *a
*a
aTechnische Universität München, Physik-Department, Lehrstuhl für Neutronenstreuung, James-Franck-Strasse 1, D-85748 Garching, Germany. E-mail: amitesh.paul@frm2.tum.de
bHeinz Maier-Leibnitz (MLZ), TU München, D-85748 Garching, Germany
cWigner Research Centre for Physics, P.O.B. 49, H-1525 Budapest, Hungary
First published on 31st January 2017
Abstract
Changes in the relative 56Fe/57Fe isotope fractions due to Fe self-diffusion, that is active at the grain boundaries, can be monitored non-destructively by neutron reflectometry (NR) in the sub-nanometer length scale with atomic length scale precision. However, since grain boundary diffusion is inherently dependent upon the size of the grains and grain diameter variation perpendicular to the surface of multilayered specimens, it can often give ambiguous results in diffusivity. Here, we report on self-diffusion of Fe in bilayers, with two different thicknesses without concurrent grain growth during the annealing process. The thicknesses limit the size of the grains along the growth direction. Using NR, we find significant differences in the diffusivities as a function of annealing time in the bilayers. These results elucidate the microscopic mechanism of grain size dependent self-diffusion, which may redefine the regimes of diffusion attributed to grain boundary diffusion and volume (or lattice) diffusion.
Introduction
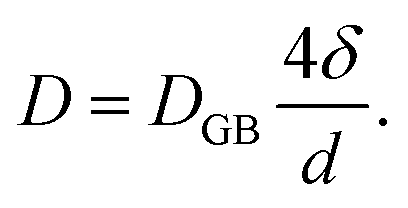
Self-diffusion along grain boundaries (GBs) in one-component materials is a technologically important fundamental process.1,2 A microscopic understanding of the diffusion mechanism in nanostructured, chemically homogeneous materials is important for tailoring their properties. A study of the kinetics of these processes permits the determination of the coefficient of self-diffusion of a substance.3,4 Due to metastability, an unrelaxed state of the material and an increased defect concentration, an extrapolation of the bulk diffusivity may not be appropriate for description of diffusion in thin films. Additionally, diffusion inside grains (volume or lattice diffusion), diffusion via grain boundaries, dislocations and the free surface may lead to faster diffusivity paths than in bulk.5–7 Diffusivity is also a determining feature for a number of application oriented properties of nano-crystalline materials, such as enhanced ductility, diffusion-induced magnetic anisotropy, and improved catalytic activity.8In nano-crystalline metals, grains of 10–20 nm in diameter contain around 20% of grain boundary phase, leading to much higher diffusivities (by few orders) as compared to that in coarse-grained materials. To achieve stability of nanostructures in metal or other materials, GBs can be engineered by controlling the grain size. The Harrison's scheme has laid out three different regimes of diffusion.9 In type A, the overall flux is mainly because of the lattice diffusion, since the grain boundary area will be much smaller than the lattice. In type B, both lattice and grain boundary diffusions can have reasonable contributions. The type-C regime is defined as a regime where the diffusion length  is much smaller than the grain boundary diameter δ. Here D denotes the volume or lattice diffusivity during an isothermal annealing time t. When the temperature is low enough, such that lattice or volume diffusion is negligible compared to grain-boundary diffusion, then D is related to the grain boundary diffusion coefficient DGB, weighted by the grain boundary density factor via
 | (1) |
Here, one assumes a columnar-grained microstructure (closed packed hexagonal grains) with a grain diameter d, equal to the film thickness. Diffusion lengths, which are significantly smaller than the grain size, are of utmost importance due to the fact that grain size evolution is common during the diffusion process. Note that in type B region, we measure D (which involves δ/d), whereas, in region of type C, we measure DGB (independent of δ/d) exclusively.10 Since we are interested in type C region only, hereafter we will identify DGB with D.
In order to realize GBs, exclusive of grain size variation, isotopic multilayers are typically used. Non-destructive techniques, such as neutron reflectometry (NR), are usually used to study nano-metric diffusion lengths in nano-crystalline metals. NR has been demonstrated to measure ultra-low diffusivities down to 10−26 m2 s−1 and ultra-short diffusion lengths below 1.0 nm with a depth resolution of 0.1 nm. Such a small diffusion length allows an extensive characterization of solids in metastable (or non-equilibrium) states. We cite a few examples of GBs studies: H. Tanimoto et al. showed slightly enhanced diffusivity in Fe nano-crystalline structure using radio tracer depth profiling.11 Gupta et al.5,12 studied the effect of an applied compressive stress in 56FeZr/57FeZr multilayers using NR, and found that there is a significant increase in the activation energy with an increase in the strength of applied stress. Schmidt et al.7 investigated the GBs in isotopic Fe multilayers with an annealing temperature between 100–250 °C using NR. At such a low temperature, no significant grain growth was expected.
The studies mentioned above were done on multilayer structures and were based on the assumption that grain structures in the each of the individual layers were equal. The use of multilayers was essential to enhance the effect of diffusion across a number of interfaces of isotopic elements. In spite of the fact that annealing at low temperatures (100–200 °C) will not allow any significant grain growth, columnar grains may still differ in size with an increase in the film thickness or new nucleation sites. In particular, this can occur when the total thickness scales to around few hundreds of nanometers. The growth of grains may be interrupted by a change in growth conditions (e.g. sputtering pressure and/or rate of sputtering) of two successive layers of 56Fe/57Fe, for example. Note that this effect may not be so severe in case of a bilayer system.
Earlier it was shown that in a multilayer structure there might be an evolution of the grain size with an increase in the number of bilayer repetitions.13,14 With an evolution of grain size across a multilayer stack, the diffusivity, which is known to be affected by the grain size or vice versa, can also be altered. GBs with evolving microstructures were reported earlier.15 The kinetic analysis of interdiffusion at magnetic–nonmagnetic interfaces was suggested to show grain growth concurrent with grain boundary diffusion.16 The diffusivity in multilayers is the statistically averaged value over the number of interfaces plausibly with varying diffusivity. As a consequence, the very prerequisite of studying GBs without the effect of a concurring grain growth is often likely to be hampered.
In this paper, we report on GBs on bilayer samples of isotopic Fe with two different grain sizes. The thickness of the Fe thin films was used as a measure of their grain sizes. This would not allow a size variation of the grains within a sample along the growth axis. NR profiles, affected by the self-diffusion process, were used to extract the diffusivities in all samples. We find significant differences in diffusivities of the bilayers, depending upon the respective grain sizes. Their diffusion kinetics redefines the mechanism of grain size dependent self-diffusion.
Samples details
Two types of isotopic bilayer samples, each with a different thickness, were prepared, in order to get different grain sizes in two different samples without an evolution of the grain size within a sample. It is well demonstrated that the average grain size is proportional to the film thickness.17–19 Si(100) wafers were used as substrates for the deposition of 56Fe(5 nm)/57Fe(5 nm)/Pt(4 nm), labelled as Fe5. The second bilayer was prepared with a smaller Fe thickness (with the purpose of demonstrating the effect of grain size on diffusion) on a Si(111) wafer with the composition 56Fe(2 nm)/57Fe(2 nm)/Pt(20 nm), labelled as Fe2. Fe2 sample is also useful to show a drastic change in the relaxation kinetics that is expected for thinner layers.The crystallographic orientations of the substrates do not affect the grain growth (mediated by the thermal expansion coefficient of the film and substrate) because of the four-fold and three-fold crystal symmetry in (100) and (111) directions, respectively. The Pt layer on top is used mainly to avoid Fe oxidation. Note that here we intend to utilize the significant difference in the neutron scattering lengths of 56Fe (9.45 fm) and 57Fe (2.3 fm) to study self-diffusion of Fe.
The samples were prepared at room temperature with molecular-beam epitaxy (MBE) technique (Meca-2000 MBE) in a vacuum chamber with a base pressure of about 1 × 10⁻⁹ mbar. Before deposition, the Si wafers were cleaned with ethanol and dried by nitrogen (N2) gas flow. The metallic layers of 56Fe (from an electron gun), 57Fe (from a Knudsen cell) and Pt (from an electron gun) were deposited at the rate of 0.1 Å s−1, 0.05 Å s−1 and 0.09 Å s−1, respectively. The maximum pressure during the evaporation was 5 × 10⁻⁸ mbar. The deposited samples were cut into several pieces (5 × 15 mm2 each) and then annealed (in DCA MBE M600 chamber) for different annealing times. In effect there was no isotopic enrichment on the natural Fe (from e-gun), i.e. the natural aboundance (0.92%) applies.
For the set of the sample Fe5 we have used five different annealing times whereas for the sample set Fe2, two different annealing times in a vacuum of 5 × 10⁻⁹ mbar were used. The annealing times were t0, t5, t30, t150, t400, t3000, where the subscripts denote the annealing times in minutes. The annealing temperature was kept low at 473 K in order to (i) keep the GBs factor dominating while damping the volume diffusion factor and to (ii) make the interdiffusion of Fe–Pt minimal.20 At low temperature only grain boundary diffusion that is type C is expected because of lack of vacancies for lattice diffusion.
Detailed characterization of the samples have been reported earlier in ref. 21. For example, the polycrystalline nature of the samples were identified by X-ray diffraction (XRD). The absence of any additional phase due to a insignificant Fe–Pt intermixing was also supported by the XRD measurements for Fe2.21 The layer structure and the stability of the structure with insignificant changes in surface roughness after annealing were also reported from the analysis of the X-ray reflectivity (XRR) data of the bilayers. Cross-sectional transmission electron microscopy (TEM) and statistically averaging measurements such as X-ray diffuse scattering (XDS) and grazing incidence small angle scattering (GISAXS) supported the absence of concurrent grain growth upon annealing for all samples.
Neutron reflectivity measurements were performed at room temperature at the reflectometer instrument GINA at the Budapest neutron center in Hungary.22 The neutron wavelength was 0.463 nm. The data treatment was done with in-house programs.
Neutron reflectivity
Fig. 1(a) and 2(a) show the one-dimensional neutron reflectivity profiles along QZ of the samples Fe5 and Fe2 for different annealing times. The best fits are shown with cyan lines. The obtained average scattering length density (SLD) values (ρn) and thickness, that have been extracted from the NR fits of the two samples are shown in the SLD plots of Fig. 1(b) and 2(b), respectively. In our fits, we have considered an interdiffusion layer (td) between the two isotopic layers, whose thickness varies from sample to sample and a Fe–Pt intermixed layer at the top following the earlier XRR results.21 We did not find any interdiffused layer between the 56Fe and 57Fe layers for any of the un-annealed samples. The typical error bars are ±0.5 nm for the thickness of Pt, ±0.5 nm for the intermixed Fe–Pt layer thickness, ±0.1 nm for interdiffused layer thickness, ±0.1 nm for the 56Fe and 57Fe layer thicknesses and 0.3 × 10⁻⁶ Å−2 for the SLD values.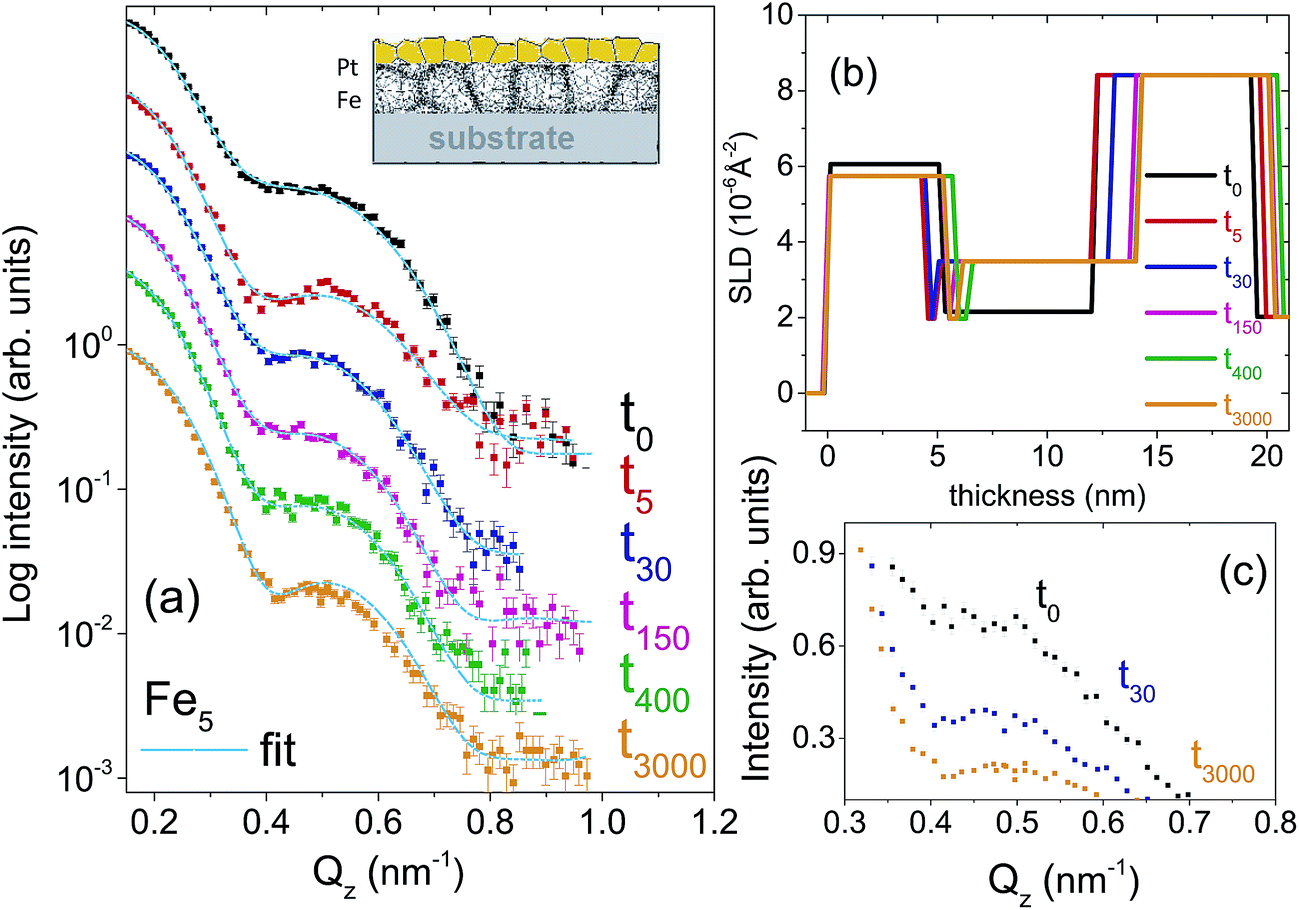 | ||
| Fig. 1 (a) NR data versus QZ at 300 K of Fe5 bilayers for various annealing times are shown along with their best fits (solid lines). The curves are shifted in intensity for clarity. A sketch of the microstructure of the sample is also shown. (b) Plot of SLD (ρn) in 10−6 Å−2 from the fits to the NR data as a function of layer thickness. (c) NR data versus QZ is plotted on a linear scale to show the decrease in intensity with two different annealing times with respect to the un-annealed specimen. | ||
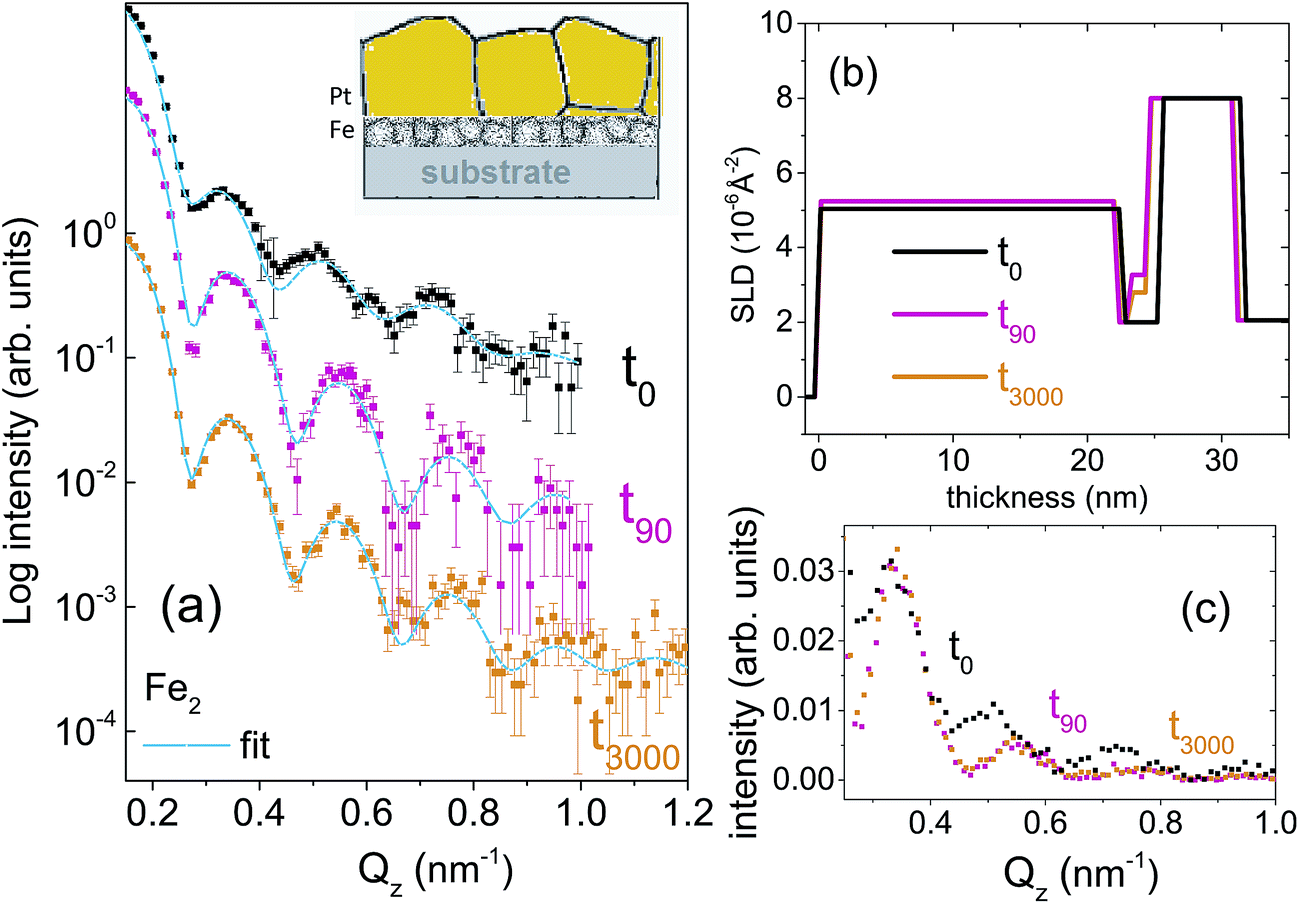 | ||
| Fig. 2 (a) NR data versus QZ at 300 K of Fe2 bilayers for various annealing times are shown along with their best fits (solid lines). The curves are shifted in intensity for clarity. A sketch of the microstructure of the sample is also shown. (b) Plot of SLD (ρn) in 10−6 Å−2 from the fits to the NR data as a function of layer thickness. (c) NR data versus QZ is plotted on a linear scale to show the decrease in intensity with two different annealing times with respect to the un-annealed specimen. | ||
A gradual decrease in intensity with annealing time is shown for the samples Fe5 and Fe2 in Fig. 1(c) and 2(c). This intensity decrease, which is predominantly due to interdiffusion between the two isotopic Fe layers, demonstrates the sensitivity of the technique. The maximum decrease in intensity is visible after 5 minutes, followed by a gradual decrease upon further annealing. This slow decrease in intensity after an initial drop in intensity is typical of GBs, usually observed when the annealing temperature is kept low as it is here. We do not need to normalize the data with respect to the Fresnel reflectivity since we are interested here in the intensity ratio. In this regard, it may also be noted that the effect of interface roughness and Fe–Pt intermixing and that due to inter-diffusion may affect the NR profiles differently. We have discussed this issue in detail in the ESI† with respect to a bilayer sample.
Self-diffusion
In calculating self-diffusion we have considered the thickness of the interdiffused layer using a block potential method instead of an alternative method of error-function.23 In fact there is hardly any difference between the block-potential and error-function method as it is a mere renormalization of the same single width-type fit parameter – provided we fix the SLD of the block to the average of the SLDs of the two neighboring layers. The physics is in the temperature dependence of the profiles, i.e. in the pre-exponential factor and the activation energy.a. Calculating diffusivity from the interdiffused layer
Diffusion in bilayer samples is determined from the thicknesses of the interdiffused layers. We have used the following formula for diffusivity
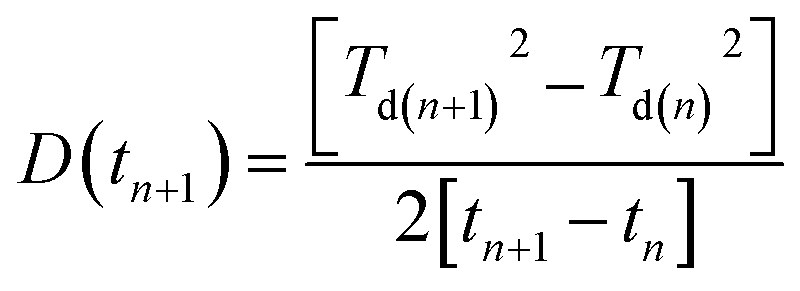 | (2) |
The diffusivities with annealing time for the bilayers Fe5 and Fe2 are plotted in Fig. 3(a) calculated using eqn (2). Here, we have considered the diffusivities which correspond to the annealing times in-between the annealing steps. The time at which they attain saturation and their diffusivity values are in agreement with the earlier studies for similar Fe thickness.7 The grain boundary diffusivity is seen to decrease with annealing time. Following earlier studies on similar systems, this decrease is unexpected at 473 K, as it is expected at lower temperatures. This decrease can be attributed to structural relaxation which concur with the GBs. The local free volume is gradually reduced due to energy minimization process of the grains during annealing. For Fe2, the diffusivity has attained a near saturation state and only a small change in the diffusivity is observed after t90. Moreover, the grain boundary diffusion for Fe2 has taken place at a faster rate as compared to Fe5. This indicates that the different grain sizes in the two bilayers have affected the diffusivity, significantly. Since these annealing experiments were performed only at one temperature, the determination of the activation energies and pre-exponential factors was not possible.
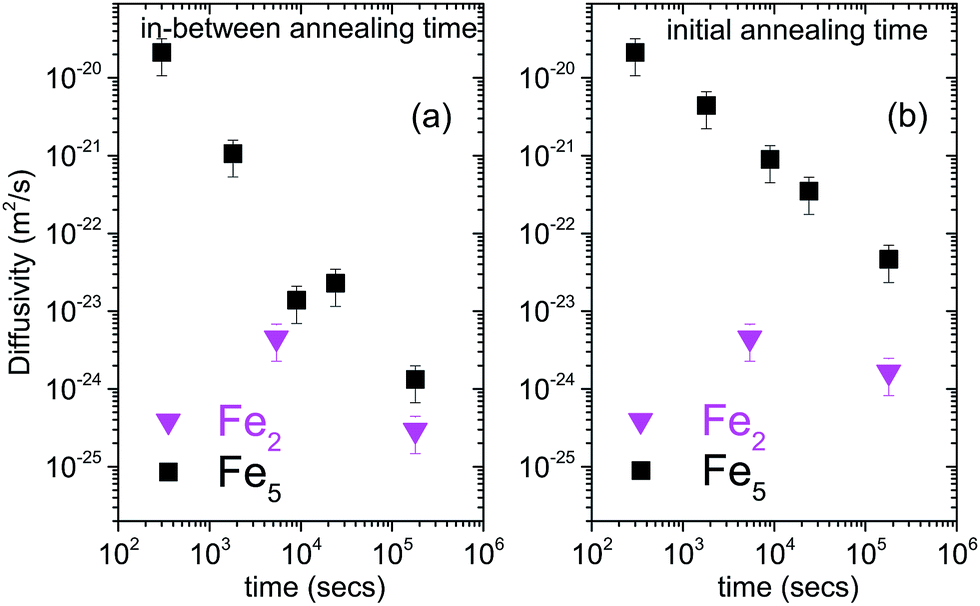 | ||
| Fig. 3 (a) log–log plot of grain boundary self-diffusion in bilayers Fe5 and Fe2 as a function of annealing time, calculated using eqn (2) and considering the diffusivities which correspond to the annealing times between the annealing steps. (b) log–log plot of grain boundary self-diffusion in bilayers Fe5 and Fe2 as a function of annealing time, calculated using eqn (2) and considering the diffusivities calculated with respect to the un-annealed state at time t0. The plot of diffusivities for in-between annealing time gives the differential diffusivity while that for initial annealing time gives the absolute diffusivity. | ||
Alternatively, one can consider the diffusivities calculated with respect to the un-annealed state (initial annealing time) at time t0. Such a plot of the diffusivities with annealing time calculated using eqn (2) for the bilayers Fe5 and Fe2 is also shown in Fig. 3(b). The overall diffusivities are somewhat enhanced here due to the different averaging procedures involved by considering in-between annealing times. Here also, the grain boundary diffusivity is seen to decrease with annealing time.
b. Diffusion length
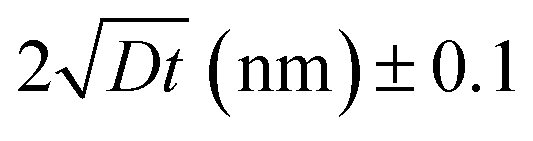
A plot of the diffusion length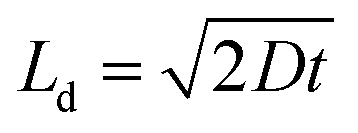 versus annealing time is plotted for the bilayers in Fig. 4 following eqn (2) and by considering the diffusivities calculated with respect to the un-annealed state at time t0. The sub-nanoatomic diffusion lengths show different trends with annealing time, depending upon the different grain diameters. The diffusion lengths are higher in the bilayer which has a higher Fe thickness (Fe5).
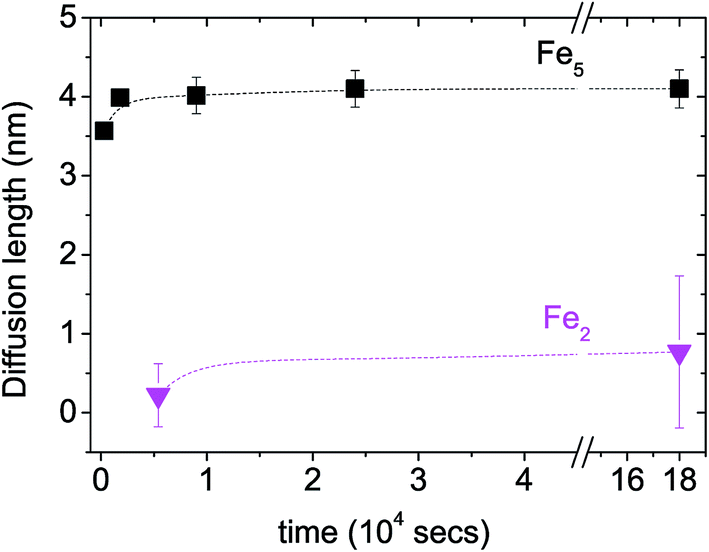 | ||
Fig. 4 Grain boundary self-diffusion length  in bilayers as a function of annealing time considering the diffusivities calculated with respect to the un-annealed state at time t0. in bilayers as a function of annealing time considering the diffusivities calculated with respect to the un-annealed state at time t0. | ||
c. Volume fraction and grain diameter
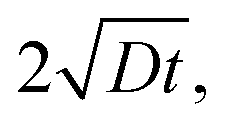
In polycrystalline materials, grain boundaries are associated with excess energy which becomes the thermodynamic driving force in grain growth. Grain growth is driven by the reduction of the total grain boundary surface area. Thus, with an increase in the grain boundary area, grain size is reduced or there is an increase in the number of grains. Grain boundary diffusion is primarily assumed perpendicular to the film-plane (for one-dimensional grain growth).In the type C experimental regime, DGB = D is determined directly and in the type B experimental regime, the value of d is addressed via δ.26 In the case of type C kinetic regime, typically at low temperatures, atoms diffuse along the grain boundaries and do not penetrate into the grain interiors. For the case of self-diffusion, one may define a parameter α describing the leakage from grain boundaries into the grain interior, and is given by
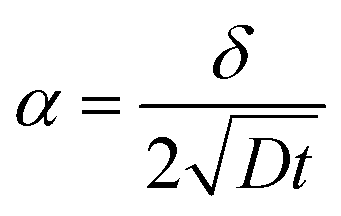 | (3) |
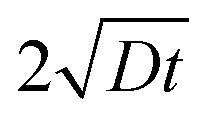 is around 5.65 nm (for Fe5) and 1.13 nm (for Fe2). Thus considering the lower/upper limit of the type C regime, δ can be around 0.5/5 nm for Fe5 and around 0.1/1 nm for Fe2.
We can assume the d for Fe5 and Fe2 as 11 nm and 5 nm, respectively.18,19 As we are concerned in diffusion within the range of GBs and not volume diffusion, the GBs should correlate with the volume fraction (VGB) of the grain boundary phase considering a type B regime.7 If the surface area of the layer populated by the grain boundaries is AGB, where the grain volume is Av and δ is the grain boundary width then one can write
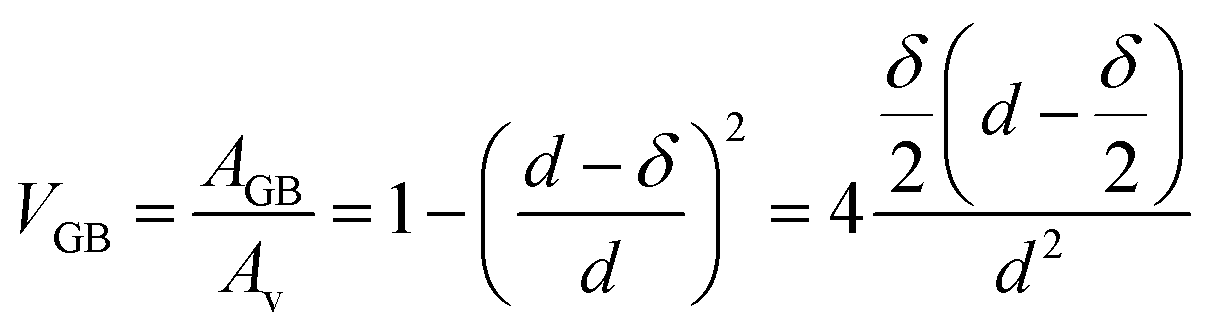 | (4) |
The results of the volume fraction for the bilayers are given in Table 1.
 speculated grain boundary width (δ) and the corresponding VGB values calculated using eqn (4) within the Fe layers of each bilayer sample
| Sample | d (nm) ± 0.2 | Ld (nm) ± 0.1 |
|
δ (nm) ± 0.1 | VGB (%) ± 2 |
|---|---|---|---|---|---|
| Fe5 | 11 | 4.0 | 5.65 | 0.5/5 | 9/70 |
| Fe2 | 5 | 0.8 | 1.13 | 0.1/1 | 4/36 |
Earlier, it has been shown by Shimokawa et al.27 that the relative proportion of the grain boundary region in nano-crystalline metals versus grain size can be simulated. Similarly, here in Fig. 5, we have simulated variation of VGB for different δ values as a function of grain diameters (d). The values of VGB fraction for the two bilayers Fe5 and Fe2, thus obtained, are around 0.09 and 0.7 (for δ = 0.5 nm and 5 nm) and 0.04 and 0.36 (for δ = 0.1 nm and 1 nm), respectively. Here we have shown that VGB for d = 11 nm is always higher than that for d = 5 nm considering different δ values. Note that in the type B regime, δ is supposed to increase with D. In the type C (grain boundary diffusion) regime, diffusivity is no longer dependent upon δ.10
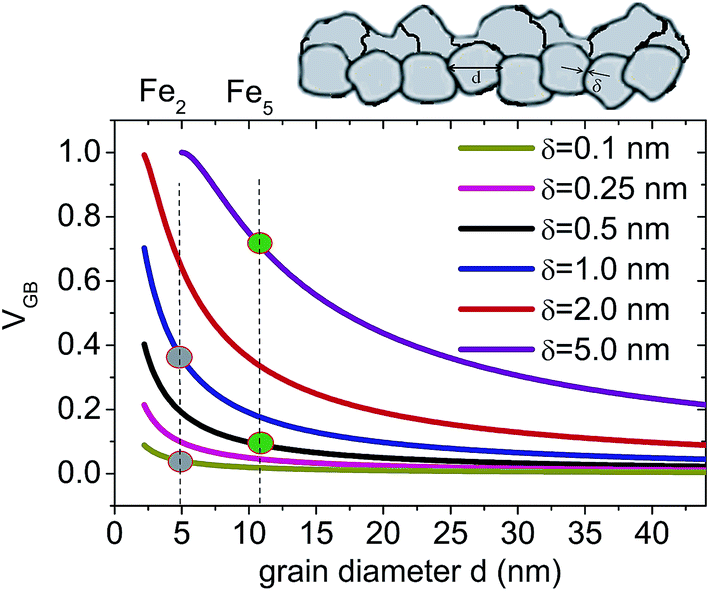 | ||
| Fig. 5 Grain boundary volume fraction VGB as a function of grain diameter (d) for different grain boundary wall widths δ following eqn (4). A sketch of the granular structure in the layers with grain diameter d and grain boundary width δ is shown. The gray (green) circles mark the possible fractions corresponding to δ = 0.5 nm (δ = 5 nm) for Fe5 and δ = 0.1 nm (δ = 1 nm) for Fe2 samples representing two different grain sizes. | ||
Summary and conclusion
Grain boundary self-diffusion processes has been studied in isotope-labelled bilayers using NR due to its unique depth resolution of the order of 0.1 nm. Two different layer thickness in two bilayers define their individual grain sizes. To restrict the diffusion process in the grain boundary regime, we have used low temperature (473 K) for various annealing durations.The diffusivity profiles and hence the diffusion lengths extracted from the fits to the NR data show distinct differences in the samples with increase in annealing time. Our diffusivity results from the Fe5 and Fe2 bilayers are in the GBs regime as they shows gradual decrease in diffusivity with annealing time. Note that the diffusivities reported here are without any concurrent grain growth or grain size dependency upon annealing. Fe2 bilayer (with thinner layers) shows a drastic change in the relaxation kinetics as compared to Fe5 bilayer (with thicker layers). The difference can be understood from the difference in their respective volume fractions due to different δ widths associated with different d values. In the type C regime, the diffusion is expected to be independent of the grain boundary diameter while in the type B regime it is dependent. Thus any difference between the two cases of the bilayers would signify that one can be in the crossover regime of type B and C even at temperature as low as 473 K. Our results therefore elucidate the microscopic mechanism of grain size dependent self-diffusion and redefine the boundaries of grain boundary and volume diffusion.
Conflict of interest
The authors declare no competing financial interests.Acknowledgements
J. G., B. N. and M. D. prepared the samples and did the NR measurements. A. P. and N. P. did the associated grazing incidence X-ray measurements. Thanks are also due to S. Pütter and S. M. Amir for assisting J. G. in sample annealing. All authors including P. B. and L. B. read the manuscript. A. P. conceived and designed the work, analyzed the data, coordinated the work and also wrote the manuscript. This work was supported by the German Research Foundation (DFG) and the Technische Universität München within the Open Access Publishing Funding Programme.References
- H. Mehrer, Diffusion in Solids Fundamentals, Methods, Materials, Diffusion-Controlled Processes, ed. M. Cardona, P. Fulde, K. von Klitzing, R. Merlin, H.-J. Queisser and H. Störmer, Springer-Verlag Berlin Heidelberg, 2007 Search PubMed.
- A. Seeger and H. Mehrer, Analysis of Self-diffusion and Equilibrium Measurements, in Vacancies and Interstitials in Metals, ed. A. Seeger, D. Schumacher, J. Diehl and W. Schilling, North-Holland Publishing Company, Amsterdam, 1970 Search PubMed.
- I. Kaur, Y. Mishin and W. Gust, Fundamentals of Grain and Interphase Boundary Diffusion, Wiley & Sons LTD, Chichester, New York, 1995 CrossRef CAS; S. V. Divinski, M. Lohmann and C. Herzig, Acta Mater., 2001, 49, 249–261 CrossRef CAS.
- J. M. Coey, Magnetism and magnetic materials, Camvridge University press, 2010 Search PubMed.
- M. Gupta, A. Gupta, S. Chakravarty, R. Gupta and T. Gutberlet, Phys. Rev. B: Condens. Matter Mater., 2006, 74, 104203 CrossRef.
- E. Hüger, L. Dörrer, J. Rahn, T. Panzner, J. Stahn, G. Lilienkamp and H. Schmidt, Nano Lett., 2013, 13, 1237–1244 CrossRef PubMed.
- H. Schmidt, S. Chakravarty, M. Jiang, E. Hüger, P. K. Parida, T. Geue, J. Stahn, U. Tietze and D. Lott, J. Mater. Sci., 2012, 47, 4087–4092 CrossRef CAS.
- Nanomaterials: synthesis, properties, and applications, ed. A. S. Edelstein and R. C. Cammarata, Institute of Physics, Bristol, 1996 Search PubMed; Nanostructured materials: processing, properties and applications, ed. C. C. Koch, Noyes Publications, William Andrew Publishing, Norwich, NY, 2002 Search PubMed.
- P. Heitjans and J. Kärger, Diffusion in condensed matter: methods, materials, models, Springer, Berlin, 2005 Search PubMed.
- A. Inoue, H. Nitta and Y. Iijima, Acta Mater., 2007, 55, 5910–5916 CrossRef CAS.
- H. Tanimoto, P. Farber, R. Würschum, R. Z. Valiev and H. E. Schaefer, Nanostruct. Mater., 1999, 12, 681–684 CrossRef.
- M. Gupta, A. Gupta, R. Gupta and T. Gutberlet, J. Phase Equilib. Diffus., 2005, 26, 458–465 CrossRef CAS.
- A. Paul, E. Kentzinger, U. Rücker, D. E. Bürgler and P. Grünberg, Phys. Rev. B: Condens. Matter Mater., 2004, 70, 224410 CrossRef.
- A. Paul, N. Paul, J. Jutimoosik, R. Yimnirun, S. Rujirawat, B. Höpfner, I. Lauermann, M. Lux-Steiner, S. Mattauch and P. Böni, Phys. Rev. B: Condens. Matter Mater., 2013, 87, 014431 CrossRef.
- L. Klinger and E. Rabkin, Int. J. Mater. Res., 2009, 100, 530–535 CrossRef CAS.
- I. Hashim, H. A. Atwater, K. T. Y. Kung and R. M. Valletta, J. Appl. Phys., 1993, 74, 458–464 CrossRef CAS.
- A. R. Modak, D. J. Smith and S. S. P. Parkin, Phys. Rev. B: Condens. Matter Mater., 1994, 50, 4232 CrossRef CAS.
- C. Wild, N. Herres and P. Koidl, J. Appl. Phys., 1990, 68, 973–978 CrossRef CAS; A. J. Dammers and S. Radelaar, Two-Dimensional Computer Modelling of Polycrystalline Film Growth, Textures Microstruct., 1991, 14, 757–762 CrossRef.
- Paritosh, D. J. Srolovitz, C. C. Battaile, X. Li and J. E. Butler, Acta Mater., 1999, 47, 2269–2281 CrossRef CAS.
- T. Kaiser, W. Sigle, D. Goll, N. H. Goo, V. Srot, P. A. Van Aken and W. Jager, J. Appl. Phys., 2008, 103, 063913 CrossRef.
- J. Gong, N. Paul, B. Nagy, M. Dolgos, L. Bottyán, P.-M. Buschbaum, P. Böni, J.-G. Zheng and A. Paul, J. Appl. Crystallogr., 2016, 49, 1682–1692 CrossRef CAS.
- L. Bottyán, D. G. Merkel, B. Nagy, J. Füzi, S. Sajti, L. Deák, G. Endrőczi, A. V. Petrenko and J. Major, Rev. Sci. Instrum., 2013, 84, 015112 CrossRef PubMed.
- D. G. Merkel, S. Sajti, C. Fetzer, J. Major, M. Major, R. Rüffer, A. Rühm, S. Stankov, F. Tanczikó and L. Bottyán, J. Phys.: Conf. Ser., 2010, 211, 012029 CrossRef.
- M. Stamm, S. Huttenbac, G. Reiter and T. Springe, Europhys. Lett., 1991, 14(5), 451–456 CrossRef CAS.
- S. Chakravarty, M. Gupta, H. Schmidt and A. Gupta, Diffusion Fundamentals, 2008, 8, 10 Search PubMed.
- D. Prokoshkina, V. A. Esin, G. Wilde and S. V. Divinski, Acta Mater., 2013, 61, 5188–5197 CrossRef CAS.
- T. Shimokawa, A. Nakatani and H. Kitagawa, Phys. Rev. B: Condens. Matter Mater., 2005, 71, 224110 CrossRef.
Footnotes |
| † Electronic supplementary information (ESI) available. See DOI: 10.1039/c6ra28310a |
| ‡ PACS numbers: 66.30.Fq, 61.05.fj. |
| This journal is © The Royal Society of Chemistry 2017 |