 Open Access Article
Creative Commons Attribution 3.0 Unported Licence
Large-scale synthesis of uniformly loaded cobalt nanoparticles on alumina for efficient clean fuel production†
Ji Chan Park *ab,
Jae In Kwona,
Shin Wook Kanga,
Dong Hyun Chunab,
Ho-Tae Leea,
Heon Junga and
Jung-Il Yang*a
aClean Fuel Laboratory, Korea Institute of Energy Research, 152 Gajeong-Ro, Daejeon, 34129, Republic of Korea. E-mail: jcpark@kier.re.kr; Tel: +82-42-860-3605
bAdvanced Energy and Technology, University of Science and Technology, 217 Gajeong-Ro, Daejeon, 34113, Korea
First published on 27th January 2017
Abstract
Large-scale synthesis of cobalt nanoparticles supported on alumina (Co/Al2O3), which has well dispersed metallic cobalt around 15 nm, was conducted via a simple melt infiltration process of a cobalt hydrate salt and subsequent thermal reduction. The catalytic performance of Co/Al2O3 was studied for Fischer–Tropsch synthesis in order to optimize the liquid fuel productivity for target hydrocarbon products controlled by reaction pressures and temperatures. The catalyst showed promising CO conversions up to 76% with high hydrocarbon productivity (∼1.0 gHC gcat−1 h−1) and good stability.
1. Introduction
Fischer–Tropsch synthesis (FTS) is a catalytic polymerization process for converting synthesis gas (a mixture of CO and H2) into long-chain hydrocarbons to produce clean liquid fuels from fossil resources, such as natural gas, biomass or coal.1–3 Especially, in the process of synthesis gas derived from natural gas, cobalt supported catalysts have been used because of their high FTS activity and selectivity for linear paraffins.4 In recent years, selectivity control for the hydrocarbon products has been a big challenge in FTS.5,6 For instance, for the selective production of gasoline-range hydrocarbon products (C5–C12), hybrid cobalt catalysts including zeolite compounds such as ZSM-5 as a cracking catalyst were exploited.7,8 Until now, numerous studies on the preparation of cobalt-based FTS catalysts have been reported using various synthetic methods, such as sol–gel, impregnation, co-precipitation, deposition–precipitation, chemical vapour deposition and colloidal methods.9 Typically, the preparation variables of metal/promoter loading, preparation method, pre-treatment, and so on, significantly affect the catalyst performance in FTS.10–14Study on nano-catalysis has rapidly grown with the addition of new nanomaterials for various catalytic reactions.15–19 Along this line, the development of nanostructured catalysts was conducted, not only for fundamental study using computational simulations or theoretical backgrounds, but also for industrial application.20–22 Surface science studies, in particular, have contributed to fundamental understanding of nanostructured catalyst and catalysis.23 However, in many cases, large-scale synthesis of nanocatalysts were still restricted by complex synthetic processes that were expensive and took much time, as well as by environmental problems caused by the use of harmful solvents. In particular, large-scale nanoparticle preparation by solution phase was very difficult.24,25 In addition, the nanoparticles prepared using surfactants as stabilizer, have organic layers on their surface, sometimes retarding the activity of the catalyst.26
For these reasons, many commercial catalysts, so far, have been produced by a simple process involving mixing, shaking and baking process. It is needed to develop more economical and reproducible mass production methods for nanocatalyst having high activity and promising catalytic performance.
Recently, de Jong et al. reported the melt infiltration process as an emerging technique with no additional solvent use.27 It could be utilized as a fast, convenient route to prepare various supported metal catalysts that contain small and well dispersed active nanoparticles inside robust supports. Herein, we demonstrate a simple and eco-friendly preparation method for mass production of Co/Al2O3 nanocatalyst, via a melt infiltration process without use of any organic solvent and an optimum thermal reduction condition. A commercially available alumina with high porosity and surface area was exploited as the support for large-scale production of the catalyst. The catalytic performance of the catalyst was optimized by conducting FTS reactions with control of the reaction conditions (10 and 20 bar, 230–260 °C). Without additional use of a cracking catalyst, the degree of carbon chain growth was controlled by the Co/Al2O3 nanocatalyst under varied reaction conditions. Under the optimum condition, the Co/Al2O3 nanocatalyst shows high FTS activity (∼1.4 × 10⁻⁴ molCO gCo−1 s−1), with good stability.
2. Experimental
2.1 Chemicals
Cobalt(II) nitrate hexahydrate (Co(NO3)2·6H2O, ACS reagent, ≥98%) was purchased from Sigma-Aldrich. A gamma-alumina powder was obtained from Strem Chemical, Inc. The chemicals were used as received without further purification.2.2 Large-scale synthesis of Co/Al2O3 nanocatalyst
For the preparation of the Co/Al2O3 nanocatalyst with a theoretical Co load of 15 wt% in the reduced catalyst, 26.1 g of Co(NO3)2·6H2O and 30.0 g of Al2O3 was physically mixed in a mortar for several minutes under ambient conditions, until the colour of the powder was homogeneously pink. The mixed powder was then aged in a polypropylene bottle at 60 °C in a tumbling oven. After aging for 24 h, the sample was cooled under an ambient atmosphere and transferred to an alumina crucible in a furnace. Finally, the cobalt-incorporated alumina powder was slowly heated at a ramping rate of 3.5 °C min−1 up to 450 °C under a hydrogen flow of 1.0 L min−1. The sample was held at the same temperature for 4 h under hydrogen gas. After the thermal reduction, the Co/Al2O3 nanocatalyst was cooled to room-temperature and immediately submerged in ethanol (0.2 L) under a flow of nitrogen (1.0 L min−1) in order to minimize surface oxidation of the cobalt particles. The black powder immersed in ethanol was simply separated by a magnet and dried in a vacuum oven at room temperature. The final Co/Al2O3 powder was pressed into pellets; then the resulting catalyst disk was crushed and sieved to yield 300–600 μm particles for a test in a fixed-bed reactor.2.3 Fischer–Tropsch synthesis
Fischer–Tropsch synthesis reactions were performed in a down-flow fixed-bed stainless steel reactor tube with an inner diameter of 5 mm. Typically, the catalyst (0.5 g) was diluted with glass beads (425–600 μm, 2.5 g) to prevent hot-spot generation, and then loaded in the catalyst bed. The reaction was carried out at 230–260 °C under 10 and 20 bar for 48 h using a reactant gas (H2/CO = 2.0, GHSV = 6.8 NL gcat−1 h−1). The composition of the outlet gases was analysed using a gas chromatograph (DS Science, iGC7200) equipped with a thermal conductivity detector (TCD) and a flame ionization detector (FID). The flow rates of the outlet gases were measured using a wet-gas flow meter (Shinagawa Co.). After FTS reaction for 48 h, the solid hydrocarbon products were collected in a hot trap (240 °C), and the liquid hydrocarbon products and water were collected in a cold trap (0 °C). The isolated wax and liquid products were analysed using an offline gas chromatograph (Agilent, 6890N) and the simulated distillation method (ASTM D2887).2.4 Characterization
The catalysts were characterized using high-resolution transmission electron microscopy (HR-TEM, Tecnai TF30 ST), a titan double Cs corrected TEM (Titan cubed G2 60-300), and high resolution powder-XRD (Rigaku SmartLab). For TEM analysis, samples were prepared by putting a few drops of the corresponding colloidal solutions on lacey carbon-coated copper grids (Ted Pellar, Inc). Hydrogen chemisorption measurement was carried out using a Micromeritics ASAP 2020 C. Before measurement, the sample was heated in flowing hydrogen gas to 400 °C and was held at the same temperature for 10 h. The H2 adsorption isotherm was measured at 35 °C. Nitrogen sorption isotherms were measured at −196 °C with a Tristar II 3020 surface area analyser. Before measurements, the samples were degassed in a vacuum at 300 °C for 4 h.3. Results and discussion
3.1 Synthesis of Co/Al2O3 nanocatalyst
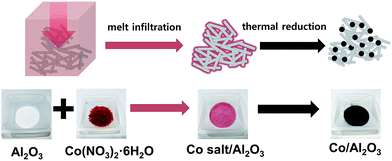
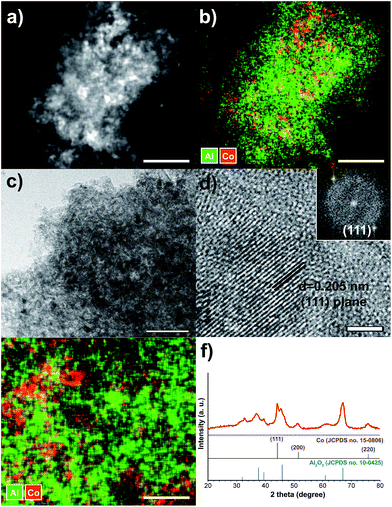
Scheme 1 demonstrates the simple procedure for synthesis of Co/Al2O3 nanocatalyst with photos of the corresponding materials. A gamma-phase alumina was chosen as support, because it can strongly interact with active nanoparticles, maintaining small cobalt crystallites.28 Based on the pore volume of the alumina support used, cobalt nanoparticles were loaded to obtain uniform cobalt dispersion with the optimum Co content. Using a 0.87 gcobalt salt/galumina ratio, the active Co nanoparticles were successfully embedded in the porous alumina support. The Co-loading content after the final thermal treatment was calculated to be nominally 15 wt% on the basis of Co converted from the cobalt nitrate salt. First, the hydrated cobalt salt was melt-infiltrated into the alumina powder by grinding at room temperature with subsequent aging at 60 °C for 24 h in a tumbling oven. Next, the infiltrated cobalt salt inside the alumina pore was decomposed into tiny Co nanoparticles by thermal reduction at 450 °C under a flow of hydrogen. The high-angle annular dark-field scanning transmission electron microscopy (HAADF-STEM) image showed bright dots, indicating the Co nanoparticles in the porous alumina support (Fig. 1a). The elemental mapping of cobalt (red) and aluminium (green) demonstrated a uniform particle dispersion without any extremely agglomerated particles (Fig. 1b and e). TEM analysis also revealed the status of Co nanoparticles as black dots (Fig. 1c). The high-resolution TEM (HRTEM) image and corresponding Fourier-transform pattern represented single crystal of metallic cobalt with a distance of 0.205 nm between neighbouring fringes, which correspond to the (111) planes of face-centered-cubic cobalt (Fig. 1d). The average particle size was measured to be 15.2 ± 2.7 nm in the TEM images (Fig. 1c, S1, ESI†). The X-ray diffraction (XRD) spectrum of Co/Al2O3 nanocatalyst matched to the metallic Co (JCPDS no. 15-0806; space group, Fm![[3 with combining macron]](https://www.rsc.org/images/entities/char_0033_0304.gif) m) and gamma-phase Al2O3 (JCPDS no. 10-0425; space group, Fd
m) and gamma-phase Al2O3 (JCPDS no. 10-0425; space group, Fd![[3 with combining macron]](https://www.rsc.org/images/entities/char_0033_0304.gif) m) (Fig. 1f). Major peaks of alumina were observed at 2θ = 37.6°, 45.9°, and 67.0°. The peak at 2θ = 44.2°, which was assigned to the reflections of the (111) plane in the fcc-Co, reflects tiny Co single-crystal domain sizes. The average size of the Co crystals was estimated to be 14.2 nm, from the broadness of the (111) peak using the Debye–Scherrer equation, which well-matched that observed in the TEM images. The average cobalt size of Co/Al2O3 nanocatalyst was also measured to be 17.1 nm, based on calculation of the Co dispersion (5.62%) obtained by H2 chemisorption.
m) (Fig. 1f). Major peaks of alumina were observed at 2θ = 37.6°, 45.9°, and 67.0°. The peak at 2θ = 44.2°, which was assigned to the reflections of the (111) plane in the fcc-Co, reflects tiny Co single-crystal domain sizes. The average size of the Co crystals was estimated to be 14.2 nm, from the broadness of the (111) peak using the Debye–Scherrer equation, which well-matched that observed in the TEM images. The average cobalt size of Co/Al2O3 nanocatalyst was also measured to be 17.1 nm, based on calculation of the Co dispersion (5.62%) obtained by H2 chemisorption.
N2 sorption experiments for pristine Al2O3 and the Co/Al2O3 nanocatalyst exhibited type IV adsorption–desorption hysteresis. The Brunauer–Emmett–Teller (BET) surface areas of the alumina and the Co/Al2O3 nanocatalyst were calculated to be 205 m2 g−1 and 196 m2 g−1, respectively (Fig. 2a). The total pore volume of the Co/Al2O3 nanocatalyst was found to be 0.31 cm3 g−1, which is about 70% of the initial alumina (0.44 cm3 g−1). The significant decrease in the pore volume of the Co/Al2O3 nanocatalyst was attributed to the cobalt occupancy. It demonstrates that the cobalt particles are mainly located inside the alumina pores, not on the outside. Applying the Barrett–Joyner–Halenda (BJH) method, the small pore sizes were obtained by the adsorption/desorption branches (Fig. 2b). Because of the occupancy of the alumina pores by the cobalt particles, the pore size in the Co/Al2O3 was also slightly decreased, compared to those of pristine Al2O3 (6.5 nm at the desorption branch and 8.6 nm at the adsorption branch).
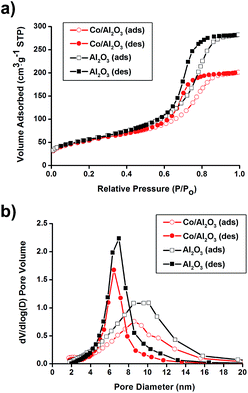 | ||
| Fig. 2 (a) N2 adsorption/desorption isotherms and (b) pore size distribution diagrams of pristine Al2O3 and Co/Al2O3 nanocatalyst. | ||
3.2 Fischer–Tropsch synthesis reaction test
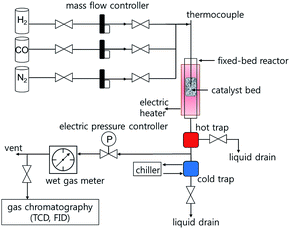
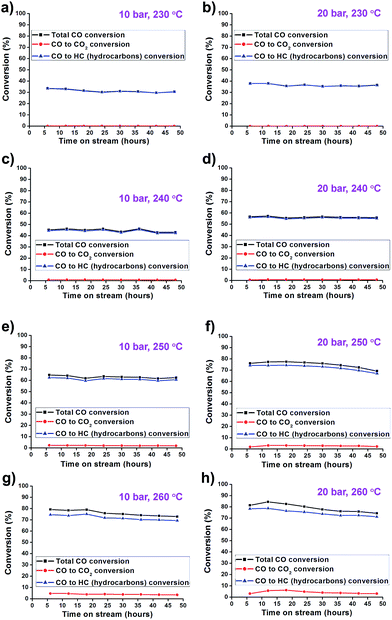
The catalytic activity of the synthesized Co/Al2O3 nanocatalyst was tested for the FTS reaction in a fixed bed reactor (Fig. 3). The reactions were carried out at 10 and 20 bar, 230–260 °C, with an H2/CO ratio of ‘2’. In the reactions, CO conversion and hydrocarbon selectivity data were obtained for 48 h over time-on-stream (TOS) by analysing the gas chromatography data of the outlet gasses containing the unreacted CO, H2, CH4, C2–C4 hydrocarbons and CO2. Because the active Co phase had been already generated during the catalyst preparation step before the FTS reaction, the Co/Al2O3 nanocatalyst could be directly employed in FTS without an additional in situ reduction/activation process. Under the same temperature conditions, higher CO conversions were measured at 20 bar than 10 bar (Fig. 4). This is, because higher reaction pressure can provide more beneficial conditions in FTS, as follows:| nCO + (2n + 1)H2 → CnH2n+2 + nH2O (paraffins) |
| nCO + 2nH2 → CnH2n + nH2O (olefins) |
Furthermore, the Co/Al2O3 nanocatalyst exhibited enhanced CO conversion with increased reaction temperature (230 to 260 °C) under the same reaction pressure condition. At 20 bar, the total CO conversion rates were observed to be 36.4% at 230 °C, 55.8% at 240 °C, 69.2% at 250 °C, and 76.0% at 260 °C, at TOS = 48 h. The highest CO conversion was obtained at 20 bar and 260 °C.
In the selectivity data, increase of the reaction pressure tends to increase C5+ selectivity and decrease CH4 selectivity. This trend leads to the high yield of C5+ hydrocarbons (Fig. 5). Under 20 bar, the FTS reaction at 260 °C showed higher CO2 (4.3%), CH4 (24.0%), and C2–C4 (12.4%) selectivity and lower C5+ selectivity (59.3%) than at lower temperatures. The reaction at 230 °C showed low CO2 (0.2%), CH4 (13.5%) and C2–C4 (9.2%) selectivity, and high selectivity for C5+ (77.1%). Higher CO2 concentrations in elevated reaction temperatures were mainly attributed to the increased water–gas shift (WGS) reaction as follows:
| CO + H2O ↔ CO2 + H2 |
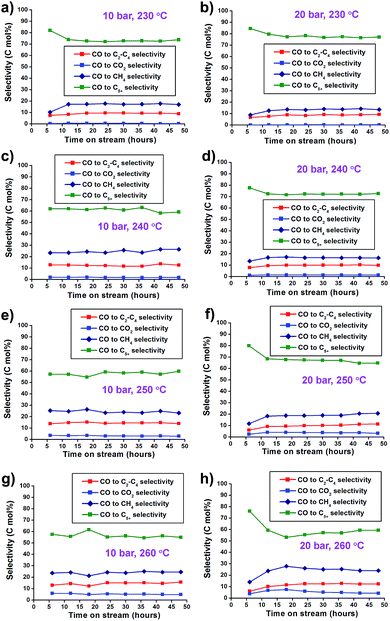 | ||
Fig. 5 (a–h) CO2 and hydrocarbon selectivity graphs of Co/Al2O3 nanocatalyst at 10–20 bar and 230–260 °C. The reaction tests were conducted at GHSV = 6.8 NL gcat−1 h−1 and a H2![[thin space (1/6-em)]](https://www.rsc.org/images/entities/char_2009.gif) : :![[thin space (1/6-em)]](https://www.rsc.org/images/entities/char_2009.gif) CO ratio of ‘2’. CO ratio of ‘2’. | ||
The catalyst activity has been also noted in terms of the Cobalt-Time-Yield (CTY), i.e., the number of CO moles converted to hydrocarbons per gram of cobalt per second over TOS. It can simply reflect the CO conversion and hydrocarbon selectivity of catalysts for each FTS reaction condition. The Co/Al2O3 nanocatalyst showed good catalytic performance with high CTY values (Fig. 6). As expected, the catalyst used at the higher reaction temperature of 260 °C showed much higher CTY values than those of 230–250 °C. In particular, the CTY value at 20 bar and 260 °C was calculated to be 1.41 × 10⁻⁴ molCO gCo−1 s−1 at TOS = 48 h, comparable with previously reported values of Co/Al2O3, Co/C, and Co/SiO2 catalysts (Fig. 6b, Table S1†). Increase of the reaction pressure at the same reaction temperatures led to increased CTY values. Controlling temperature was more effective for increasing FTS activity than controlling the reaction pressure, and resulted in high CTY values.
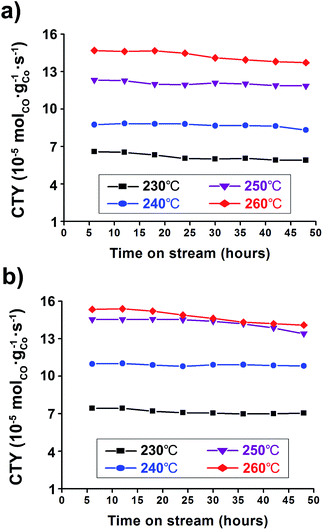 | ||
Fig. 6 Cobalt-Time-Yield (CTY) graphs conducted under 230–260 °C at (a) 10 bar and (b) 20 bar. The reaction tests were conducted at GHSV = 6.8 NL gcat−1 h−1 and a H2![[thin space (1/6-em)]](https://www.rsc.org/images/entities/char_2009.gif) : :![[thin space (1/6-em)]](https://www.rsc.org/images/entities/char_2009.gif) CO ratio of ‘2’. CO ratio of ‘2’. | ||
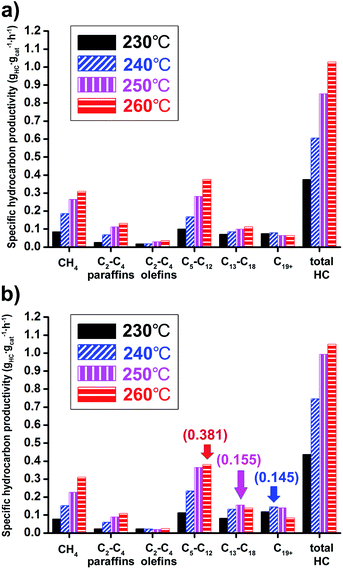
The Co/Al2O3 nanocatalyst also showed very high productivity for hydrocarbon products. The specific hydrocarbon productivities were obtained from gas chromatography analysis of gaseous products and simulated distillation analysis of isolated solid and liquid products after FTS reactions (Fig. 7). At 20 bar and 260 °C, the maximum value of the total hydrocarbon (HC) productivity from C1 to C44 was found to be 1.0 gHC gcat−1 h−1. As expected, higher productivity at 20 bar for liquid hydrocarbon (C5+) was measured than at 10 bar. In the case of gasoline-range products (C5–C12), the maximum productivity (0.381 gHC gcat−1 h−1) was observed under 20 bar at 260 °C (Fig. 7b). On the other hand, the maximum values for diesel-range products (C13–C18) and wax-range products (C19+) were observed under 20 bar at 250 and 240 °C, respectively.
At 20 bar, the wax-range portion (C19+) in total weight portions was significantly decreased with increase of reaction temperatures, indicating 27.1% at 230 °C and 8.0% at 260 °C (Table S2†). On the other hand, the gasoline-range portion (C5–C12) was increased (25.8% at 230 °C to 36.3% at 260 °C).
The chain growth probability (α) of the hydrocarbons can be calculated using the Anderson–Schulz–Flory (ASF) chain growth mechanism in the following equation:29
log(Wn/n) = log(ln2![[thin space (1/6-em)]](https://www.rsc.org/images/entities/char_2009.gif) α) + n α) + n![[thin space (1/6-em)]](https://www.rsc.org/images/entities/char_2009.gif) log log![[thin space (1/6-em)]](https://www.rsc.org/images/entities/char_2009.gif) α α |
4. Conclusions
The Co nanoparticles (∼15 nm) supported on alumina were simply prepared with tens of gram scale in a batch, via melt infiltration and subsequent thermal reduction. This route was reproducible, economically feasible, and eco-friendly. The Co/Al2O3 nanocatalyst, with supreme thermal stability and high Co dispersion, showed good CO conversion (∼76%), very high CTY value (∼1.4 × 10⁻⁴ molCO gCo−1 s−1) and remarkable hydrocarbon productivity (∼1.0 gHC gcat−1 h−1) under controlled FTS conditions. It is anticipated that the optimum reaction conditions for this catalyst could be effectively applied to commercial FTS for producing target liquid fuel products such as gasoline- and diesel-range hydrocarbons.Acknowledgements
This research was supported by the Research and Development Program of the Korea Institute of Energy Research (KIER) (B6-2439) and funded by the Ministry of Trade, Industry and Energy (MOTIE) of the Republic of Korea (project no. 10050509).Notes and references
- M. E. Dry, Catal. Today, 2002, 71, 227 CrossRef CAS.
- E. van Steen and M. Claeys, Chem. Eng. Technol., 2008, 31, 655 CrossRef CAS.
- A. de Klerk, Green Chem., 2008, 10, 1249 RSC.
- S. K. Beaumont, Phys. Chem. Chem. Phys., 2014, 16, 5034 RSC.
- Q. Zhang, J. Kang and Y. Wang, ChemCatChem, 2010, 2, 1030 CrossRef CAS.
- Q. Zhang, K. Cheng, J. Kang, W. Deng and Y. Wang, ChemSusChem, 2014, 7, 1251 CrossRef CAS PubMed.
- X. Li, J. He, M. Meng, Y. Yoneyama and N. Tsubaki, J. Catal., 2009, 265, 26–34 CrossRef CAS.
- J.-C. Kim, S. Lee, K. Cho, K. Na, C. Lee and R. Ryoo, ACS Catal., 2014, 4, 3919 CrossRef CAS.
- A. Y. Khodakov, W. Chu and P. Fongarland, Chem. Rev., 2007, 107, 1692 CrossRef CAS PubMed.
- K. Shimura, T. Miyazawa, T. Hanaoka and S. Hirata, Appl. Catal., A, 2014, 475, 1 CrossRef CAS.
- G. Jacobs, T. K. Das, Y. Zhang, J. Li, G. Racoillet and B. H. Davis, Appl. Catal., A, 2002, 233, 263 CrossRef CAS.
- Y. Ohtsuka, T. Arai, S. Takasaki and N. Tsubouchi, Energy Fuels, 2003, 17, 804 CrossRef CAS.
- G.-Z. Bian, N. Fujishita, T. Mochizuki, W.-S. Ning and M. Yamada, Appl. Catal., A, 2003, 252, 251 CrossRef CAS.
- A. Y. Khodakov, Catal. Today, 2009, 144, 251 CrossRef CAS.
- R. Schlögl and S. B. A. Hamid, Angew. Chem., Int. Ed., 2004, 43, 1628 CrossRef PubMed.
- C. Descorme, P. Gallezot, C. Geantet and C. George, ChemCatChem, 2012, 4, 1897 CrossRef CAS.
- V. Polshettiwar and R. S. Varma, Green Chem., 2010, 12, 743 RSC.
- Y. Li, Q. Liu and W. Shen, Dalton Trans., 2011, 40, 5811 RSC.
- J. Sun and X. Bao, Chem.–Eur. J., 2008, 14, 7478 CrossRef CAS PubMed.
- J. K. Nørskov, T. Bligaard, J. Rossmeisl and C. H. Christensen, Nat. Chem., 2009, 1, 37 CrossRef PubMed.
- S. Shylesh, V. Schiinemann and W. R. Thiel, Angew. Chem., Int. Ed., 2010, 49, 3428 CrossRef CAS PubMed.
- S. Chaturvedi, P. N. Dave and N. L. Shah, J. Saudi Chem. Soc., 2012, 16, 307 CrossRef CAS.
- G. A. Somorjai, H. Frei and J. Y. Park, J. Am. Chem. Soc., 2009, 131, 16589 CrossRef CAS PubMed.
- J. Schällibaum, F. H. D. Torre, W. R. Caseri and J. F. Löffler, Nanoscale, 2009, 1, 374 RSC.
- C. Yang, H. Zhao, Y. Hou and D. Ma, J. Am. Chem. Soc., 2012, 134, 15814 CrossRef CAS PubMed.
- H. R. Choi, H. Woo, S. Jang, J. Y. Cheon, C. Kim, J. Park, K. H. Park and S. H. Joo, ChemCatChem, 2012, 4, 1587 CrossRef CAS.
- T. M. Eggenhuisen, J. P. den Breejen, D. Verdoes, P. E. de Jongh and K. P. de Jong, J. Am. Chem. Soc., 2010, 132, 18318 CrossRef CAS PubMed.
- M. Trueba and S. P. Trasatti, Eur. J. Inorg. Chem., 2005, 3393 CrossRef CAS.
- I. Puskas and R. S. Hurlbut, Catal. Today, 2003, 84, 99 CrossRef CAS.
- O. O. James, B. Chowdhury, M. A. Mesubi and S. Maity, RSC Adv., 2012, 2, 7347 RSC.
Footnote |
| † Electronic supplementary information (ESI) available. See DOI: 10.1039/c6ra28177j |
| This journal is © The Royal Society of Chemistry 2017 |

