DOI:
10.1039/C6RA27986D
(Paper)
RSC Adv., 2017,
7, 11626-11635
Enhancement of textile-dyeing sludge dewaterability using a novel cationic polyacrylamide: role of cationic block structures†
Received
9th December 2016
, Accepted 9th February 2017
First published on 15th February 2017
Abstract
In this study, a novel cationic polyacrylamide (CPAM) with a microblock structure was successfully synthesized through ultrasonic-initiated template copolymerization (UTP) using allyltrimethylammonium chloride (TM) and acrylamide (AM) as monomers, and sodium polyacrylate (NaPAA) as a template. Fourier transform infrared spectroscopy (FT-IR), 1H (13C) nuclear magnetic resonance spectroscopy (1H (13C) NMR), and thermogravimetric analysis (TGA) were employed to characterize the properties of the polymers. The results showed that the novel cationic microblock structure was formed in the template copolymer of TM and AM (TPTA). Besides, the copolymerization was demonstrated to follow an I zip-up (ZIP) template polymerization mechanism through the analysis of association constant (MK) and polymerization kinetics. The flocculation results of textile-dyeing sludge dewatering revealed that the polymer with the novel microblock structure showed an excellent flocculation performance. When the optimal conditions at pH of 7.0, dosage of 40 mg L−1 and the intrinsic viscosity of 2.3 dL g−1, the minimum SRF of 4.9 × 10¹² m kg−1 and FCMC of 72.1% were observed. During the flocculation process, the cationic microblocks in TPTA extremely enhanced the ability of charge neutralization and bridging, and contributed much to the excellent flocculation performance in textile-dyeing sludge dewatering.
1. Introduction
With the increase of textile-dyeing wastewater generation and wastewater treatment efficiency, the growth rate of textile-dyeing sludge is going up year by year. According to the China Environment Statistical Yearbook, the amount of textile-dyeing sludge in China was up to approximately 5.38 million tons (80% moisture content) in 2013 in China.1,2 Unfortunately, this already huge production rate was predicted to further increase due to more progressively stringent wastewater effluent regulation criteria as well as the growing population. Textile sludge dewatering and reduction has become a global challenging issue for water industries and governments.3 Therefore, research on textile sludge dewatering becomes more urgent and significant.
Currently, chemical conditioners, especially cationic polyacrylamide (CPAM), have triggered intensive interest because of their superiorities such as high efficiency, friendly-environment, facile operation and economic advantages.4 The textile sludge colloids were destabilized and agglomerated by CPAM to form large flocs through charge neutralization and bridging, which could reduce the sludge moisture content and volume.5 So far a great number of efficient flocculants have been successfully synthesized and a desirable flocculation performance has been achieved in sludge dewatering by using those flocculants.6–8 However, the CPAM synthesized with acrylamide (AM) and cationic monomer was limited to further improve and enhance its flocculation and dewatering performance by a significant drawback of the disordered and random cationic units distribution in the polymer chain. The randomly scattering cationic units could not maximize the charge neutralization ability completely. As a result, the flocculation efficiency would be discounted greatly.9
Template polymerization technology provided a new way for the research of CPAM, which could be employed to synthesize flocculant with microblock structure.10 Similar to the rule of DNA replication, the cationic monomer would be tightly adsorbed and regularly distributed along with the anionic template molecular chain through electrostatic force, and the cationic monomer would be homopolymerized to form cationic microblock structure through the radical initiation reaction. The ability of charge neutralization could be greatly enhanced by the novel cationic microblock structure because flocculants with these novel structures were more efficient in neutralizing counterions, thus promoting flocculation and improving the flocculation efficiency.11 Ultrasonic-initiated copolymerization has become more and more popular because it not only tolerates lower reaction temperature, less initiator and shorter polymerization time, but also has many advantages such as its facile operation, low cost and friendly-environment.12,13 Furthermore, it was reported that ultrasonic-template technique has been employed to synthesize novel nanoparticles.14 Therefore, this technique was proposed to synthesize CPAM with the novel cationic microblock structure, and it was beneficial for overcoming the problems associated with traditional polymerization technology. As the common and nontoxic monomers, allyltrimethylammonium chloride (TM) and AM were chosen to construct a novel microblock structure through ultrasonic-initiated template copolymerization (UTP). In addition, the template polymerization mechanism should be deeply studied and researched to ignite fire in the domain of polymer science and similar.
This study aimed to investigate the possibility of synthesizing the flocculant with the cationic microblock structure through UTP using AM and TM as monomers, and NaPAA as template. The structural characters of polymers synthesized though UTP and non-UTP were analyzed by many advanced instruments such as FT-IR, 1H (13C) NMR and TGA. Besides, the association constant MK and polymerization kinetics were researched and analyzed to further understand the polymerization mechanism. Finally, the effect of the cationic microblocks on the sludge dewatering were investigated, and the sludge dewatering performance was evaluated in terms of filter cake moisture content (FCMC), specific resistance to filtration (SRF) and the flocs settling behaviors.
2. Materials and methods
2.1. Materials
The details of the reagents used in this experiment were as follows: the monomer AM was obtained from Chongqing Lanjie Tap Water Company (Chongqing, China). Allyltrimethylammonium chloride (TM; 98 wt% in water) and urea [CO(NH2)2] were purchased from Ruiqi Life Science Co., Ltd. (Shanghai, China). Template sodium polyacrylate (NaPAA) was obtained from Shandong Xintai Water Treatment (Zaozhuang, China), and its molecular weight (MW) was 4200. Initiator 2,2′-azobis[2-(2-imidazolin-2-yl)propane] dihydrochloride (VA-044) was sourced from Apotheker Chemical Reagent Co., Ltd. (Chendou, China). AM and TM were of technical grade, whereas the other reagents were of analytical grade. Deionized water was used throughout the experiment. Commercial flocculants CPDA and CPMA were named as CCPDA and CCPMA, respectively. CPDA was the copolymer of AM and acryloyloxyethyl trimethyl ammonium chloride (DAC), and CPMA was synthesized by AM and methacryloxyethyl trimethyl ammonium chloride (DMC). The intrinsic viscosities of CCPDA and CCPMA were all 2.3 dL g−1.
2.2. Preparation of copolymers
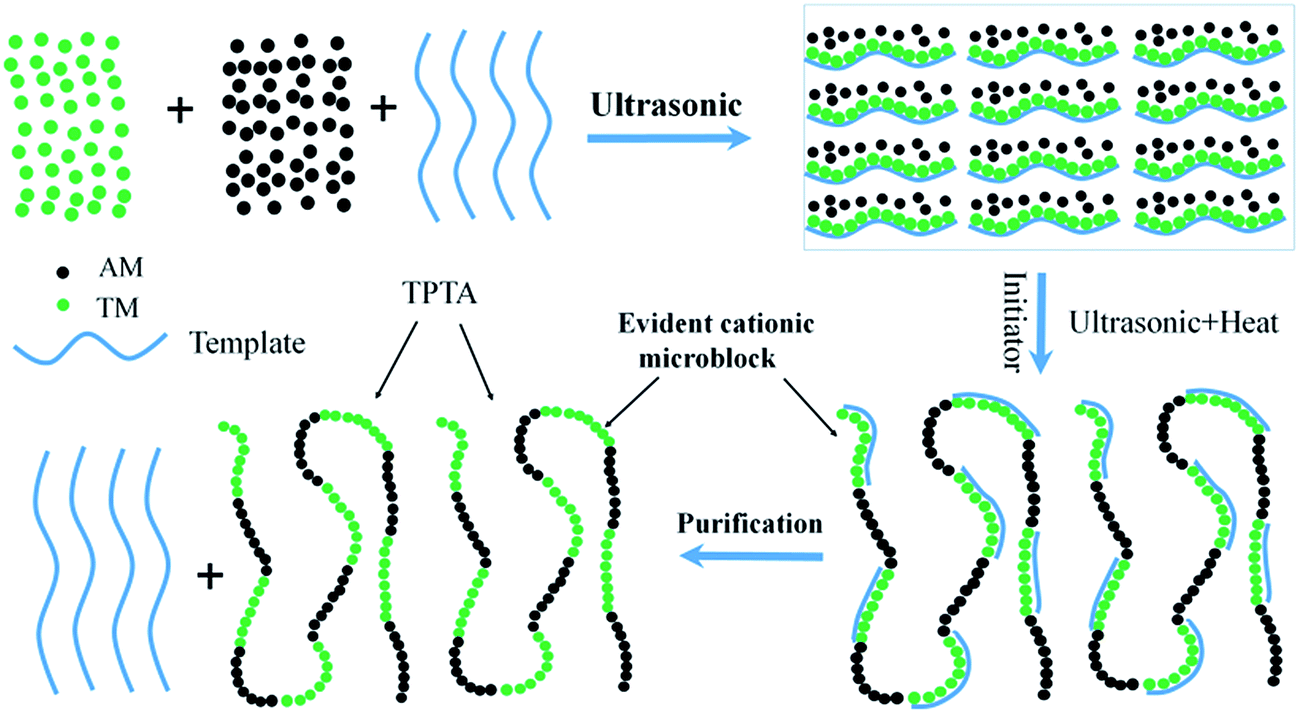
The ultrasonic-initiated template copolymerization process was shown in Fig. 1, and the template copolymer TPTA was prepared as follows. A certain amount of AM (67.61 mmol), TM (23.59 mmol), urea (0.133 mmol), NaPAA (23.59 mmol; nNaPAA![[thin space (1/6-em)]](https://www.rsc.org/images/entities/char_2009.gif) :nTM = 1:1) and deionized water (0.67 mol) was added into 100 mL quartz jar. Then, the pH of the reaction solution was adjusted to about 2.0 by 0.5 mol L−1 HCl and NaOH. The mixture temperature was kept at 20 °C and it was exposed under the ultrasonic wave radiation for 30 min to form a homogeneous solution. The ultrasonic wave was generated by an ultrasonicator (KQ 2200E, Kunshan Ultrasonic Instrument Co., LTD, China) and the frequency of that was 45 kHz. After that, the solution was deoxygenated through nitrogen bubbling for 30 min at ambient temperature. Subsequently, the quartz jar was sealed immediately after addition of a given dose of initiator VA-044 to the mixture, and then continuously sonicated at 35–45 °C for 60–90 min. When the reaction was over, the copolymer was aged for 4 h at room temperature to increase the polymerization degree. Finally, the copolymer was purified by acetone and ethanol for several times and dried in a vacuum oven at 60 °C until a constant weight was obtained. The preparation of CPTA was similar to that of TPTA except that no template and ultrasonic were used. The proposed reaction routes for TPTA and CPTA were outlined in ESI Fig. S1.†
:nTM = 1:1) and deionized water (0.67 mol) was added into 100 mL quartz jar. Then, the pH of the reaction solution was adjusted to about 2.0 by 0.5 mol L−1 HCl and NaOH. The mixture temperature was kept at 20 °C and it was exposed under the ultrasonic wave radiation for 30 min to form a homogeneous solution. The ultrasonic wave was generated by an ultrasonicator (KQ 2200E, Kunshan Ultrasonic Instrument Co., LTD, China) and the frequency of that was 45 kHz. After that, the solution was deoxygenated through nitrogen bubbling for 30 min at ambient temperature. Subsequently, the quartz jar was sealed immediately after addition of a given dose of initiator VA-044 to the mixture, and then continuously sonicated at 35–45 °C for 60–90 min. When the reaction was over, the copolymer was aged for 4 h at room temperature to increase the polymerization degree. Finally, the copolymer was purified by acetone and ethanol for several times and dried in a vacuum oven at 60 °C until a constant weight was obtained. The preparation of CPTA was similar to that of TPTA except that no template and ultrasonic were used. The proposed reaction routes for TPTA and CPTA were outlined in ESI Fig. S1.†
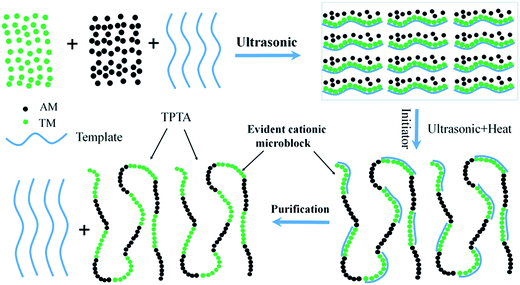 |
| | Fig. 1 The ultrasonic-initiated template copolymerization process for TPTA. | |
2.3. Characteristics of copolymers
The intrinsic viscosities of polymers were recorded on an Ubbelohde viscosity meter (Shanghai Shenyi Glass Instrumental Co. Ltd., China) at 30 °C in a 2 mol L−1 aqueous NaCl solution.15 The molecular weight was calculated by Huggins equation illustrated in ESI Text S1.† The degree of cationic (DC) of the copolymer was measured by colloid titration method.16 The FT-IR and 1H (13C) NMR of the products were recorded on a 550 Series II infrared spectrometer (Mettler Toledo Instruments Co., Ltd., Switzerland) using KBr pellets and an Avance 500 nuclear magnetic resonance spectrometer (Bruker Company, Ettlingen, Germany) with deuterium oxide (D2O) as the solvent, respectively. Furthermore, TGA and differential scanning calorimetry (DSC) of the polymers were carried out at a heating rate of 10 °C min−1 under a nitrogen flow of 20 mL min−1 from 20 to 600 °C on a DTG-60H synchronal thermal analyzer (Shimadzu, Kyoto, Japan).
2.4. Determination of KM and reaction kinetics
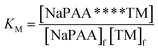
In order to deeply comprehend the template polymerization mechanism and the effect of template on the polymerization reaction system, the association constant (KM) and reaction kinetics were systematically investigated. The KM (between TM and NaPAA) was measured by bag filter method. A predetermined dose of template NaPAA with a molecular weight (Mw) of 4200 was added into dialysis bag (Intercepted, MwCO 3500, MD 25–3.5, USA), and then the dialysis bag was submerged in deionized water for dialysis. During the process of dialysis, the low Mw NaPAA was removed and the remaining NaPAA became more similar and uniform. After 48 h dialysis, the NaPAA in the dialysis bag was precipitated by ethanol and the precipitation was dry in a vacuum oven at 60 °C for 24 h. A certain dose of TM and the precipitation NaPAA were dissolved in deionized water in a 250 mL glass beaker, and then the solution pH was adjusted to 3.0 by 0.5 mol L−1 HCl and NaOH. Subsequently, the glass beaker was sealed immediately and kept for 24 h at room temperature to arrive a penetration balance. Finally, the KM was calculated by the following formula:| |
 | (1) |
where [NaPAA****TM] was the concentration of the association of NaPAA and TM, [NaPAA]f and [TM]f were the free concentration when the dialysis kept balance. Meanwhile, the free concentration of NaPAA and TM was measured by conductometric titration method. Prior to the determination of polymerization rate (Rp), the monomer conversion rate was controlled to less than 10% by shortening the sonication time at 35 °C, and the calculation equation of Rp was described as follows:where [M] was the initial concentration of monomer, and k was the slope of the Yt = ln[1/(1 − Ct)] plot (a fitting straight line), where Ct is the monomer conversion (C) with a given reaction time at 2 min, 4 min, 6 min, 8 min and 10 min, and it was determined by gravimetric method.17
2.5. Dewatering experiment
In this dewatering experiment, it was more reasonable and receivable to use the flocculants with the same intrinsic viscosity and cationic degree for comparison analyses. The flocculants used for the dewatering tests were listed in ESI Table 1.† Raw textile-dyeing sludge used in this experiment was collected from Junzhi textile-dyeing wastewater treatment plant (Chongqing, China) with a cyclic-activated sludge system. The sludge collected from this plant featured by a pH of 7.2, a moisture content of 99.4%, a zeta potential of −21.8 mV, a mass density of 0.946 kg L−1 and a VSS/TSS of 0.77. A program-controlled Jar-test apparatus (ZR4-6, Zhongrun Water Industry Technology Development Co. Ltd., China) was used in the textile-dyeing sludge dewatering experiment at ambient temperature. About 250 mL textile-dyeing sludge was transferred into a 500 mL glass beaker, and the initial pH of the sludge was adjusted to the set value by HCl (0.1 mol L−1) and NaOH (0.1 mol L−1). A certain dosage of flocculant was quickly added to the glass beaker, followed by a rapid stirring at 200 rpm for 30 s and a slow stirring at 50 rpm for 10 min and then it was kept for 30 min.18 The flocculation ability of the polymers was evaluated by FCMC, SRF, settling rate, zeta potential and the flocs settling behaviors. Besides, the detail analytical methods of FCMC and SRF were described in ESI Text S2.† The zeta potential of supernatant was measured by a Zetasizer Nano ZS90 (Malvern Instruments Ltd., Malvern, UK). After a rapid agitation, the flocs size was recorded on a laser diffraction instrument (Mastersizer 2000, Malvern, U.K.). Each measurement was repeated in triplicate and the final results were the average of three runs.
The sludge settling performance was carried out on a 1000 mL graduated cylinder with a total height of 29.5 cm. After a predetermined dose of flocculant was added to the sludge sample, the graduated cylinder was immediately sealed and inverted for 4 times. Then, the sludge precipitated for 60 min without disturbance. The height of the sludge–liquid interface with time was immediately recorded until the height kept constant. The settling rate of the sludge conditioned by flocculant was calculated in term of the height of the sludge–liquid interface as a function of settling time in the first 150 s. When the height of the sludge–liquid interface kept constant, a camera (Millet five, China) was used to observe the flocs morphology of conditioned sludge.
3. Results and discussion
3.1. The association constant (KM) and reaction mechanism
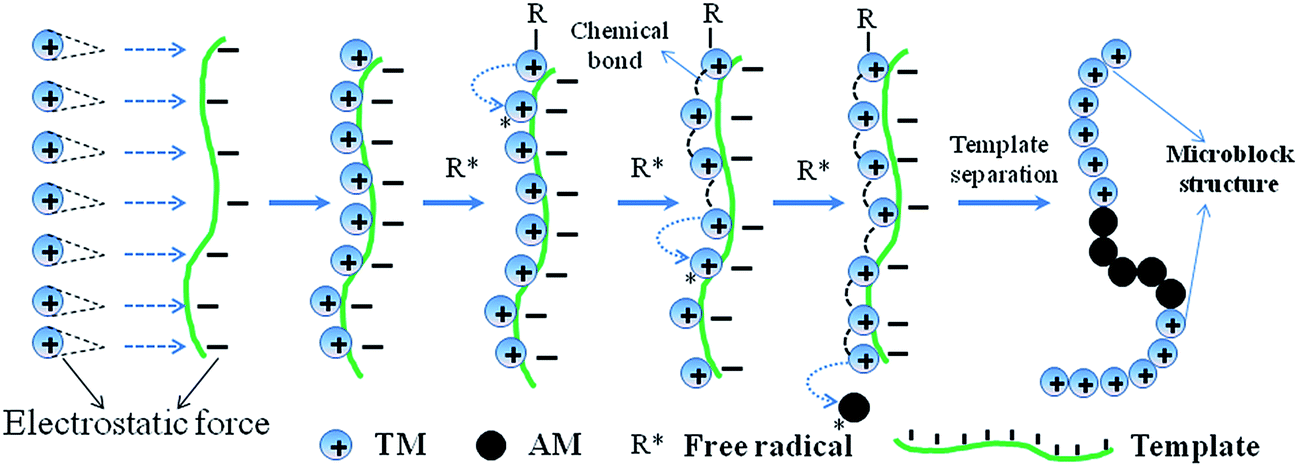
In the template polymerization system, the cationic monomer TM was absorbed and arranged along with the chain of the anionic template NaPAA under the electrostatic force, whereas neutral AM lagged behind TM in the competition of capturing template. Therefore, the interaction force between TM and NaPAA could be measured in term of the association constant (KM) and the corresponding mechanism could be obtained.19 The dialysis result showed a KM value of 12.31 when the molar ratio of TM to NaPAA was 1:1, which meant about three quarters of the monomer TM was absorbed by template to form a novel block structure. Based on the above analysis, the template polymerization belonged to I (ZIP) mechanism shown in Fig. 2. Furthermore, it also indicated that the NaPAA was suitable for the template polymerization.
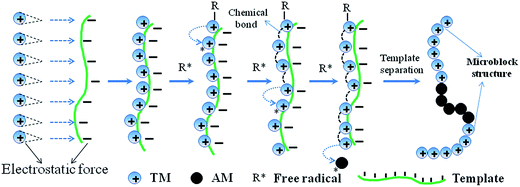 |
| | Fig. 2 The mechanism of ultrasonic-template copolymerization. | |
3.2. Effect of mole ratio of NaPAA to TM on Rp
As one important part in the template polymerization system, NaPAA played a crucial role in the cationic monomer assembling. In the process of template polymerization, the influence of template on the conversion (C) and polymerization rate (Rp) was investigated. In all cases, the TM concentration was kept constant. As shown in Fig. 3, the C and Rp reached the maximum value of approximately 9.44% and 0.103 mol L−1 min−1 at a NaPAA/TM molar ratio of 1, respectively. The changing tendency of C and Rp conformed to the I (ZIP) template polymerization mechanism. When the NaPAA/TM molar ratio was lower than 1, TM was adsorbed completely on the template molecular chain and it tended to be homopolymerized, and thereby the Rp increased. However, it became the inverse at a high molar ratio (NaPAA/TM > 1), and the further increase in the amount of template leaded to a low filling degree of NaPAA by TM and a large molecular gap among TM, thus resulting in a decline of Rp.20 Besides, the I (ZIP) mechanism also indicated that the AM had little impact on the interaction of template NaPAA and TM in the process of template polymerization.
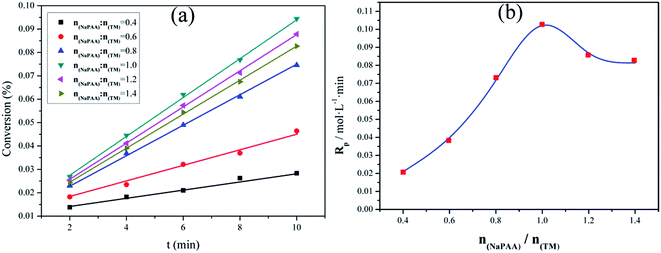 |
| | Fig. 3 Effect of mole ratio of NaPAA and TM on conversion (a) and Rp (b) at nAM:nTM = 3.5:1, pH = 3.0, C = 35 °C and CTM = 5.5 mol L−1. | |
3.3. Characterization of flocculants
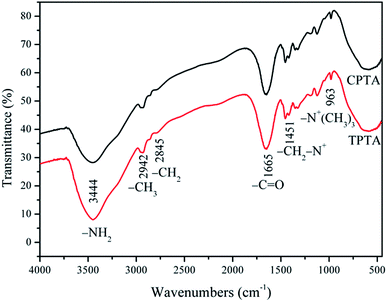
3.3.1. FTIR spectral analysis. Fig. 4 showed the FT-IR spectra of CPTA and TPTA. The FT-IR spectra of CPTA were almost the same with that of TPTA, except for a slight shift in the peak area. The adsorption peaks at 3444 and 1665 cm−1 originated from the strong stretching vibration of –NH2 and C![[double bond, length as m-dash]](https://www.rsc.org/images/entities/char_e001.gif) O in the AM chain, respectively. The asymmetric stretching vibration was observed at 2942 cm−1 for –CH3 and 2845 cm−1 for –CH2.21 The bending vibration at 1451 cm−1 was attributed –CH2– in the –CH2–N+ group of TM. The bending vibration at 963 cm−1 was for –N+–(CH3)3 in TM; the characteristic chemical groups of AM and TM were all observed in CPTA and TPTA, thus indicating that CPTA and TPTA were successfully synthesized through copolymerization of AM and TM. Furthermore, the FT-IR spectra results indicated that UTP did not exert influence on the functional group structure of TPTA.
O in the AM chain, respectively. The asymmetric stretching vibration was observed at 2942 cm−1 for –CH3 and 2845 cm−1 for –CH2.21 The bending vibration at 1451 cm−1 was attributed –CH2– in the –CH2–N+ group of TM. The bending vibration at 963 cm−1 was for –N+–(CH3)3 in TM; the characteristic chemical groups of AM and TM were all observed in CPTA and TPTA, thus indicating that CPTA and TPTA were successfully synthesized through copolymerization of AM and TM. Furthermore, the FT-IR spectra results indicated that UTP did not exert influence on the functional group structure of TPTA.
 |
| | Fig. 4 FT-IR spectra of CPTA and TPTA. | |
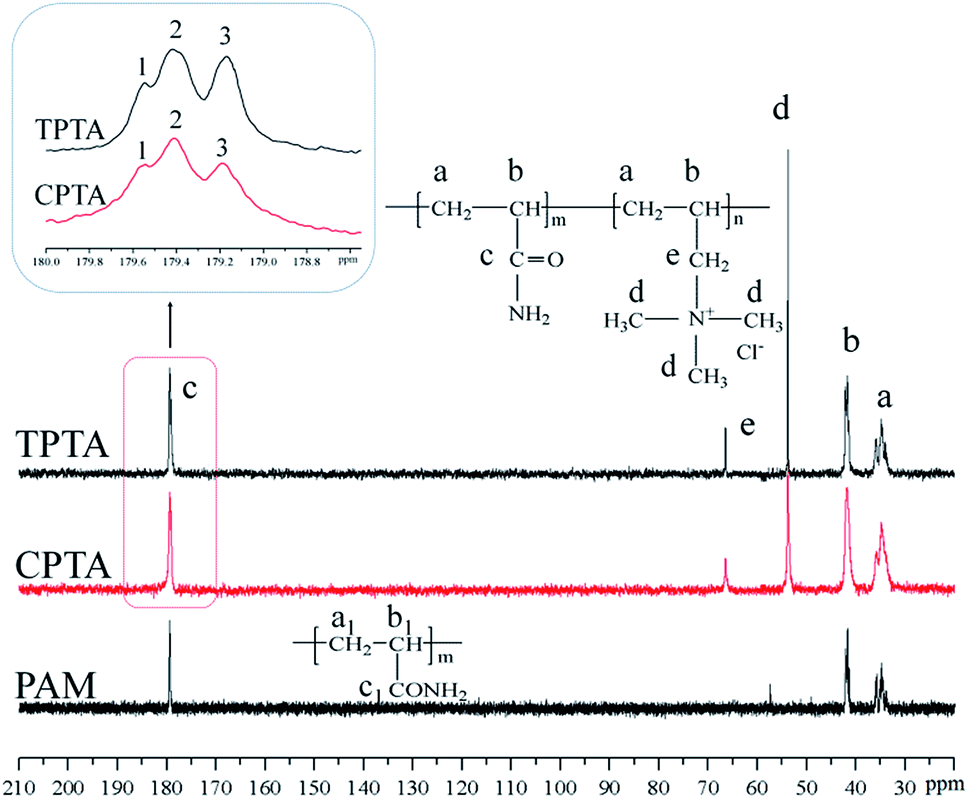
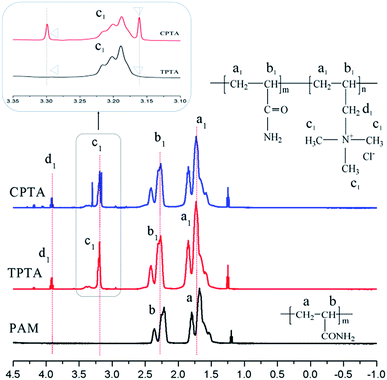
3.3.2. 1H NMR spectral analysis. As an effective method, the 1H NMR was always used to identify the molecular structure in the domain of polymer science. To investigate the impact of template copolymerization on the polymer microstructure, the 1H NMR of CPTA, TPTA and PAM were compared and the results were displayed in Fig. 5. It revealed that CPTA and TPTA displayed many similarities, although several subtle differences should not be ignored. The absorption peaks of protons in the –CH2– (a1) and –CH– (b1) groups of both CPTA and TPTA were observed at δ = 1.71 ppm and δ = 2.28 ppm, respectively, whereas those for PAM shifted. For example, the peaks shifted to δ = 1.62 ppm for –CH2– (a) and δ = 2.19 ppm for –CH– (b) in PAM. The above disparities were caused by the different chemical environment of the protons in the polymers chain. When the copolymer of AM and TM, namely, CPTA or TPTA, was successfully synthesized, the chemical environment of the protons in the –CH2– and –CH– of CPTA or TPTA was not consistent with that of PAM, thus chemical shifts were not identical.22 Meanwhile, the peak of protons at δ = 3.19 ppm was for the three equivalent methyl groups N+(CH3)3 (c1) in TM and that at δ = 3.92 ppm was attributed to the methylene group (d1) which was next to the quaternary ammonium group (–N+–(CH3)3) in TM. Based on the 1H NMR analysis results, it indicated that CPTA and TPTA were the copolymer of AM and TM.
 |
| | Fig. 5 1H NMR spectrum of the polymers. | |
However, the subtle difference between CPTA and TPTA should be paid more attention and it was vital to this study. Two peaks at δ = 3.30 ppm and δ = 3.16 ppm were observed in the 1H NMR spectral of CPTA shown in the rectangle in Fig. 5, whereas those in TPTA disappeared. This interesting phenomenon should be reasoned as follows. In TPTA, the cationic microblock structure was predominantly syndiotactic because of the steric and electrostatic repulsion of the pendant groups. Thus, the protons of N+(CH3)3 in TM microblock structure were identical in principle and only one proton peak was observed for each group.23 By contrast, the random distribution of cationic monomer in CPTA resulted in a different chemical environment rather than that of TPTA and the protons became different with the adjacent protons and thereby two individual split protons peaks shown in a rectangle in Fig. 5 were observed for N+(CH3)3 group. This finding was similar to the previous research.24 Therefore, it could be concluded that the cationic microblock structure in TPTA was successfully synthesized by ultrasonic-initiated template copolymerization.
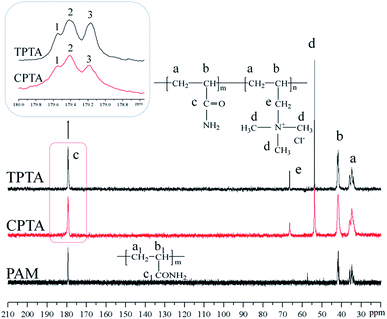
3.3.3. 13C NMR spectral analysis. The 13C NMR of the TPTA, CPTA and PAM were also investigated, and the related peaks showed in Fig. 6. It was more evident that TPTA and CPTA showed similarities in 13C NMR spectral. The resonance peaks at 34.72, 42.08 and 179.48 ppm were ascribed to the carbon of –CH2– (a, a1), –CH– (b, b1) and –CO– (c, c1) in the polymers (TPTA, CPTA and PAM), respectively. Meanwhile, the carbon peaks of TM were all was observed in both TPTA and CPTA. For example, the carbon peak at 53.85 ppm was for –N+(CH3)3 (d) and that at 66.87 ppm was for –CH2–N+– (e). The results of the 13C NMR indicated that both AM and TM reacted and the copolymer TPTA and CPTA were formed.
 |
| | Fig. 6 13C NMR spectrum of the polymers. | |
The microstructure of the polymer was significantly changed due to the formation of the microblock structure. The distribution of AM and TM become more ordered in TPTA rather than random, and which would increase the proportion of the AM and TM chain sequence segment. It has reported that the trials distribution and proportion could be determined by the number and relative intensity of the carbonyl carbon resonance peaks in AM, and therefore the proportion of the AM chain sequence segment in TPTA could be calculated from the area of the relative resonance peaks using the MestReNova software.25 As shown in the rectangle in Fig. 6, the peaks of 1, 2 and 3 represented the AM-centered trials and were TAT, AAT and AAA, respectively. Comparing with CPAT, the peak area of AAA and TAT in TPAT shown in Table 1 increased to 47.1% and 9.2%, respectively, whereas that of AAT declined to 43.7%. The addition of the template generated a microblock structure (AM blocks and TM blocks) in TPAT, thereby increasing the proportion of AM chain sequence segment. Meanwhile, the proportion of TAT in TPTA was larger than that in CPTA. An explanation could be that template method could increase the monomer reaction rate and the conversion, and which was consistent with the analysis of Rp.22
Table 1 Relative intensity of the trials distribution of distribution acrylamide (AM)a
| Copolymer |
AAA (%) |
AAT (%) |
TAT (%) |
| A, AM unit; T, TM unit; 1, TAT; 2, AAT; and 3, AAA. |
| CPAT |
34.4 |
59.9 |
5.7 |
| TPAT |
47.1 |
43.7 |
9.2 |
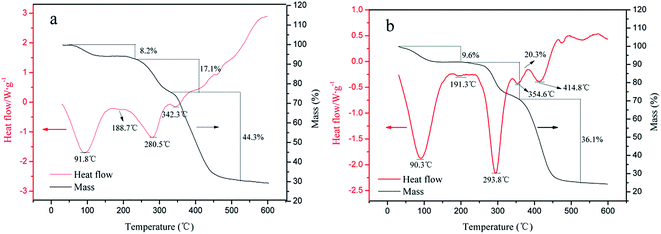
3.3.4. Thermogravimetric analysis. The TGA curves of CPTA and TPTA were displayed in Fig. 7(a and b). It was obvious that three stages of the thermal decomposition were for both CPTA and TPTA, corresponding to their weight loss. The first stage occurred in the range of 30–205 °C with a mass loss of 8.2 wt% for CPTA and 9.6 wt% for TPTA, which could be assigned to the evaporation of intramolecular and intermolecular moisture in the polymers.26 The second stage occurred in the range of 205–345 °C with a mass loss of 17.1 wt% for CPTA and 20.3 wt% for TPTA, which was attributed to the imine reaction of the amide group and the thermal decomposition of methyl in the quaternary ammonium groups. And the final stage occurred beyond 345 °C with a mass loss of 44.3 wt% for CPTA and 36.1 wt% for TPTA, which was due to the carbonization of the copolymer. Meanwhile, two evident heat adsorption peaks were observed at 354.6 and 414.8 °C in the DSC curve of TPTA, whereas only a single peak appeared at 342.3 °C in that of CPTA. The thermal gravimetric curves of the polymers were related to their structure. The evident microblock structure, namely, the TM and AM block was generated by template copolymerization, and therefore two characteristic peaks of heat adsorption were observed for TPTA in the second stage. However, the monomer in CPTA distributed randomly rather than orderly and no blocky structure formed, and therefore just a single adsorption peak was appeared. The previous researches have reported the similar findings.9,27 Moreover, the TGA results also indicated that both TPTA and CPTA had inferior thermal stabilities.
 |
| | Fig. 7 Thermogravimetric curves of (a) CPTA and (b) TPTA. | |
3.4. Dewatering test
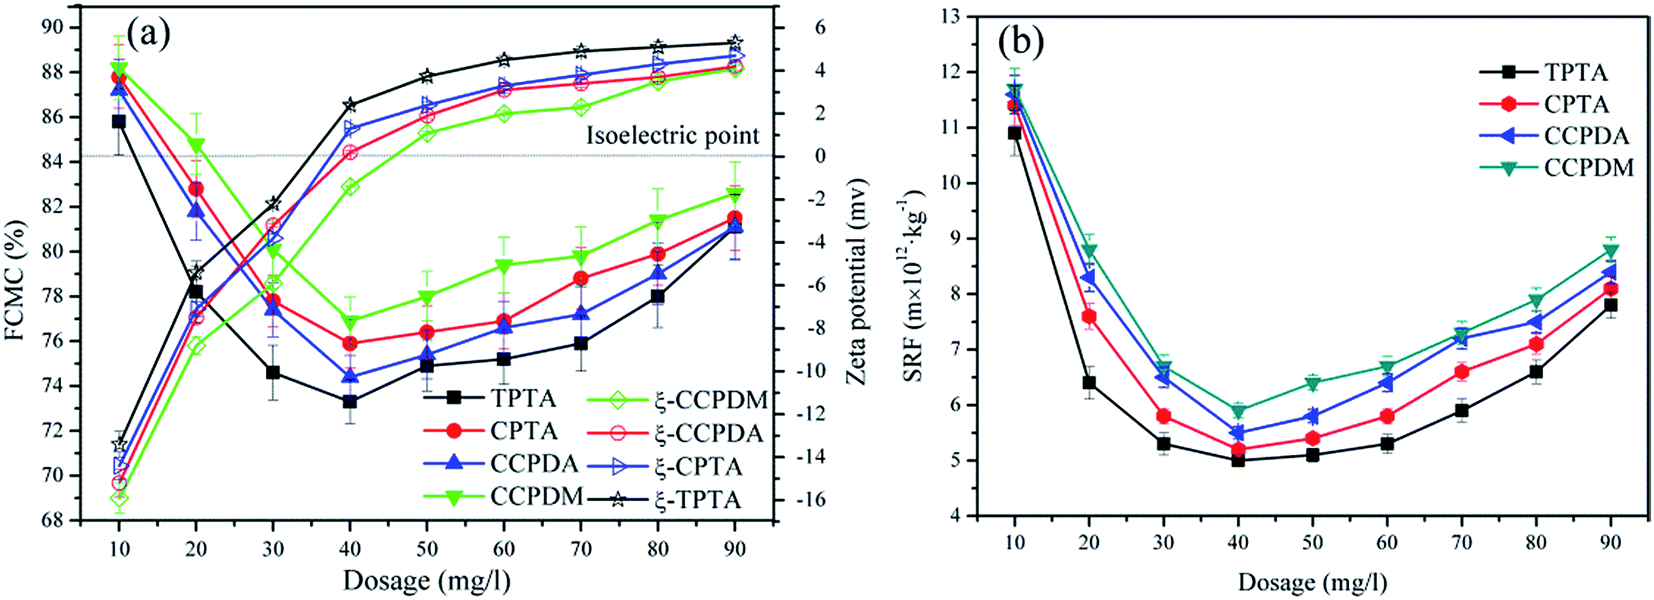
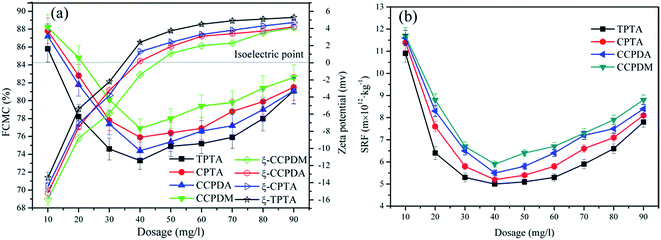
3.4.1. Effect of the dosage on sludge dewatering performance. The effect of flocculants dosage on sludge flocculation performance were investigated in terms of FCMC, SRF and zeta potential. As showed in Fig. 8, the FCMC and SRF decreased with an increase in dose, and then represented a gradually upward trend. It was quite clear that TPTA showed a better flocculation performance than the other there in the full dose range, and their optimum dosages were all at 40 mg L−1. In this condition, the sludge dewatering performance reached the best, and their FCMC and SRF values were both in the following order: TPTA (FCMC: 73.3%; SRF: 5.0 × 10¹² m kg−1) < CPTA (FCMC: 74.2%; SRF: 5.2 × 10¹² m kg−1) < CCPDA (FCMC: 75.8%; SRF: 5.5 × 10¹² m kg−1) < CCPMA (FCMC: 76.9%; SRF: 5.9 × 10¹² m kg−1). However, too large flocculant dosage (>40 mg L−1) leaded to a deterioration in both FCMC and SRF, which was caused by the increased charge repulsion between the sludge colloidal particles and the subsequent stabilization of those particles.
 |
| | Fig. 8 Effect of the dosage on (a) FCMC and zeta potential, and (b) SRF. | |
The zeta potential of the sludge colloid system was investigated to comprehend the flocculation mechanism and explain the dewatering ability discrepancy among the polymers. In Fig. 8, the zeta potential of the supernatant conditioned by TPTA, CPTA, CCPDA and CCPMA displayed a similar trend, that was, it increased with the increasing polymer dosage, but that flocculated by TPTA increased the fastest. Comparing with CPTA, CCPDA and CCPMA, the cationic microblocks in TPTA could greatly enhance the charge neutralization ability, and therefore the zeta potential increased to the isoelectric point at a lower dosage for TPTA (34.9 mg L−1) than those of CPTA (37.3 mg L−1), CCPDA (39.7 mg L−1) and CCPMA (45.8 mg L−1). Charge neutralization played a vital role in the sludge flocculation because the negative charged colloidal could be neutralized and destabilized by cationic flocculant to form large flocs.28 The cationic microblocks of TPTA not only had a strong charge neutralization ability but also strengthened the stretch of molecular chain by its strong charge repulsion which was favorable for bridging, thus increasing the flocculation efficiency. As a result, TPTA showed the best flocculation performance among them in terms of FCMC and SRF. Besides, the optimum dosage was not consistent with that at the isoelectric point, which indicated that adsorption and bridging effects also made a contribution to the sludge dewatering.
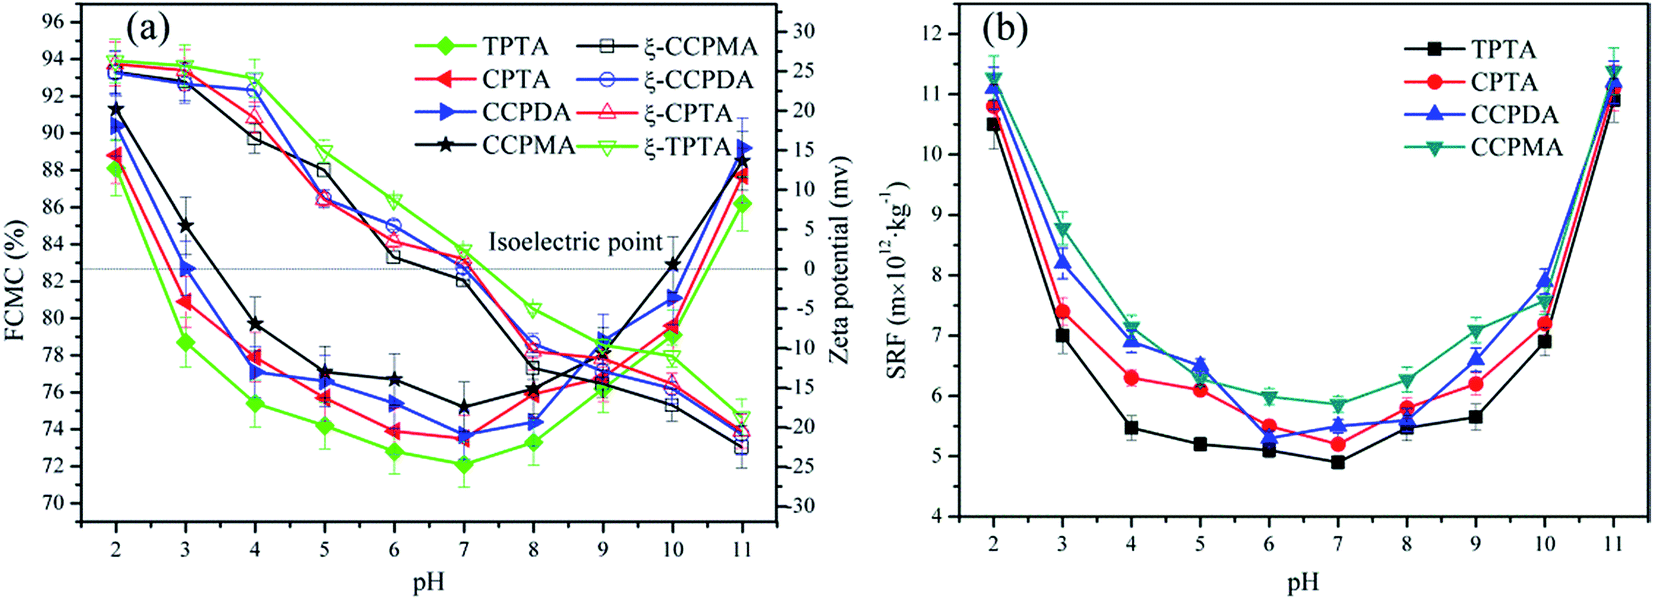
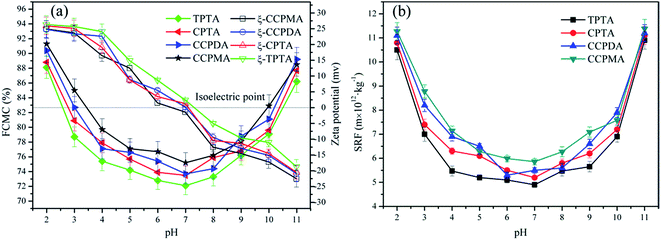
3.4.2. Effect of pH on sludge dewatering performance. Fig. 9 displayed the impact of the pH on the FCMC, zeta potential and SRF at the dosage of 40 mg L−1 and the intrinsic viscosity of 2.3 dL g−1. When the pH increased from 2.0 to 11.0, FCMC and SRF showed a similar trend of decreasing initially and then increasing, whereas zeta potential revealed a declining trend. The sludge dewatering performances of polymers were greatly affected by pH, which indicated that pH played an important role in the sludge flocculation process. The strong acid (pH: 2.0–4.0) and alkali (pH: 9.0–11.0) conditions enhanced the charge intensity on colloidal particles surface and resulted in a strong repulsive force between the particles.29 Consequently, the adsorbed particles were separated from the polymers chain and the sludge dewatering performance became less than satisfactory. Comparing with CPTA, CCPDA and CCPMA, TPTA showed the highest dewatering efficiency among them in the full pH range, and its minimum SRF of 4.9 × 10¹² m kg−1 and FCMC of 72.1% were acquired at pH 7.0. Meanwhile, the zeta potential of the conditioned sludge system was the maximum for TPTA, compared with the other three, and which indicated that the cationic microblock structure could strengthen the charge neutralization ability. In addition, the cationic microblock structure was also favorable for compressing the thickness of the electric double layer. The strong positive charge repulsive force of the cationic microblock would effectively compress the diffusion layer of negative charged particles and reduce its thickness, and therefore the charge repulsion of the negative charged particles decreased. Furthermore, TPTA was demonstrated to have an excellent sludge dewatering performance in a broad scope of pH, which indicated that this novel flocculant could be widely applied in sludge dewatering in different industries such as paper mill, printing and dyeing mill and wastewater treatment plant.
 |
| | Fig. 9 Effect of the pH on the (a) FCMC and zeta potential, and (b) SRF. | |
3.5. Effect of flocculants on sludge settling behaviors and the mechanism
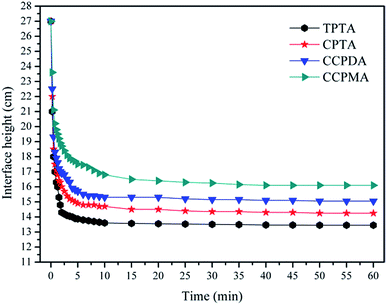
The sludge settling behaviors has been widely used to evaluate the flocculation performance and sludge dewatering ability of the flocculants. Generally speaking, the fast settle rate and large size of flocs meant a good dewatering ability.30 In this study, the settling behaviors of the flocs conditioned with flocculants at dosage of 40 mg L−1 and the intrinsic viscosity of 2.3 dL g−1 were investigated in terms of flocs settling rate and size distribution, and the results were shown in Fig. 10 and 11.
 |
| | Fig. 10 Flocs interface heights of the polymers. | |
 |
| | Fig. 11 Sludge flocs size distribution for (a) TPTA, (b) CPTA, (c) CCPDA and (d) CCPMA. | |
In Fig. 10, the ultimate sediment height and the corresponding settling rate for TPTA were the best among the flocculants, and the order was as follows: TPTA (13.4 cm; 5.44 cm min−1) > CPTA (14.2 cm; 5.12 cm min−1) > CCPDA (15.3 cm; 4.68 cm min−1) > CCPMA (16.5 cm; 4.20 cm min−1). The TPTA cationic microblocks in the TPTA worked well in neutralizing the negative charged sludge particles. As long as the negative charged sludge particles became neutral, it was more likely to make the particles incorporate, and then bridging occurred and more sites of the polymer would adsorb the neutral particles. Consequently, the particles were anchored in the polymer chain and formed large and compact flocs under the effect of polymer chain strongly twisting and closely overlaying. However, the condition for CPTA was reverse. The charge neutralization ability would be discounted by the random distribution of cationic monomer in CPTA molecular chain and thus the sludge could not be flocculated completely. As a result, the flocs became small and sank slow.
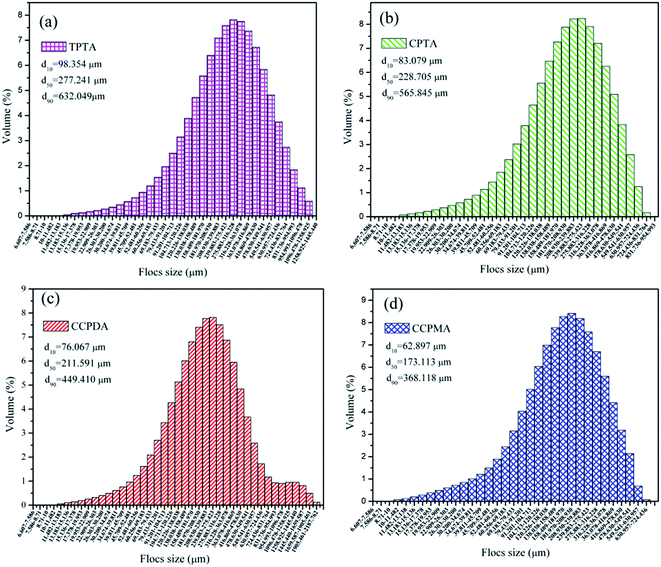
Comparison in flocs size distribution of the polymers was recorded. As shown in Fig. 11, the flocs size of TPTA was larger than the others, and this difference was more evident. For example, the flocs size characterized with the median equivalent volumetric diameter (d50) was 277.241 μm, 228.705 μm, 211.591 μm and 173.113 μm for TPTA, CPTA, CCPDA and CCPMA, respectively. The large flocs size was attributed to the effect of the cationic microblocks in TPTA. The flocculation was mainly dominated by charge neutralization, then bridging, and which was the reason why the flocs size of TPTA was much larger than that of CPTA. Meanwhile, the sludge morphology conditioned by the TPTA and CPTA were record and the results were shown in ESI Fig. S2.† It was more clear that the flocs for TPTA displayed a compact, dense and beehive structure. However, that for CPTA was small and lose, and the shape of the flocs was a sand structure. Therefore, the cationic microblocks in polymer were so beneficial in improving and strengthening the sludge dewatering behaviors. According to the analyses of flocs size, flocs settle rate, flocs morphology and the zeta potential discussed in 3.4 and 3.5, the possible flocculation mechanism of the template polymer TPTA could be summarized as follows: (1) the cationic microblocks in TPTA greatly enhanced the charge neutralization and thereby the negative charge particles were neutralized completely; (2) the cationic microblocks of TPTA could generated strong charge repulsion between the molecular chain, and which was favorable for the polymer chain expansion. Therefore, the cationic microblocks could enhance bridging ability;31 and (3) under the combination of charge neutralization and bridging, the large, compact and beehive-shaped flocs formed and had a fast settling rate.32,33 The possible flocculation mechanism of the TPTA was showed in Fig. 12.
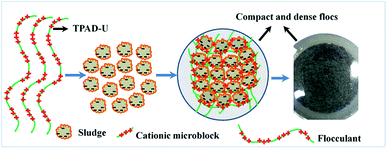 |
| | Fig. 12 Possible flocculation mechanism of the TPTA. | |
4. Conclusions
The novel cationic microblock structure was demonstrated to be formed through the structure property analysis of TPTA. The template polymerization mechanism was investigated through the association constant (KM) and reaction kinetics. Finally, the corresponding sludge dewatering performance of TPTA was evaluated and the possible flocculation mechanism was also discussed. The main conclusions were as follows:
(1) The template polymerization mechanism was demonstrated to be the I (ZIP) mechanism through a high KM value (KM: 12.31). In addition, when the mole ratio of NaPAA to TM was 1:1, the polymerization rate (Rp) reached the top value of 0.102 mol L−1 min−1, which proved the template polymerization followed the I (ZIP) mechanism again.
(2) The results of FT-IR, 1H (13C) NMR and TGA indicated that the TPTA with cationic microblock structure was successfully synthesized using ultrasonic-initiated template copolymerization. In addition, the TGA results also indicated that both TPTA and CPTA had inferior thermal stabilities.
(3) Comparing with CPTA, CCPDA and CCPMA, TPTA showed an excellent dewatering performance and a wide pH range for application. When the optimal condition was at pH of 7.0, dosage of 40 mg L−1 and the intrinsic viscosity of 2.3 dL g−1, the minimum SRF of 4.9 × 10¹² m kg−1 and FCMC of 72.1% were acquired. Besides, the flocs conditioned with TPTA showed excellent settling behaviors, such as a rapid settling rate, a large size, and a dense structure.
(4) The cationic microblocks in the polymer played a vital role in improving and enhancing the flocculation. This novel cationic microblock structure could greatly enhanced charge neutralization ability and bridging. In this case, the negative charge particles were neutralized completely and aggregated to form large flocs, and thus an excellent flocculation performance was observed.
Abbreviations
| UTP | Ultrasonic-initiated template copolymerization |
| AM | Acrylamide |
| DAC | Acryloyloxyethyl trimethyl ammonium chloride |
| DMC | Methacryloxyethyl trimethyl ammonium chloride |
| NaPAA | Sodium polyacrylate |
| MW | Molecular weight |
| TPTA | Template copolymer of TM and AM |
| VA-044 | 2,2′-Azobis[2-(2-imidazolin-2-yl)propane]dihydrochloride |
| CPAM | Cationic polyacrylamide |
| KM | Association constant |
| Rp | Polymerization rate |
| CCPDA | Commercial copolymerization of AM and DAC |
| CCPMA | Commercial copolymerization of AM and DMC |
| FTIR | Fourier transform-infrared spectroscopy |
| 1H (13C) NMR | 1H (13C) nuclear magnetic resonance spectroscopy |
| DSC/TGA | Differential scanning calorimetry and thermogravimetric analysis |
| FCMC | Filter cake moisture content |
| SRF | The specific resistance to filtration |
Acknowledgements
The authors are grateful for the financial support provided by the National Natural Science Foundation of China (Project No. 21677020 and 21477010).
References
- J. Y. Liang, X. A. Ning, T. C. An, J. Sun, Y. P. Zhang and Y. J. Wang, J. Hazard. Mater., 2016, 314, 1–10 CrossRef CAS PubMed.
- V. Jegatheesan, B. K. Pramanik, J. Chen, D. Navaratna, C. Chang and L. Shu, Bioresour. Technol., 2016, 204, 202–212 CrossRef CAS PubMed.
- Y. J. Sun, H. L. Zheng, J. Zhai, H. K. Teng, C. Zhao, C. L. Zhao and Y. Liao, PLoS One, 2014, 9, 10 CrossRef.
- G. R. Chang, J. C. Liu and D. J. Lee, Water Res., 2001, 35, 786–794 CrossRef CAS PubMed.
- H. L. Zheng, Y. J. Sun, C. J. Zhu, J. S. Guo, C. Zhao, Y. Liao and Q. Q. Guan, Chem. Eng. J., 2013, 234, 318–326 CrossRef CAS.
- Z. L. Yang, B. Y. Gao, C. X. Li, Q. Y. Yue and B. Liu, Chem. Eng. J., 2010, 161, 27–33 CrossRef CAS.
- K. E. Lee, N. Morad, B. T. Poh and T. T. Teng, Desalination, 2011, 270, 206–213 CrossRef CAS.
- L. H. Lu, Z. D. Pan, N. Hao and W. Q. Peng, Water Res., 2014, 57, 304–312 CrossRef CAS PubMed.
- Q. Q. Guan, H. L. Zheng, J. Zhai, C. Zhao, X. K. Zheng, X. M. Tang, W. Chen and Y. J. Sun, Ind. Eng. Chem. Res., 2014, 53, 5624–5635 CrossRef CAS.
- Y. X. Zhang, F. P. Wu, M. Z. Li and E. J. Wang, J. Phys. Chem. B, 2005, 109, 22250–22255 CrossRef CAS PubMed.
- S. Połowiński, Prog. Polym. Sci., 2002, 27, 537–577 CrossRef.
- X. F. Cui, J. W. Talley, G. J. Liu and S. L. Larson, Water Res., 2011, 45, 3300–3308 CrossRef CAS PubMed.
- L. G. Qiu, Z. Q. Li, Y. Wu, W. Wang, T. Xu and X. Jiang, Chem. Commun., 2008, 3642–3644 RSC.
- D. Gopi, J. Indira, L. Kavitha, M. Sekar and U. K. Mudali, Spectrochim. Acta, Part A, 2012, 93, 131–134 CrossRef CAS PubMed.
- H. L. Zheng, J. Y. Ma, C. J. Zhu, Z. Zhang, L. W. Liu, Y. J. Sun and X. M. Tang, Sep. Purif. Technol., 2014, 123, 35–44 CrossRef CAS.
- H. J. Ren, W. N. Chen, Y. F. Zheng and Z. K. Luan, React. Funct. Polym., 2007, 67, 601–608 CrossRef CAS.
- H. Z. Shang, J. P. Liu, Y. B. Zheng and L. G. Wang, J. Appl. Polym. Sci., 2009, 111, 1594–1599 CrossRef CAS.
- Z. Chen, W. J. Zhang, D. S. Wang, T. Ma and R. Y. Bai, Water Res., 2015, 83, 367–376 CrossRef CAS PubMed.
- X. Li, H. L. Zheng, B. Y. Gao, Y. J. Sun and B. Z. Liu, Chemosphere, 2017, 167, 71–81 CrossRef CAS PubMed.
- H. T. van de Grampel, Y. Y. Tan and G. Challa, Macromolecules, 1991, 24, 3767–3772 CrossRef CAS.
- Y. Liao, H. L. Zheng, L. Qian, Y. J. Sun, L. Dai and W. W. Xue, Ind. Eng. Chem. Res., 2014, 53, 11193–11203 CrossRef CAS.
- Z. A. Zhang, H. L. Zheng, F. Huang, X. Li, S. Y. He and C. Zhao, Ind. Eng. Chem. Res., 2016, 55, 9819–9828 CrossRef CAS.
- Z. Abdollahi, M. Frounchi and S. Dadbin, Ind. Eng. Chem. Res., 2011, 17, 580–586 CrossRef CAS.
- W. Chen, H. L. Zheng, Q. Q. Guan, H. K. Teng, C. L. Zhao and C. Zhao, Ind. Eng. Chem. Res., 2016, 55, 2892–2902 CrossRef CAS.
- S. Zhang, G. S. Huang and J. R. Wu, J. Macromol. Sci., Part B: Phys., 2011, 50, 2203–2213 CrossRef CAS.
- C. Y. Ou, C. H. Zhang, S. D. Li, L. Yang, J. J. Dong, X. L. Mo and M. T. Zeng, Carbohydr. Polym., 2010, 82, 1284–1289 CrossRef CAS.
- J. A. Mapkar, G. Iyer and M. R. Coleman, Appl. Surf. Sci., 2009, 255, 4806–4813 CrossRef CAS.
- J. Zhou, F. W. Liu and C. Y. Pan, PLoS One, 2014, 9, 5 Search PubMed.
- J. C. Wei, B. Y. Gao, Q. Y. Yue, Y. Wang, W. W. Li and X. B. Zhu, Water Res., 2009, 43, 724–732 CrossRef CAS PubMed.
- Y. Q. Zhao, Sep. Purif. Technol., 2004, 35, 71–80 CrossRef CAS.
- L. H. Lu, Z. D. Pan, N. Hao and W. Q. Peng, Water Res., 2014, 57, 304–312 CrossRef CAS PubMed.
- B. Bolto and J. Gregory, Water Res., 2007, 41, 2301–2324 CrossRef CAS PubMed.
- Y. J. Sun, H. L. Zheng, J. Zhai, H. K. Teng, C. Zhao, C. L. Zhao and Y. Liao, PLoS One, 2014, 9, 10 CrossRef.
Footnote |
| † Electronic supplementary information (ESI) available. See DOI: 10.1039/c6ra27986d |
|
| This journal is © The Royal Society of Chemistry 2017 |
Click here to see how this site uses Cookies. View our privacy policy here. 
 Open Access Article
 This Open Access Article is licensed under a
  abc,
Huaili Zheng*abc,
Baoyu Gaod,
Chuanliang Zhaoabc,
Shixin Zhangabc and
Nan Chenabc
abc,
Huaili Zheng*abc,
Baoyu Gaod,
Chuanliang Zhaoabc,
Shixin Zhangabc and
Nan Chenabc