DOI:
10.1039/C6RA27937F
(Paper)
RSC Adv., 2017,
7, 9847-9853
Synthesis, mechanism and efficient modulation of a fluorescence dye by photochromic pyrazolone with energy transfer in the crystalline state†
Received
8th December 2016
, Accepted 11th January 2017
First published on 2nd February 2017
Abstract
A dual-responsive photochromic compound, 1,3-diphenyl-4-(3-chloro-4-pyridylformyl)-5-hydroxypyrazole 4-phenylsemicarbazone (1) based on a pyrazolone derivative with excellent reversible photochromic reactions in the crystalline state, was successfully synthesized. The new photochromic mechanism of 1 is attributed to isomerization between the enol form and keto form with proton transfer, which was confirmed by IR, XPS, crystal structure data and theoretical calculation. In order to achieve high-contrast fluorescence switch capability, two-component composite materials (TCCM) were prepared by co-aggregating. The emission intensity of fluorophore 9,10-diphenylanthracene (DPA) can be efficiently switched by the fluorescence resonance energy transfer (FRET) between the donor DPA and acceptor coloured 1 in TCCM. The fluorescence modulation ratio is found to be 79%, which is influenced by changing the content of DPA. This novel photoswitchable TCCM may have potential application as photoswitches.
Introduction
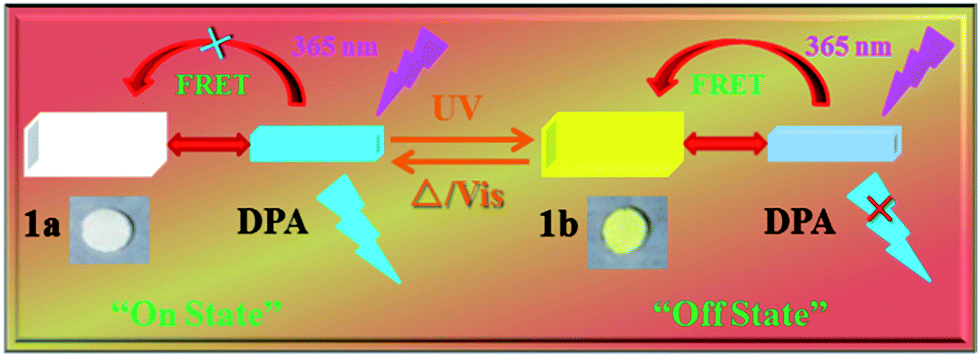
Due to the high contrast and selectivity of fluorescence emission, bistable photoswitchable organic molecules such as diarylethene, spiropyran, azobenzene and fulgide derivatives are accentuating potential applications in fluorescence imaging, sensors, optical data storage and molecular switches.1–6 The fluorescence contrast of bistable switches is one of the most significant performance parameters. Therefore, enlargement of fluorescence contrast is crucial to improve resolution and diminish the side effects destructing the digitalised signals. However, some excellent single molecular photochromic compounds demonstrate weak fluorescence or low emission contrast and quantum yields under the “common situation”. To this end, many organisations are emphatically engaged in amplifying fluorescence contrast depending on energy or electron transfer from the fluorophore to photochromic compound in composites.7–11 Further, fluorescence contrast can be improved to inhibit destructive reading, which is one of the primary candidates for multi-addressing sensors,12 ultra-high resolution devices13–15 and non-destructive readout.16–18 In particular, physical doping or coupling strategies are usually implemented to manufacture composite materials. However, development and application of coupling methods are still restricted by intricate design and synthetic.19 Therefore, organic dyes which are doped into the photochromic system may be a good option to attain highly efficacious fluorescence switch. Intermolecular energy or electron transfer between dyes and photochromic moiety can reversibly manipulate the luminescence intensity of the fluorophore.20–23
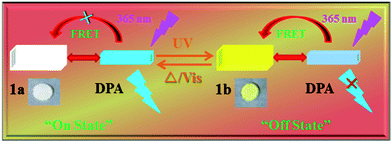
Most of the composites mentioned above are modulated in solution. However, modulation of the fluorophore luminescence in solid state is vital for practical application, which can be sensitively recognized due to its ultrahigh density and selectivity. The pyrazolone derivatives are one of the most promising candidates for application because of their photochromic conduct in the solid state. However, most of pyrazolones synthesized previously showcase irrevocable or partly reversible photochromic reactions by alternating stimulation of UV light and heating or visible light.24–28 In this work, a novel photochromic compound 1 with a substituted pyridine ring on the 4-position of pyrazolone ring was designed and fabricated. Photochromic compound 1 displays dual-responded reversible photochromic reactions excluding the poor fluorescent contrast in crystalline state. As we know, this is the first report on the dual-responded photochromic compound of pyrazolones. Fluorophore DPA demonstrates high fluorescent emission in crystalline state. More importantly, its emission spectra superimposed well with the absorption spectra of coloured 1. Photochromic pyrazolone 1 might be used to modulate the fluorescence of DPA. So, TCCM were fabricated by co-aggregating the fluorophore DPA and photochromic compound 1. The fluorescence of DPA might be efficiently controlled ON/OFF by the photochromic reactions of 1 in TCCM based on FRET (Scheme 1). To the best of our knowledge, FRET is a manifestation of intermolecular energy transfer from the excitation energy of DPA to coloured 1, which is a non-radiative energy transfer process utilising physical long-range dipole–dipole coupling.29,30
 |
| | Scheme 1 Schematic diagram of fluorescence modulation for TCCM. | |
Experimental section
Materials
4-Phenylsemicarbazide (PSC), 9,10-diphenylanthracene (DPA), 2-chloropyridne-4-carbonyl chloride were purchased from Aladdin Industrial Corporation. All other materials and solvents were purchased from commercial sources and special solvents were purified with standard procedures.
General
Melting point was recorded with a BUCHI M-560 melting point apparatus. 1H NMR and 13C NMR spectra were performed on an INOVA-400 NMR spectrometer with DMSO-d6 as solvent. FT-IR spectra were measured by infrared diffuse reflectance spectroscopy in the range 400–4000 cm−1 on a BRUKER EQUINOX-55 spectrometer. The diffraction data were collected at 25 °C on a Bruker Smart APEX11 single crystal diffractometer equipped with a 4k CCD-detector (graphite Mo Kα radiation, λ = 0.71073 Å). Absorption spectra were measured on Hitachi UV-3010 spectrometer. Fluorescence spectra were studied using a Hitachi F-4500 fluorescence spectrophotometer. Fluorescence decays were recorded on HORIBA FL-3 with 10% attenuation slices. X-Ray photoelectron spectra (XPS) were carried out using a Perkin-Elmer PHI 5300 System. Morphology and microstructure of samples were investigated by FESEM (Hitachi S-4800). X-ray powered diffraction (XRD) patterns were obtained by using a Bruker D8 advanced instrument equipped with Cu-Kα radiation (λ = 0.15406 nm). ZF-8 black-box ultraviolet lamp (6 W) was used as light source with reflective filter size is 200 × 80 mm. A TECH XT-5 melting point apparatus and LED lamp (25 W) were used as sources for thermal bleaching and visible light-induced photobleaching, respectively.
Preparation of compounds
The synthesis processes of the compounds are showed in Scheme 2. 1,3-Diphenyl-5-pyrazolone (DPP) was synthesized according to the method described in the literature.31,32
 |
| | Scheme 2 Synthesis of compound 1, (a) PhNHNH2, EtOH, 45 °C, 1 h; (b) 2-chloropyridine-4-carbonyl chloride, 1,4-dioxane, Ca(OH)2, 80 °C, 2 h, HCl (3 M), r.t.; (c) PSC, EtOH, EtOAc, 80 °C, 3 h, r.t. | |
1,3-Diphenyl-4-(3-chloro-4-pyridylformyl)-5-hydroxypyrazolone (DP3Cl4PyP) was synthesized with analogous method according to literature.33 DP3Cl4PyP was directly used to the next reaction without further purify. Yield: 94%. Mp 82.2–84.1 °C. 1H NMR (400 MHz, DMSO-d6): δ = 11.354 (s, 1H, Pz-OH), 8.347 (d, J = 4.8 Hz, 1H, pyridine-ring), 7.818 (d, J = 3.6 Hz, 2H, phenyl-ring), 7.548–7.243 (m, 10H, phenyl-ring).
1,3-Diphenyl-4-(3-chloro-4-pyridylformyl)-5-hydroxypyrazolone 4-phenylsemicarbazone (1) was prepared with similarly method.34 The mixture of DP3Cl4PyP (2 mmol) and PSC (2 mmol) were dissolved in ethanol (8 mL) containing a few drops of glacial acetic acid was stirred and refluxed for 3 h at 80 °C. After cooling down to room temperature, white powders were separated from the solution by filtration, then washed three times with ethanol. Yield: 46%. Mp 205.0–206.2 °C. 1H NMR (400 MHz, DMSO-d6): δ = 12.018 (s, 1H, Pz-OH), 10.188 (s, 1H, N5-H), 9.264 (s, 1H, N4-H), 8.339 (d, J = 5.2 Hz, 2H, pyridine-ring), 7.937 (dd, J = 1.2, 8.8 Hz, 2H, phenyl-ring), 7.777 (s, 1H, pyridine-ring), 7.600–7.498 (m, 7H, phenyl-ring), 7.374–7.251 (m, 6H, phenyl-ring), 7.034 (t, J = 7.6 Hz, 1H, phenyl-ring). 13C NMR (120 MHz, DMSO-d6): δ = 152.124, 150.978, 150.348, 148.762, 147.532, 139.002, 138.577, 137.415, 129.097, 128.862, 128.824, 128.596, 126.596, 126.418, 126.000. FT-IR (cm−1): 3364, 3347 ν(N–H), 3249 ν(O–H), 1653 ν(C![[double bond, length as m-dash]](https://www.rsc.org/images/entities/char_e001.gif) O), 1598 ν(CN), 1555, 1459 ν(phenyl-ring), 1509, 1395 ν(pyrazole-ring).
O), 1598 ν(CN), 1555, 1459 ν(phenyl-ring), 1509, 1395 ν(pyrazole-ring).
Preparation of TCCP materials
A stock solution (3 mL) containing pure DPA (0.25 mM) or compound 1, or mixed solution of compound 1 (2.5 mM) with different mass ratio DPA (DPA: 0%, 5%, 10%, 15% and 20%) in ethanol was quickly injected into poor solvent of deionized water (6 mL) under ultrasound. Then, the mixture maintained for 10 h at 30 °C to get co-aggregates. The co-aggregates was separated from mixture by centrifugation and dried for 5 h at 50 °C in vacuo.35,36
Results and discussion
Photochromic properties and mechanism of 1 in crystalline state
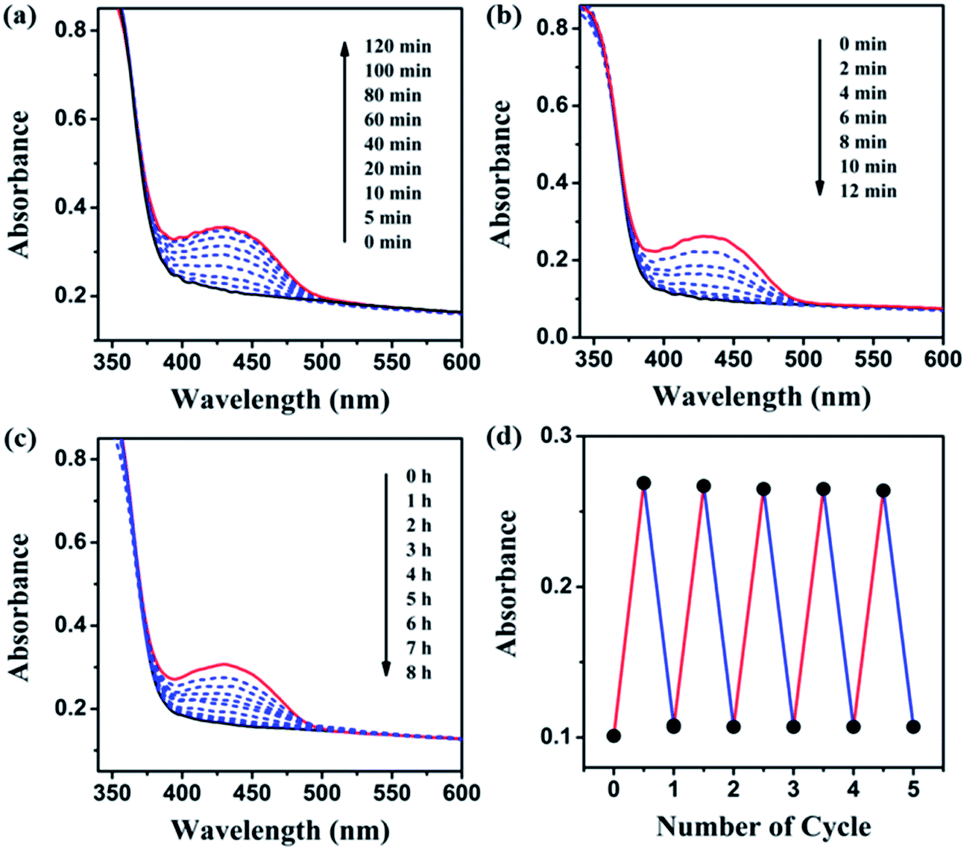
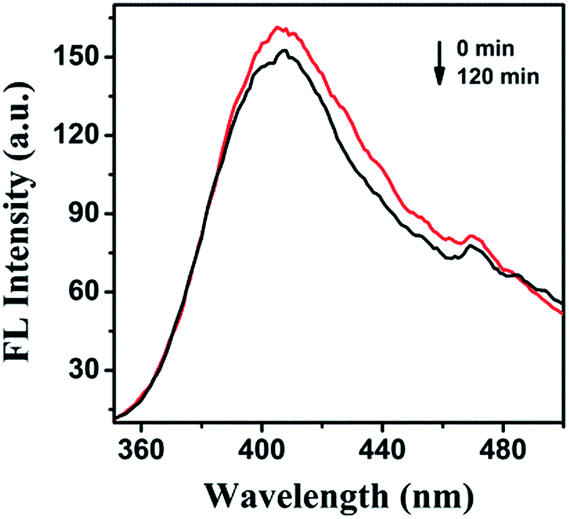
Photochromic properties in crystalline state. The novel compound 1 exhibits well dual-response and fatigue resistance performance in crystalline state. The absorption spectra of compound 1 were examined under UV light irradiation (365 nm) and varying visible light (λ > 510 nm) or heating at a temperature of 100 °C. Subsequently, a wide absorption band appeared and the absorption intensity around 380–500 nm continuously increased with the prolonged irradiation time (Fig. 1a). Meanwhile, the colour transformed from white to yellow. The colouring process obeys first-order kinetics with rate constant 2.26 × 10⁻² s−1 for 1 (Fig. S4†). Fig. 1b and c illustrate that heating or visible light stimulation can decolour the photostationary state. The variations disclosed that 1 undergoes photochromic properties because of the photo-isomerisation from enol form (E-form) 1a to keto form (K-form) 1b in crystalline state. The fatigue resistance performance of compound 1 was characterized using UV-vis spectra specifying its high resistance to light and heat (Fig. 1d). Moreover, the fluorescence properties of compound 1 were further investigated in crystalline state. Fig. 2 illustrates the low fluorescent contrast of compound 1.
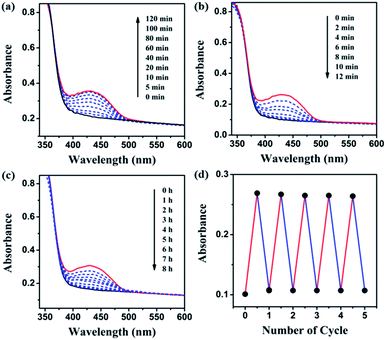 |
| | Fig. 1 Absorbance spectra under UV irradiation (a) and decolouring spectra of compound 1 (b) with visible light or (c) heating at 100 °C. (d) The colouration-bleaching cycles (red line: UV irradiation; blue line: heating or visible light). | |
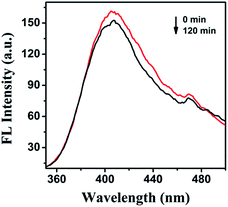 |
| | Fig. 2 Fluorescence spectra of 1 before irradiation (red line) and after irradiation (black line) with 365 nm light. | |
Structure characterisation and photochromic mechanism
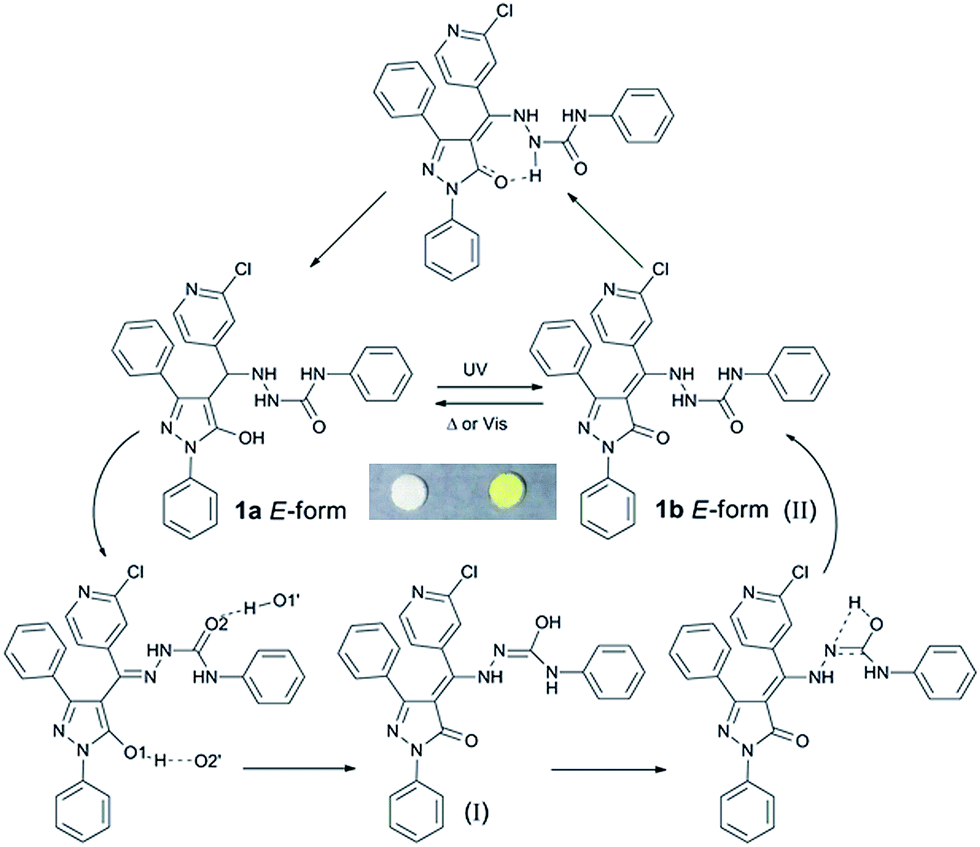
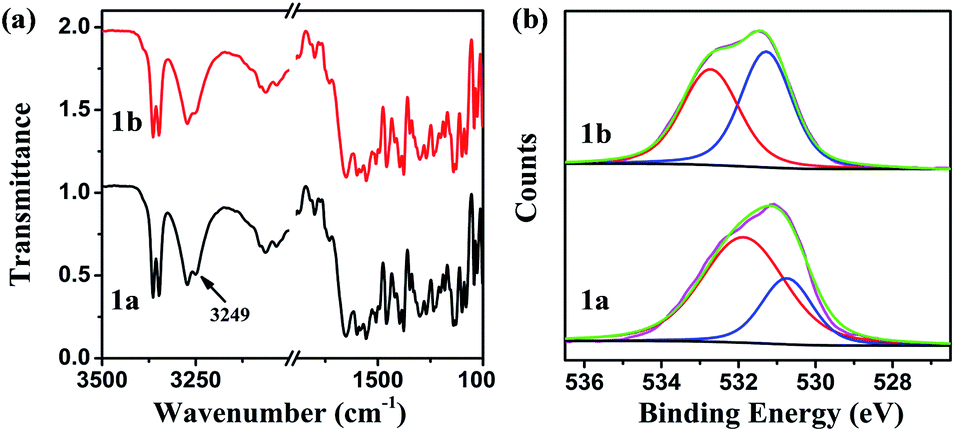
A detailed analysis of photochromic mechanism of compound 1 (Scheme 3) was conducted with IR, XPS spectra, crystal structure data and theoretical calculation as follows. The peak at 3249 cm−1 in IR spectra is assigned to O–H vibration, which shifted to lower wavenumber due to the strong hydrogen bonds within the crystalline state. Meanwhile, the apparent variation is ascribed to the isomerization of E-form and K-form (Fig. 3a). The crest of O–H vibration dissipates under the irradiation due to the formation of 1b. With an ultimate objective to obtain the concrete tautomerism of 1, the XPS spectrum was put into execution to distinguish the isomerization through binding energy changes of C–O and CO. Therefore, O 1s spectra variation of 1 was monitored to verify the photochromic mechanism (Fig. 3b). The O 1s peak can be sectioned into two parts by curve fitting. The O 1s energy spectrum fitting peaks of E-form appear at 532.34 and 530.88 eV,37 which can be assigned to C–O and CO, and the integrated areas of energy spectrum peaks are 71% and 29%, correspondingly. Subsequently, the binding energies of K-form at 532.72 and 531.28 eV are ascribed to C–O and CO, and the integrated areas are 51% and 49%, respectively. The obvious variation can be implemented to estimate the photo-isomerization by related integrated areas. The integral areas of C–O increased but integral areas of CO decreased for colour-changed compound, reflecting the E-form 1a is converted to K-form 1b.
 |
| | Scheme 3 Photochromic mechanism of compound 1 (′: neighboring molecule). | |
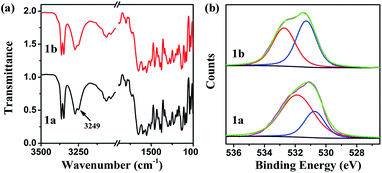 |
| | Fig. 3 (a) FT-IR spectra of 1 before UV irradiation (black) and after (red), (b) XPS spectra of O 1s before (1a) and after (1b) with 365 nm irradiation. | |
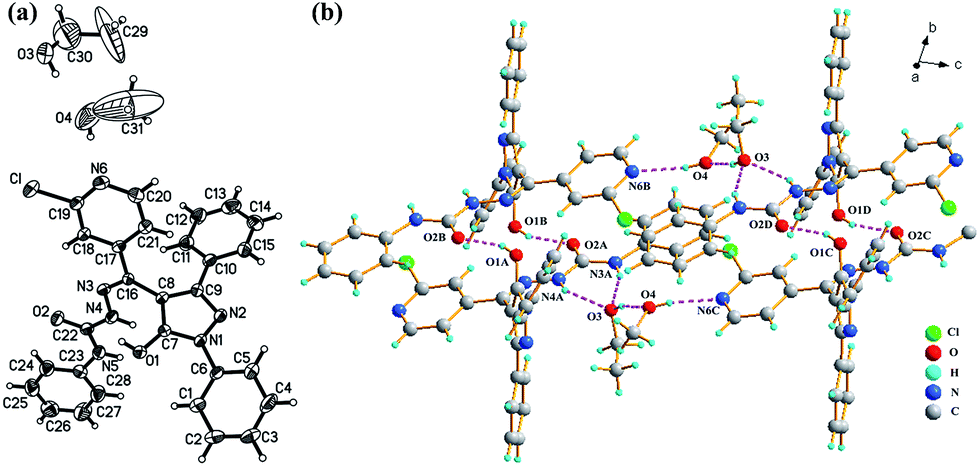
Single crystal X-ray diffraction was implemented to analysis the photochromic mechanism of pyrazolone derivative 1. The single crystal of 1 was generated using slow evaporation of ethanol and methanol mixtures (1![[thin space (1/6-em)]](https://www.rsc.org/images/entities/char_2009.gif) :2 v/v) at ambient temperature. The crystal data and structure refinement details were summarised in Table S1.† The corresponding bond length can be seen (Table S2†). The C7–O1 bond distance is 1.325(4), which is comparable to C–O single bond. The observations further prove that the sample of colourless 1 exist in E-form. Fig. 4a shows the crystal structure of compound 1, where two solvent molecules are comprised in the unit of 1. The dimer of compound 1 is formed by alternative intermolecular hydrogen bond [O(1)–H(1O)⋯O(2)] as listed in Table S3,† and 1D chains are constructed through bridge hydrogen bond of solvent (Fig. 4b). Further, there exist no inherent hydrogen bonds between oxygen and nitrogen through the analysis of the hydrogen bonding in the single crystal structure. Therefore, it is valid to elaborate the photochromic mechanism of the tautomerization process of compound 1 via the multi-proton transfers. Firstly, the proton of the O1 atom is transferred to the O2 atom of the adjacent molecule and the proton of the O2 atom is transferred to the O1 atom of the neighboring molecule via the alternative intermolecular hydrogen bonds [O1–H⋯O2′]. At the same time, the hydrogen of the N4 atom transfers to the N3 atom. And then, the hydrogen of O2 atom transfers to the N4 atom through the intramolecular hydrogen bond to form a K-form. In reverse reaction, hydrogen of the N4 atom was transferred to O1 atom with the intramolecular hydrogen bond to form E-form.
:2 v/v) at ambient temperature. The crystal data and structure refinement details were summarised in Table S1.† The corresponding bond length can be seen (Table S2†). The C7–O1 bond distance is 1.325(4), which is comparable to C–O single bond. The observations further prove that the sample of colourless 1 exist in E-form. Fig. 4a shows the crystal structure of compound 1, where two solvent molecules are comprised in the unit of 1. The dimer of compound 1 is formed by alternative intermolecular hydrogen bond [O(1)–H(1O)⋯O(2)] as listed in Table S3,† and 1D chains are constructed through bridge hydrogen bond of solvent (Fig. 4b). Further, there exist no inherent hydrogen bonds between oxygen and nitrogen through the analysis of the hydrogen bonding in the single crystal structure. Therefore, it is valid to elaborate the photochromic mechanism of the tautomerization process of compound 1 via the multi-proton transfers. Firstly, the proton of the O1 atom is transferred to the O2 atom of the adjacent molecule and the proton of the O2 atom is transferred to the O1 atom of the neighboring molecule via the alternative intermolecular hydrogen bonds [O1–H⋯O2′]. At the same time, the hydrogen of the N4 atom transfers to the N3 atom. And then, the hydrogen of O2 atom transfers to the N4 atom through the intramolecular hydrogen bond to form a K-form. In reverse reaction, hydrogen of the N4 atom was transferred to O1 atom with the intramolecular hydrogen bond to form E-form.
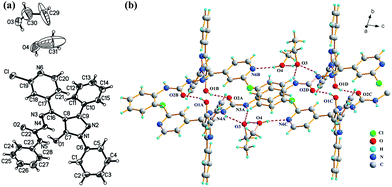 |
| | Fig. 4 (a) The crystal structure and (b) hydrogen-bonded connection diagram of compound 1. | |
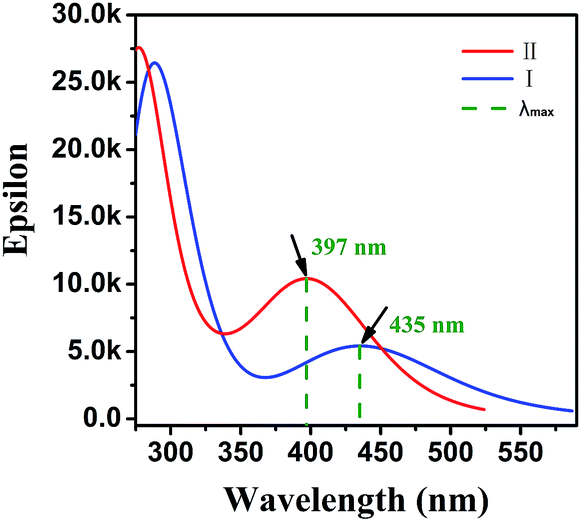
Quantum chemical calculation is a logical aspect to research the correlation between spectra and structure of molecules.38–40 Hence, we intended to obtain the colour-changed K-form under some spectroscopic parameters of UV-vis absorption through relationship spectra-structure to further confirm the rationality of photochromic mechanism. The six K-form isomers (I, II, III, IV, V, VI) were constructed on the premise of the E-form single crystal structure (Fig. S8†). All calculations in this report were carried out using the Gaussian 09 program.41 The structure of molecules were optimised and frequencies were calculated by implementing density functional theory (DFT) following the Becke3–Lee–Yang–Parr (B3LYP) with 6-31G(d,p) as basis set. UV-vis absorption along with HOMO and LUMO for six isomers at optimised geometry in the ground state were executed by employing TD-DFT approach with the B3LYP(54% HF) function assorted with the 6-311G(d,p) basis set in the gaseous phase, which were listed in Table S4.† The results illustrate that the K-form I, II and VI demonstrate peak absorptions at the visible region. Their absorption spectra are shown in Fig. S9† with Multiwfn analysis.42 Only the absorption spectrum profiles of isomers I and II was similar to experimental spectrum. TD-DFT calculation of I in the gaseous phase predicts three electronic transitions at 546, 453 and 403 nm with oscillator strength of 0.0070, 0.0964 and 0.0593 respectively. These absorptions are assigned to electron excitations of H → L (99%), H−1 → L (98%) and H−2 → L (94%) respectively. Two electronic transitions of II are 484 and 403 nm with oscillator strength 0.0088 and 0.2314 for electron excitations of H → L (99%), H−1 → L (98%). The maximum values of K-form I and II are at 435 nm and 397 nm, where, red-shifted by ∼4 nm and blue-shifted by ∼34 nm for experimental λmax values coloured 1 (431 nm) respectively (Fig. 5). Although the maximum absorption of K-form I is close to the experiment result, the absorption ranges of II is more nearly experiment spectrum at visible area. This situation can be attributed to two aspects: (1) the excitation energy is directly dependent on the Hartree–Fock (HF) exchange percentage.43–46 (2) Colour-changed 1 may exist two K-forms of I and II. To this, the calculated relative sum of electronic and thermal free energies of II with respect to I is analysed. The relative value is about −16.30 kcal mol−1 (scale factor = 0.9614), which indicated that the isomerization reaction from I to II can be carry out spontaneously. The coloured K-form is confirmed according to theoretical calculations, which can further prove the rationality of our proposed photochromic mechanism.
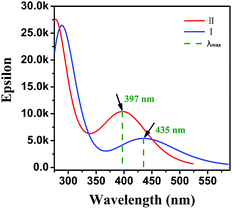 |
| | Fig. 5 The theoretical absorption spectra of K-form I and II with B3LYP/6-311G(d,p). | |
The preparation and switchable properties of TCCM
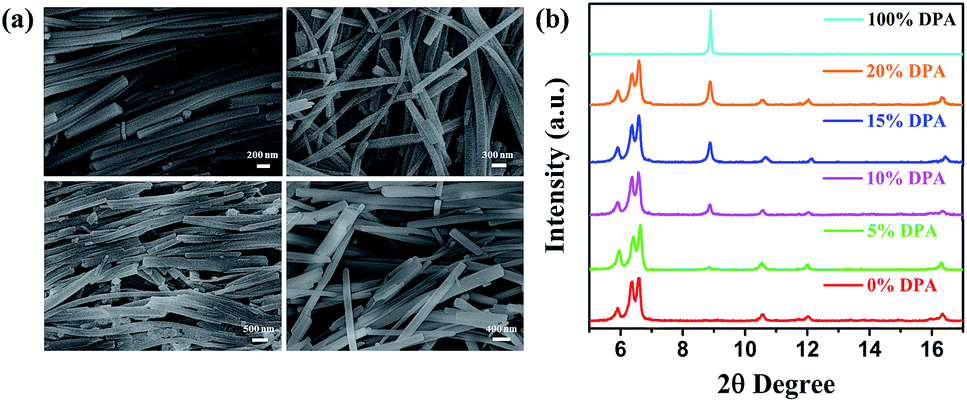
The preparation and characterisation of TCCM. The TCCM were prepared with various contents of DPA by co-aggregating with 67% volume fractions of water left for aging with 10 h. The preparation details of optimisation condition were recorded in ESI.† Reprecipitates of DPA was also measured following the time (Fig. S10†). Reprecipitates DPA take the shape of the schistose structure, and the width decrease with prolonging duration. However SEM spectra of different contents of TCCM barely possess schistose structure which also indicates that compound 1 can effectively control the morphology of DPA (Fig. 6a). In addition, the typical X-ray diffraction (XRD) of TCCM with smooth baseline shows significant differences (Fig. 6b). As the DPA content augments, the diffraction peak at 2θ = 8.895 degree gradually enhances and is consistent with patterns of DPA. However, characteristic diffraction peaks for compound 1 have almost no change at all. The results confirm that the crystalline of TCCM is basically stable.
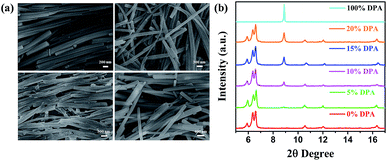 |
| | Fig. 6 (a) The SEM spectra of TCCM (A) 5%, (B) 10%, (C) 20%, (D) 30%, (b) powder XRD patterns of reprecipitates 1, DPA and TCCM for aging 10 h. | |
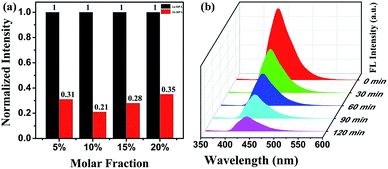
The fluorescence switch properties of TCCM. The fluorescence spectra were performed to examine the switch properties of TCCM. Fluorescence intensity of the TCCM was collected at 445 nm before and after irradiation in crystalline state (Fig. 7a). The high fluorescence contrast can be reflected through the good fluorescence modulation rate. The fluorescence modulation ratio (FM ratio = 1 − Ioff/Ion)47,48 declined with DPA contents of 5% and 10%, while augmented with a further adding of DPA content. Besides, when the mole fraction of DPA in TCCM is as high as 10%, the switch exhibits an excellent fluorescence contrast of 79% in contrast to the crystalline-state 1 (FM ratio ∼ 6%). Thus, 10% composites are regarded as an optimised molar ratio in this study. Fig. 7b shows the fluorescence regulation of 10% based on the irradiation time. The results showed that the energy donor of DPA could be effectively regulated with FRET using the photochromic reactions of energy acceptor 1 upon 365 nm light irradiation in crystalline state.
 |
| | Fig. 7 (a) The normalized fluorescence intensities at 445 nm of TCCM in crystalline state before (black) and after (red) irradiation. (b) Fluorescence spectra changes of doping 10% DPA depending on the irradiation time, λex: 350 nm. | |
The FRET efficiency can be estimated using the fitting average lifetime according to eqn (1),49,50
here,
τ1 and
τ2 are deemed as the fitting lifetime of
TCCM before and after irradiation of 365 nm light irradiation in crystalline state. The energy transfer efficiency from the excited state of
DPA to the K-form
1b can be weighed using the fluorescence life analysis method. The fluorescence decay curves of reprecipitates
1 and
TCCM are depicted at 445 nm before and after the irradiation at room temperature. The lifetimes of reprecipitates
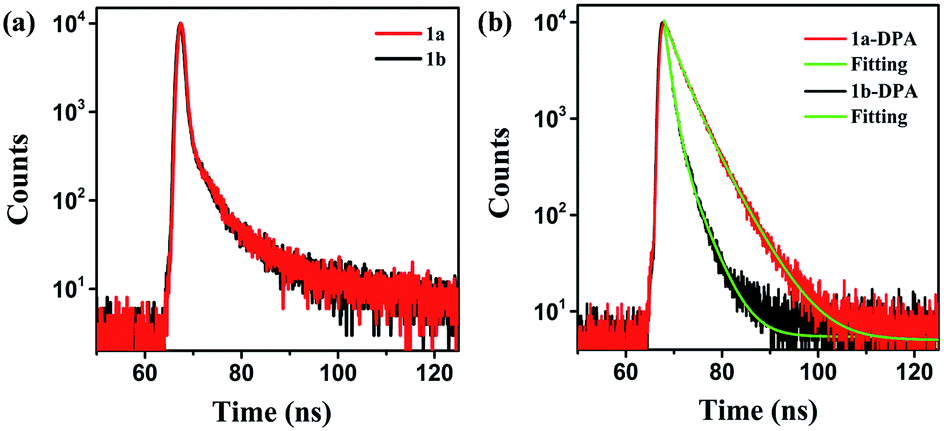
1 exhibit no drastic variation before and after the irradiation, which indicates that the reprecipitates possess no substantial self-absorbance before and after irradiation (
Fig. 8a). Whereas, the fluorescence decay curves of
TCCM evidently exhibit the variations (
Fig. 8b and S11
†). The results elucidate that the FRET process takes place in
TCCM. The energy transfer efficiency reaches to the maximum (55%) for 10%
TCCM and the FRET tendency of
TCCM is in contrast with FM ratio (Table S5
†). The FM and FRET efficiency results indicate that the 10%
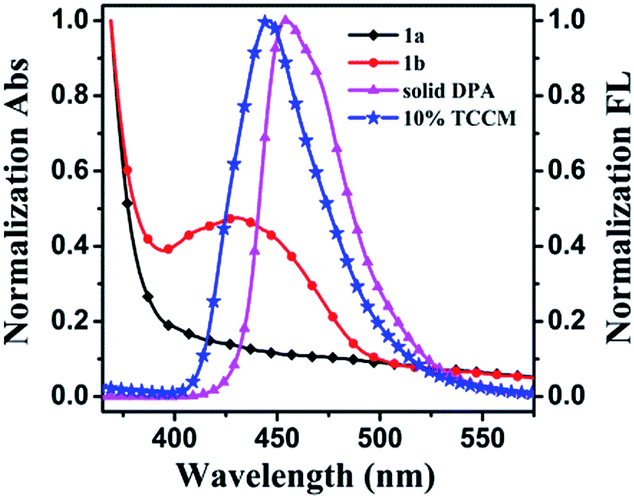
TCCM is a more appropriate ratio. The impairment of fluorescence intensity can be closely associated with the well superimposed fluorescence spectra of fluorophore with the absorption spectra of K-form
1b (
Fig. 9), which should be beneficial for efficient FRET.
51,52
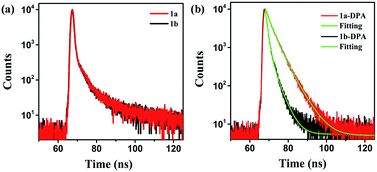 |
| | Fig. 8 (a) Fluorescence decay profiles of 10% before and after irradiation at room temperature. (b) Fluorescence decay curves of reprecipitates 1 before and after irradiation. | |
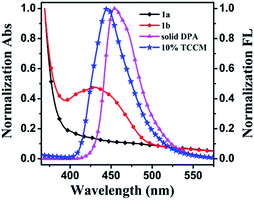 |
| | Fig. 9 The normalized overlay of emission spectra of DPA (purple line) and 10% TCCM (blue line) and absorption spectra of 1 before (black line) and after (red line) under irradiation with 365 nm light. | |
Conclusions
The novel dual-responded photochromic pyrazolone compound 1 with pyridine ring exhibits great photochromic properties and fatigue resistance ability in crystalline state. The fluorescence modulation of TCCM was realised through FRET from energy donor DPA to energy accepter 1b by photochromic reactions. The fluorescence contrast reaches to 79% with 55% energy transfer efficiency in optimised molar ratio of 10% TCCM. Based on his high-contrast fluorescent switch characteristic and inherent feature of photochromic material, TCCM may have potential application for data storage and switch.
Acknowledgements
This work is supported by the National Natural Science Foundation of China (21571152, 21262038 and U1203292), National 973 Program on Key Basic Research Project of China (2014CB660805), The Natural Science Foundation of Xinjiang Uygur Autonomous Region (2013211B04).
References
- G. Berkovic, V. Krongauz and V. Weiss, Chem. Rev., 2000, 100, 1741–1754 CrossRef CAS PubMed.
- T. Fukaminato, J. Photochem. Photobiol., C, 2011, 12, 177–208 CrossRef CAS.
- H. Li and D. H. Qu, Sci. China: Chem., 2015, 58, 916–921 CrossRef CAS.
- C. Yun, J. You, J. Kim, J. Huh and E. Kim, J. Photochem. Photobiol., C, 2009, 10, 111–129 CrossRef CAS.
- Y. Yokoyama, Chem. Rev., 2000, 100, 1717–1740 CrossRef CAS PubMed.
- M. Irie, Chem. Rev., 2000, 100, 1685–1716 CrossRef CAS PubMed.
- B. H. Rau, Angew. Chem., Int. Ed. Engl., 1973, 12, 224–235 CrossRef.
- M. Han and M. Hara, J. Am. Chem. Soc., 2005, 127, 10951–10955 CrossRef CAS PubMed.
- F. M. Raymo and M. Tomasulo, Chem. Soc. Rev., 2005, 34, 327–336 RSC.
- G. Y. Jiang, S. Wang, W. F. Yuan, L. Jiang, Y. L. Song, H. Tian and D. B. Zhu, Chem. Mater., 2006, 18, 235–237 CrossRef CAS.
- S. J. Lim, J. Seo and S. Y. Park, J. Am. Chem. Soc., 2006, 128, 14542–14547 CrossRef CAS PubMed.
- S. Z. Pu, H. C. Ding, G. Liu, C. H. Zheng and H. Y. Xu, J. Phys. Chem. C, 2014, 118, 7010–7017 CAS.
- A. J. Myles and N. R. Branda, Adv. Funct. Mater., 2002, 12, 167–173 CrossRef CAS.
- J. Karnbratt, M. Hammarson, S. Li, H. L. Anderson, B. Albinsson and J. Andreasson, Angew. Chem., Int. Ed., 2010, 49, 1854–1857 CrossRef PubMed.
- M. Berberich, A. M. Krause, M. Orlandi, F. Scandola and F. Wurthner, Angew. Chem., Int. Ed., 2008, 47, 6616–6619 CrossRef CAS PubMed.
- E. Deniz, S. Sortino and F. M. Raymo, J. Phys. Chem. Lett., 2010, 1, 1690–1693 CrossRef CAS.
- A. Reisch, P. Didier, L. Richert, S. Oncul, Y. Arntz, Y. Mély and A. S. Klymchenko, Nat. Commun., 2014, 5, 4089 CAS.
- K. Trofymchuk, L. Prodi, A. Reisch, Y. Mély, K. Altenhöner, J. Mattay and A. S. Klymchenko, J. Phys. Chem. Lett., 2015, 6, 2259–2264 CrossRef CAS PubMed.
- H. Li, J. X. Wang, H. Lin, L. Xu, W. Xu, R. M. Wang, Y. L. Song and D. B. Zhu, Adv. Mater., 2010, 22, 1237–1241 CrossRef CAS PubMed.
- I. Yildiz, E. Deniz and F. M. Raymo, Chem. Soc. Rev., 2009, 38, 1859–1867 RSC.
- Y. Chen and N. Xie, J. Mater. Chem., 2005, 15, 3229–3232 RSC.
- M. Tomasulo, S. Giordani and F. M. Raymo, Adv. Funct. Mater., 2005, 15, 787–794 CrossRef CAS.
- E. M. Lee, S. Y. Gwon, Y. A. Son and S. H. Kim, J. Lumin., 2012, 132, 1427–1431 CrossRef CAS.
- J. X. Guo, L. Liu, G. F. Liu, D. Z. Jia and X. L. Xie, Org. Lett., 2007, 9, 3989–3992 CrossRef CAS PubMed.
- J. X. Guo, D. Z. Jia, L. Liu, H. Yuan, M. X. Guo, D. L. Wu and F. Li, J. Mater. Chem., 2011, 21, 12202–12205 RSC.
- H. Yuan, J. Guo, D. Jia, M. Guo, L. Liu, D. Wu and F. Li, Photochem. Photobiol. Sci., 2011, 10, 1562–1567 CAS.
- J. X. Guo, Y. C. Zhang, D. Z. Jia, M. X. Guo and Y. H. Li, Photochem. Photobiol. Sci., 2016, 15, 1222–1226 CAS.
- L. Liu, H. B. Sun, S. Abdurehman, D. Z. Jia, J. X. Guo and D. L. Wu, J. Photochem. Photobiol., A, 2013, 267, 55–59 CrossRef CAS.
- Q. Liao, H. B. Fu and J. N. Yao, Adv. Mater., 2009, 21, 4153–4157 CrossRef CAS.
- H. Tian and S. J. Yang, Chem. Soc. Rev., 2004, 33, 85–97 RSC.
- B. S. Jensen, Acta Chem. Scand., 1959, 13, 1668–1670 CrossRef CAS.
- A. Akbarzadeh and R. Soleymani, Orient. J. Chem., 2012, 28, 153–164 CrossRef CAS.
- J. X. Guo, D. Jia, L. Liu, H. Yuan and F. Li, J. Mater. Chem., 2011, 21, 3210–3235 RSC.
- H. Liu, J. X. Guo, D. Z. Jia, M. X. Guo, L. Liu and D. L. Wu, New J. Chem., 2015, 39, 9866–9871 RSC.
- Q. Liao, H. B. Fu, C. Wang and J. N. Yao, Angew. Chem., Int. Ed., 2011, 50, 4942–4946 CrossRef CAS PubMed.
- H. Tong, Y. Dong, M. Häußler, J. W. Y. Lam, H. H. Y. Sung, I. D. Williams, J. Sun and B. Z. Tang, Chem. Commun., 2006, 10, 1133–1135 RSC.
- E. Ito, H. Oji, T. Araki, K. Oichi, H. Ishii, Y. Ouchi, T. Ohta, N. Kosugi, Y. Maruyama, Y. Naito, T. Inable and K. Seki, J. Am. Chem. Soc., 1997, 119, 6336–6344 CrossRef CAS.
- S. A. Bhat and S. Ahmad, J. Mol. Struct., 2016, 1105, 169–177 CrossRef CAS.
- M. Karabacak, M. Cinar, M. Kurt, A. Poiyamozhi and N. Sundaraganesan, Spectrochim. Acta, Part A, 2014, 117, 234–244 CrossRef CAS PubMed.
- M. Karabacak, Z. Cinar, M. Kurt, S. Sudha and N. Sundaraganesan, Spectrochim. Acta, Part A, 2012, 85, 179–189 CrossRef CAS PubMed.
- M. J. Frisch, G. W. Trucks, H. B. Schlegel, et al., Gaussian 09 revision A.01, Gaussian Inc, Wallingford, CT, 2010 Search PubMed.
- T. Lu and F. Chen, J. Comput. Chem., 2012, 33, 580–592 CrossRef CAS PubMed.
- M. Walker, A. J. A. Harvey, A. Sen and C. E. H. Dessent, J. Phys. Chem. A, 2013, 117, 12590–12600 CrossRef CAS PubMed.
- E. Vessally, S. S. Amiri, A. Hosseinian, L. Edjlali and A. Bekhradnia, Phys. E, 2016, 87, 308–311 CrossRef.
- A. J. Cohen, P. Mori-Sánchez and W. Yang, Chem. Rev., 2012, 112, 289–320 CrossRef CAS PubMed.
- J. Beheshtian, Z. Bagheri, M. Kamfiroozi and A. Ahmadi, Microelectron. J., 2011, 42, 1400–1403 CrossRef CAS.
- M. Bossi, V. Belov, S. Polyakova and S. W. Hell, Angew. Chem., Int. Ed., 2006, 45, 7462–7465 CrossRef CAS PubMed.
- J. Folling, S. Polyakova, V. Belov, A. van Blaaderen, M. L. Bossi and S. W. Hell, Small, 2008, 4, 134–142 CrossRef PubMed.
- M. Tramier, I. Gautier, T. Piolot, S. Ravalet, K. Kemnitz, J. Coppey, C. Durieux, V. Mignotte and M. C. Moisan, Biophys. J., 2002, 83, 3570–3577 CrossRef CAS PubMed.
- A. Hoppe, K. Christensen and J. A. Swanson, Biophys. J., 2002, 83, 3652–3664 CrossRef CAS PubMed.
- B. K. An, S. K. Kwon, S. D. Jung and S. Y. Park, J. Am. Chem. Soc., 2002, 124, 14410–14415 CrossRef CAS PubMed.
- F. G. Shen, A. D. Peng, Y. Chen, Y. Dong, Z. W. Jiang, Y. B. Wang, H. B. Fu and J. N. Yao, J. Phys. Chem. A, 2008, 112, 2206–2210 CrossRef CAS PubMed.
Footnote |
| † Electronic supplementary information (ESI) available: NMR spectra, kinetics plot of compound 1; fluorescence decay curves, SEM; tables of crystal data, selected bond length, hydrogen bonds. CCDC 1526956. For ESI and crystallographic data in CIF or other electronic format see DOI: 10.1039/c6ra27937f |
|
| This journal is © The Royal Society of Chemistry 2017 |
Click here to see how this site uses Cookies. View our privacy policy here. 
 Open Access Article
 This Open Access Article is licensed under a
  *,
Anjie Liu,
Dianzeng Jia*,
Xueyan Wu and
Yi Chen
*,
Anjie Liu,
Dianzeng Jia*,
Xueyan Wu and
Yi Chen