
 Open Access Article
 This Open Access Article is licensed under a
 Creative Commons Attribution 3.0 Unported Licence
Complete sampling of an enzyme reaction pathway: a lesson from gas phase simulations
Jernej Stare
Department of Computational Biochemistry and Drug Design, National Institute of Chemistry, Hajdrihova 19, SI-1000 Ljubljana, Slovenia. E-mail: jernej.stare@ki.si
First published on 27th January 2017
Abstract
This work addresses the sampling issue commonly accompanying the simulation of chemical reactions. Very often the sampling is severely limited by complexity of the phase space, possibly leading to poorly converged or inaccurate free energy profiles. We explored the factors governing the completeness of reaction path sampling for the rate limiting step of phenylethylamine oxidation by lumiflavin in the gas phase, a reaction important for the pharmacology of the central nervous system. The simulations utilize the free energy perturbation sampling technique together with the empirical valence bond methodology for the free energy calculations. The simplicity of the system allows for the acquisition of fully converged free energy profiles, even for simulation free of restraints. The bottleneck for convergence is in the noticeably poorer sampling statistics in the transition state region, which is resolved by performing sufficiently long simulation to ensure reversibility of all processes accompanying the reaction. In the present case, convergence is attained in microseconds of simulation, but the required simulation time generally depends on the complexity of the potential energy surface pertinent to the reaction. Accordingly, the use of restraints reduces the complexity of the phase space, decreasing the required time by about an order of magnitude. In the case of elementary nucleophilic substitution with even simpler potential energy surface convergence is reached already at a timescale of few nanoseconds. For related biomolecular reactions embedded in an enzyme, significantly longer simulation times may be needed, rendering the sampling problem exceedingly difficult and representing a challenge for advanced sampling techniques. Accordingly, suggestions are given for optimal simulation of biomolecular reactions based on the presently employed techniques and under the aforementioned limitations.
1. Introduction
“Throwing ropes over rough mountain passes, in the dark,”1 is the picturesque description of the long-standing problem of sampling of reaction pathways on complex, multidimensional potential energy landscapes in the transition state region. This metaphor comprises the title of a highly cited review article on the transition path sampling (TPS) approach,1 a special class of techniques aimed at acquiring reliable information characterizing the poorly accessible transition state regions and therewith associated mechanistic aspects of chemical reactions and physical processes as well as their thermodynamic and kinetic parameters.The sampling issue derives from the fact that the barrier regions separating the minima on potential energy surfaces are often high enough in energy to render the presence of the system near the top of the barrier an extremely rare event. For instance, a barrier typical of enzymatic reactions (∼18 kcal mol−1) converts into a 13 orders of magnitude (10-trillion-fold) reduced probability (relative to the minimum energy region) for the system to spontaneously find itself atop the barrier. To date, unbiased simulation protocols are by several orders of magnitude short at providing adequate statistics for chemical reactions and physical conversions accompanied by such barriers. In addition, the extreme complexity of the potential energy surfaces (involving thousands of degrees of freedom for macromolecular systems in the condensed phase) makes the sampling of relevant phase space areas exceedingly difficult. Not surprisingly, a formidable effort has been put in overcoming these problems, resulting in a diverse array of methodologies targeting the reaction path sampling that have been developed in the last decades – for example, metadynamics,2 local elevation,3 umbrella sampling,4 parallel tempering,5 replica exchange molecular dynamics,6 nudged elastic band,7 replica path,8 the aforementioned TPS,1 and many others. These methods differ greatly both in fundamental and technical aspects, but in general they facilitate efficient sampling of the reaction pathways at affordable computational expenses using a reduced set of variables/coordinates. Nevertheless, they all share the problem that the complexity issues can never be entirely circumvented. An a priori knowledge about the structures or coordinates involved in the reaction is most often required. For instance, metadynamics relies on a small set of collective coordinates related to the process, but the definition of these coordinates in terms of internal structural parameters has to be specified in advance, which can be all but trivial for complex systems. In contrast, rather than requiring information on coordinates, TPS methods use a priori information on the structures taking part in the process, but the acquisition of this information can be a similarly challenging task. Therefore, for depicting issues related to the simulation of chemical reactions embedded in a complex condensed phase environment, the introductory metaphor can be regarded as universal and generic.
Biomolecular reactions and processes are among the most popular topics strongly affected by the “ropes over mountains” sampling issues, because many of them occur at timescales of milliseconds to seconds and involve sizable geometric changes of high complexity. Arguably the best known such example is protein folding, which has been posing challenges for simulation studies for decades. To date, it has been possible to accurately simulate by unbiased molecular dynamics (MD) folding processes of small proteins consisting of 10–80 residues at approximate timescales of 0.1–3 milliseconds, yielding valuable information on the mechanism and kinetics of the process.9,10 Such long simulations were made possible by a specially designed supercomputer that reportedly features over 100 times higher performance than general purpose supercomputing facilities.11,12 Nevertheless, despite the respectable computational power invested, these cases are regarded as simple and fast-folding, and the associated barriers are estimated to be below 3 kcal mol−1. Recent experience with conformational dynamics of proteins also includes TPS simulations, but has been limited to moderately sized proteins due to timescale issues.13 The immense complexity of folding and side chain dynamics has been elucidated experimentally by NMR spectroscopy.14
This work focuses on a comparably complex topic, namely enzymatic reactions. Virtually all life processes are made possible by enzymes that provide considerable speedup by lowering the free energy barrier of chemical reactions involved in these processes. It is therefore not surprising that enormous efforts have been made to elucidate numerous aspects of enzymatic reactions from the theoretical standpoint. The most fundamental one addresses the origin of catalytic activity of enzymes, which has been a source of a vivid debate for decades.15–24 The key issue in this debate has been whether or not dynamical effects in enzymes (i.e., motions facilitating the crossing of the barrier, hence not obeying Boltzmann statistics in the transition state region) contribute to their catalytic power. There has been growing evidence that these effects at best play minor role in the enzyme kinetics, and that the crucial part of the catalytic activity originates from evolutionary optimized preorganized electrostatics ensuring that the transition state is stabilized to a greater extent than the state of reactants, thereby reducing the free energy barrier.23,24 According to this concept, the transition state theory is valid and Boltzmann statistics takes effect in the transition state region. These aspects and the related issues have been recently reviewed by the author of the hypothesis of preorganized electrostatics.24
Although the role of presumed dynamical coupling between the chemical and conformational coordinates (i.e., the one ascribing the chemical reaction and the ones defining the conformation of the enzymatic environment) in enzyme catalysis has been refuted, at least by those supporting the view that the catalysis is due to preorganized electrostatics,24 it is evident that the coupling between these coordinates exists via the potential energy surface. This coupling is not dynamical in nature and does not require time-resolved techniques (e.g., it could be treated by Monte Carlo sampling). Nevertheless, since conformational fluctuations of the enzyme can affect the chemical reaction taking place in the enzyme, the simulation of the reaction should in principle include adequate sampling of conformational fluctuations. This can be a very challenging task because it often happens that neither the coordinates governing conformational fluctuations nor the structures of involved conformers are known in advance, hence making the popular biased sampling techniques difficult to use. In addition, the corresponding timescales related to conformational shifts can be exceedingly long.
Another challenging aspect of enzyme reactions is the sampling of conformational degrees of freedom within the reacting moiety, i.e. the alignment between the substrate and the reacting residue or cofactor. These degrees of freedom are evidently important for the reaction, but they are usually hindered by the surrounding enzymatic environment, making their sampling a challenging task. To ensure reasonable convergence of free energy profiles without the necessity of running exceedingly long simulations, a common practice has been established with EVB simulations to restraint the torsional alignment between the reacting molecules.25–28 In this way, convergence of free energy profiles is ensured at the expense of confining the conformational phase space, thereby disregarding the “ropes over mountains” issue. With restraints, precision of ∼0.5 kcal mol−1 in the computed free energy barriers is fairly easily achieved, whereas deviations between the profiles can be much larger without restraints. However, the impact of such practice is poorly understood and requires further analysis. In the first place the influence of the intermolecular degrees of freedom between the reacting molecules would have to be examined by performing a thorough sampling of the phase space along these coordinates, but for a fully featured enzymatic environment this can be a tedious task.
Simulation of chemical reactions imposes an additional requirement, namely accuracy. The substantial changes of the electronic structure associated with the breaking and formation of chemical bonds suggest that the principles of quantum mechanics need to be employed for a correct treatment. At the same time, the methodology must allow for sufficiently long timescales in order to properly explore the chemical and conformational phase space. Multiscale QM/MM methods combine both the accuracy of quantum chemistry as well as the ability to treat large systems, but the high computational cost of the quantum part of the protocol usually limits the accessible timescale to tens or hundreds of picoseconds of simulation, which severely limits thermal averaging capability. In this regard the Empirical Valence Bond (EVB) methodology developed by Warshel29–31 has a noticeable performance advantage over most of its peers, because the quantum treatment is imposed on the empirical valence states rather than on the electronic structure, thus avoiding the costs of electronic structure calculations. As such, EVB facilitates simulation of chemical reactions at expenses typical of classical simulations. Additionally, the EVB method has been developed and tuned for chemical reactions embedded in macromolecular environment and has evolved into a robust and reliable tool for the treatment of enzymatic reactions.23,29,32–39 An interesting note should be made here on exploring the precision of QM/MM methods. Two very recent studies scrutinize the convergence of free energy profiles of an enzymatic reaction computed by QM/MM simulation with respect to the size of the QM region, reaching different conclusions despite they are considering the same reaction in the same enzyme,40,41 indicating complexity of enzymatic reactions and their simulations.
One of the most fundamental aspects of the EVB approach is the principle of reference reaction.29 Prior to application to the reaction of interest (e.g., in the enzyme), the tunable EVB parameters have to be calibrated on the reference reaction, that is, the same reaction proceeding by the same mechanism,29 usually (but not mandatory) in the gas phase or in aqueous solution. This concept has been implemented not only in EVB simulations, but also in the underlying postulates about the origins of enzyme catalysis. Technically, in EVB simulations the mechanism is pre-determined and patched in the force fields and atomic charges depicting the two valence states (reactants and products) involved in the reaction (see Section 2). But whether this is enough to claim mechanistic equivalence between the investigated and reference reaction is rather unclear, requiring investigation of the role of conformational degrees of freedom.
A straightforward but illustrative simplification facilitating clarification of the aforementioned issues is to use gas phase models, thereby removing all conformational degrees of freedom of the surroundings (but keeping those within the reacting system). Such models easily allow for very long simulations, possibly reaching completeness of sampling – that is, that the resulting free energy profiles become independent of the initial conditions. The gas phase approach also allows for in-depth investigation of factors governing the convergence of profiles and assessment of mechanistic aspects. Additionally, as the gas phase model is often used for the calibration of EVB parameters,25,42 the sampling in gas phase simulations can already determine the accuracy of the entire EVB treatment, making detailed studies of biomolecular reactions in the gas phase highly relevant.
The scope of this work is to investigate factors governing the completeness of sampling of a biomolecular reaction. Using EVB simulation with gas phase models, we explored the conditions at which full convergence of free energy profiles is achieved. We considered the role of restraints commonly used in enzyme simulations. Our findings are supported by geometric aspects derived from trajectories. The influence of conformational degrees of freedom within the reacting moiety on the mechanism is analyzed, particularly in the sense that the gas phase reaction can be used as reference for the enzyme reaction. Additionally, this work provides guidelines for optimally designed simulations of maximum reliability within given conditions.
As model reaction we chose oxidation of phenylethylamine (PEA) by monoamine oxidase enzyme (MAO). MAO enzymes catalyze oxidation of primary amines in the central nervous system, mainly neurotransmitters such as dopamine, serotonin and noradrenalin, thereby regulating their levels. Additionally, endogenous neuromodulators such as PEA (also known as endogenous amphetamine) are also substrates of MAO. Deficient or elevated activity of MAO enzymes is a source of various neurological and psychiatric disorders and diseases.44 For example, an increased activity of MAO may lead to decreased levels of neurotransmitters, which is related to depression. Additionally, MAO activity is an inherent source of oxidative stress, ultimately leading to neuron death and development of neurodegenerative diseases such as Parkinson or Alzheimer disease. Due to their high clinical relevance, MAO enzymes have been subject of extensive experimental and theoretical studies.45–54 MAO enzymes exist in two isoforms, A and B.55,56 In the active site both include the flavin adenine dinucleotide (FAD) cofactor covalently bound to the cysteine residue. FAD acts as an oxidizing agent, converting primary amines to imines (Fig. 1) which are further hydrolyzed nonenzymatically to aldehydes and ammonia.45 The rate limiting step of oxidation is the cleavage of the α-C–H bond adjacent to the amino group of the substrate leading to the transfer of hydrogen atom to the N5 atom of the flavin ring (Fig. 1). The mechanism of this step is still debated,47,57–63 but quantum calculations give strong evidence in favor of the hydride transfer mechanism, i.e. the hydrogen atom most likely migrates to the flavin ring as an H− entity.43 A very recent 13C NMR isotope effect study provides experimental evidence that the same mechanism is operational in a related polyamine oxidase enzyme.64 Since many enzymes catalyze the cleavage of C–H bonds, the presently studied reaction may be regarded as benchmark for an entire class of enzymes. The published computational experience on MAO includes mechanistic studies based on quantum treatment of cluster models embedded in an implicit solvent,43,65–67 and large-scale QM/MM treatments68 as well as a two-layer ONIOM approach combining DFT and semiempirical methods.59,63 In contrast, our recent work on MAO kinetics25,28,42 uses the EVB approach which, while retaining reasonable accuracy, allows for significantly better thermal averaging than other QM/MM techniques.
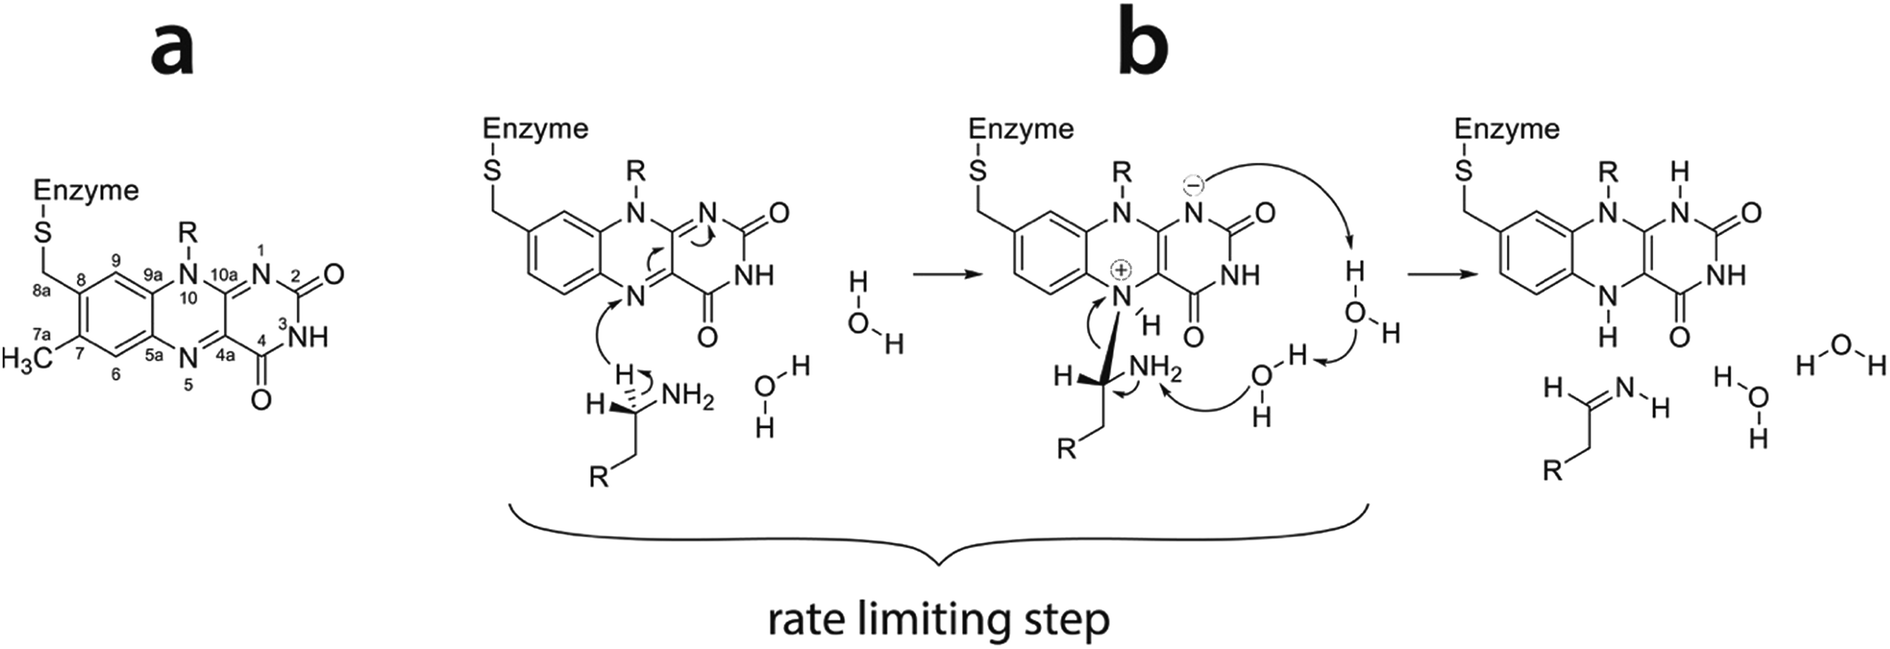 | ||
| Fig. 1 (a) Flavin moiety of FAD and atomic labels; (b) amine oxidation reaction scheme following the hydride transfer mechanism with the rate limiting step indicated (reproduced from ref. 43). | ||
To a great extent this work relies on the methodology and models used in our recent EVB study of the point mutation effect on PEA oxidation by MAO A.28 The model was proved to be reliable and correct by delivering accurate prediction of the increase in the free energy barrier for the rate limiting step on mutating one of the residues that was in an excellent match with experimental observations.69 However, the sampling issue related to restraints was not examined, although it was noticed. The reference reaction problem was largely circumvented, because rather than using the reaction in the gas phase or aqueous solution (as is normally the case), we chose the reaction in the wild type enzyme as reference for the calibration of EVB parameters. We were able to do so because our research focused specifically on the enzyme mutation effect and because good experimental data exists for the selected reference reaction.69 However, such a choice is not very common.
Since virtually all properties of chemical systems, including reaction dynamics, are governed by the potential energy surface, it can be assumed that convergence of reaction simulation is critically dependent on the complexity of the surface, possibly resulting in quite different simulation lengths for different reactions. While this aspect can already be elucidated by using restraints, thereby reducing the complexity of the surface and possibly achieving convergence with shorter simulations, it is reasonable to impose the same investigation on another reaction. We chose a bimolecular nucleophilic substitution (SN2 reaction), namely halogen exchange between hexyl bromide and chloride ion proceeding through a bimolecular transition state structure, as shown in Fig. 2. This is an elementary SN2 reaction, and reactions of this kind are routinely described in organic chemistry textbooks;70,71 they have also been elucidated by simulations72–76 and used for educative purpose.77,78 Although this reaction does not occur in enzymes in identical form, it is a good prototype of many enzymatic reactions that proceed by the SN2 mechanism. An interesting class of such reactions is the conversion of haloalkanes to alcohols catalyzed by haloalkane dehalogenase enzymes;79,80 these reactions have significant impact on environmental chemistry in efforts to reduce pollution caused by halogenated compounds.81 Evidently, the potential energy surface of this SN2 reaction is likely to be noticeably simpler than the one mainly focused by the present study, hence we expect the convergence of EVB free energy profiles would be achieved faster.
 | ||
| Fig. 2 Scheme of halogen exchange reaction between hexyl bromide and chloride ion proceeding by the SN2 mechanism. | ||
Summarizing the above outlined issues, this work addresses the following questions: (1) at what timescales the free energy profiles acquired from gas phase EVB simulations converge, i.e. become independent of initial conditions; (2) how these requirements vary with different reactions or with restrained simulations; (3) which factors critically determine the sampling quality and thus the convergence; (4) what is the inherent conformational freedom between the reacting molecules and how is this freedom limited by the enzyme; (5) what is the role of restraints commonly used in simulations of related reactions in the enzyme; (6) in the context of EVB, are the restrained and unrestrained gas phase simulations mechanistically equivalent and, when used as reference for the investigated enzymatic reaction, what impact has the use or omission of restraints in the gas phase simulations on the resulting free energy profiles in the enzyme.
2. EVB simulations
The EVB methodology encompasses quantum treatment of a reacting system embedded in a classical environment (solvent, enzyme active center). In essence EVB belongs to the group of multiscale QM/MM methods. However, in contrast to most of the popular techniques, the peculiarity of EVB is in that it uses quantum principles on empirical valence states rather than on the electronic structure. Consequently, EVB benefits of high efficiency whilst retaining accuracy, albeit at the expense of not including explicitly the electron density. For a thorough overview of EVB, the reader is referred to ref. 29 and to our recent work for an example of using EVB in a similar context.28The two-state EVB Hamiltonian assumes the form of a 2 × 2 matrix, with the diagonal elements denoted as H11 and H22 representing the classical Hamiltonians of valence states of reactants and products, respectively, and the off-diagonal term H12 representing the quantum coupling between the states. In this work H12 has been simplified to a constant, which is common in EVB calculations. The ground state EVB free energy (Eg) is derived from the secular equation pertinent to the Hamiltonian, yielding the expression:
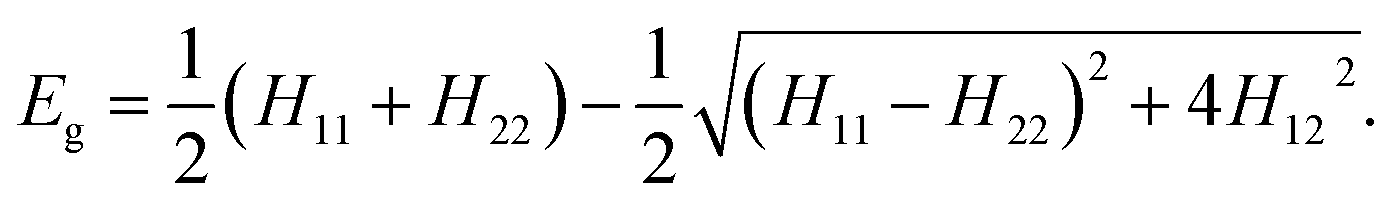 | (1) |
While H11 and H22 are pre-determined by the respective force fields, H12 must be determined empirically. Additionally, the potentials defining H11 and H22 need to be brought to the common origin, because the reactant and product state typically have different heats of formation. By convention, this is achieved by adding an empirical constant named origin shift (α02) to the Hamiltonian representative of products, i.e., in addition to the common force field terms the formulation of H22 also includes the origin shift.
The values of H12 and α02 are typically obtained by calibration using a reference reaction. The reference reaction is usually simulated in the gas phase or in aqueous solution, but the only prerequisite for the reference reaction is that it proceeds by the same mechanism as the investigated reaction, and that its barrier and free energy are known in advance – either measured experimentally or determined by quantum calculations. Calibration is a fitting procedure in which the parameters H12 and α02 are tuned such that the barrier and reaction free energy of the computed Eg profile match the reference values. It is also possible to run the simulation of a reference reaction in parallel batches yielding several free energy profiles and use the match of the average barrier and average free energy as the fitting criterion; this was also the case in the present work. The calibrated EVB parameters can then be used with simulations of the same reaction in any medium (e.g., in the enzyme), yielding free energy profiles. It is postulated that the EVB parameters of a given reaction are independent of the environment, but the mechanism should remain unchanged. This aspect will be investigated and discussed below.
The common practice of EVB simulations of enzymatic reactions is that the simulations are performed in batches of several (typically 10) independent runs (replicas) generated by randomization of initial velocities, and in that the conformational flexibility of the reacting moiety is limited by position restraints. In line with the performance of the employed simulation packages, the simulation length is usually of the order of a few nanoseconds. The resulting free energy profiles obtained from the replicas typically differ by up to 1 kcal mol−1 in the barrier region,28,82 which is usually considered to be satisfactory. When the restraints are omitted, deviations between the profiles become several times larger and the profiles become noisy, indicating sampling and timescale issues. By restraining the reacting moiety and computing the free energy profiles from several independent simulations with slightly different initial conditions, the profiles become appreciably smooth and similar to one another in reasonably short time, but within an arbitrarily confined phase space.
3. Computational details
The setup of the model was essentially the same as in our recently published work,28 except that the present work uses a truncated version of the FAD prosthetic group, namely lumiflavin (LFN), and that all the simulations were done in the absence of solvated protein. The classical model consisted of two states, namely reactants (LFN and PEA) and products (semi-reduced LFN and PEA with hydride ion abstracted). The simulations utilized the OPLS-AA force filed83–85 and were performed in a spherical cell with a radius of 20 Å centered at the flavin N5 atom (Fig. 1a). The parameters were acquired by the ffld_server utility assisted by the Maestro v. 9.7 graphical interface.86 The force field of both states was tuned to support reactivity; among the rest, the breaking of the C–H bond and the formation of the N–H bond was facilitated by replacing the corresponding harmonic bond stretching potentials by Morse functions, and the Lennard–Jones potential was replaced by a less proximity-prohibitive Buckingham-type potential (“soft-core repulsion”) on the reacting C⋯H and N⋯H atom pairs. The atomic charges were determined by fitting to the electrostatic potential (RESP scheme) computed by quantum calculations at the HF/6-31G(d) level of theory using Gaussian09 package.87 Inputs for quantum calculations were generated by the AmberTools15 package.88 The reader is referred to ref. 28 for further details about the model. All the simulations were performed by the qdyn module of the program package Q v.5.89The reaction phase space was sampled by the free energy perturbation (FEP) approach using the Hamiltonian H(λ) constructed from the Hamiltonians representing the state of reactants (H11) and products (H22) using the coupling parameter λ:
| H(λ) = λH11 + (1 − λ)H22. | (2) |
The simulation proceeded in a series of 101 consecutive molecular dynamics (MD) simulations (named FEP steps) in which λ was changed from 1 (reactants) to 0 (products) in 0.01 steps. In other words, at each successive FEP step the Hamiltonian lost 1% character of reactants and gained 1% character of products. The total simulation length was controlled by duration of the individual FEP steps that ranged between 100 ps and 100 ns, resulting in 10.1 ns to 10.1 μs of total simulation time. When necessary, extended sampling was performed in the transition state region, prolonging selected FEP steps up to 2 μs and the total simulation length up to 22 μs. All reaction simulations were performed in batches of 16 independent runs (“replicas”). Starting from the common initial structure, the velocities were randomized and for each replica the system was equilibrated for 1 ns before proceeding with FEP simulation, ensuring that any correlation between the replicas disappeared.
The role of restraints as a tool controlling the reaction path sampling was examined by using two simulation strategies, namely ‘unrestrained’ and ‘restrained’. Both strategies included three-point position restraints involving ring atom C8 and C-atoms of methyl groups bound to C7 and C8 to prevent the system from gaining rotational kinetic energy at the expense of internal degrees of freedom. Otherwise, for unrestrained simulations, only a light α-C⋯N5 distance restraint with a harmonic force constant of 0.5 kcal (mol Å2)−1 was retained for PEA⋯LFN separations exceeding 8 Å, in order to prevent the complex from disintegrating due to thermal motion. These restraints do not limit the possibility to explore the entire phase space relevant for the reaction, hence the term ‘unrestrained’. For restrained simulations, position and distance restraints were used to ensure torsional rigidity between the reacting molecules, exactly as was done for simulations in the enzyme.28 Position restraints with a force constant of 0.5 kcal (mol Å2)−1 were imposed on all heavy atoms, and the molecules were kept in a reaction-plausible orientation by the C⋯N5 and H⋯N5 distances restrained with a force constant of 5 kcal (mol Å2)−1 for values above 3 and 2 Å, respectively.
Simulations of the halogen exchange SN2 reaction (Fig. 2) were prepared and executed in the same way as with the reaction between PEA and LFN, using the same procedures. The three-point restraint preventing the system form gaining excessive angular momentum was imposed on hydrogen atoms bound to three different carbons of the hexyl chain most distant from the reactive carbon. In addition, light restraint with a force constant of 0.5 kcal mol−1 was imposed on C⋯Br and C⋯Cl distances greater than 5 Å. The duration of FEP simulations was between 101 ps (101 × 1 ps) and 1.01 μs (101 × 10 ns).
The EVB reaction profiles were extracted from the simulation energy data by the qfep module of the Q package.89 As this work is focused on the efficiency of reaction path sampling, only calibration of EVB parameters was performed, yielding the coupling term of the EVB Hamiltonian (H12) and the relative shift between the two states (α02). The reference values of the barrier and reaction energy (31.4 and 25.0 kcal mol−1, respectively, for the reaction between PEA and LFN) targeted by EVB calibration were obtained by gas-phase M06-2X/6-31+G(d,p) optimization of entities corresponding to reactants, products and the transition state by using standard protocols implemented in the Gaussian09 program.87 The reference barrier and reaction energy for the SN2 reaction were calculated to 15.61 and −3.01 kcal mol−1, respectively. The procedures related to FEP simulations and calibration of EVB parameters were facilitated by scripts written by Miha Purg.28
4. Results and discussion
4.1. Unrestrained simulations: convergence of free energy profiles
Simulation free of restraints allows the reacting system to fully explore the reaction phase space, including torsional alignment between the reacting molecules. We monitored the convergence of free energy profiles with the increasing simulation length. Fig. 3 displays the free energy profiles obtained from simulations of different length (10.1 ns to 22 μs) after calibrating the EVB parameters to the reference values of 31.4 and 25.0 kcal mol−1 for the barrier and reaction energy, respectively. Standard deviations of the barrier and reaction free energy are summarized in Table 1. Please note that all the displayed profiles have exactly the same average value of barrier and reaction free energy. Also note that the reaction coordinate is represented by the energy gap between the Hamiltonians defined as ε = H11 − H12. This formulation facilitates efficient mapping of the multidimensional free energy surface onto a single coordinate and has been routinely used with the EVB methodology. | ||
| Fig. 3 Free energy profiles obtained from unrestrained simulations of different length. The transition state region is magnified in the inset. | ||
| FEP steps | Total length | H12 [kcal mol−1] | α02 [kcal mol−1] | σ‡ [kcal mol−1] | σR [kcal mol−1] | λ at TS |
|---|---|---|---|---|---|---|
| Unrestrained simulations | ||||||
| 101 × 100 ps | 10.1 ns | 66.45 | 108.76 | 0.47 | 1.03 | 0.28–0.32 |
| 101 × 1 ns | 101 ns | 70.09 | 111.89 | 0.24 | 0.75 | 0.31–0.34 |
| 101 × 10 ns | 1.01 μs | 72.92 | 114.38 | 0.19 | 0.63 | 0.33–0.35 |
| 101 × 100 ns | 10.1 μs | 74.15 | 116.07 | 0.22 | 0.42 | 0.34–0.36 |
| 101 × 100 ns + 2 μs at λ = 0.36 | 12 μs | 74.78 | 116.22 | 0.03 | 0.30 | 0.36 |
| 101 × 100 ns + 12 μs at λ = 0.32–0.37 | 22 μs | 75.18 | 116.87 | 0.07 | 0.09 | 0.35–0.36 |
![[thin space (1/6-em)]](https://www.rsc.org/images/entities/char_2009.gif) |
||||||
| Restrained simulations | ||||||
| 101 × 100 ps | 10.1 ns | 81.45 | 108.47 | 0.66 | 1.69 | 0.38–0.44 |
| 101 × 1 ns | 101 ns | 81.99 | 110.11 | 0.52 | 1.00 | 0.39–0.43 |
| 101 × 10 ns | 1.01 μs | 83.07 | 111.66 | 0.14 | 0.25 | 0.40–0.42 |
With the increasing simulation time, differences between profiles within the batch diminish (Fig. 3a–f), indicating that the reaction pathway sampling approaches completion. Yet, not all the areas of the profile converge at the same pace. While in large part the profiles become indistinguishable from one another much earlier, at latest with the 1.01 μs simulation (Fig. 3c), noticeable difference in the transition state region persists even with 10 times longer simulation (Fig. 3d), the standard deviation in the barrier being around 0.2 kcal mol−1 (Table 1). Evidently, all the difference between the replicas builds up in the close vicinity of the transition state, which is trivially demonstrated by shifting the common point of the profiles from reactants to products (Fig. 4).
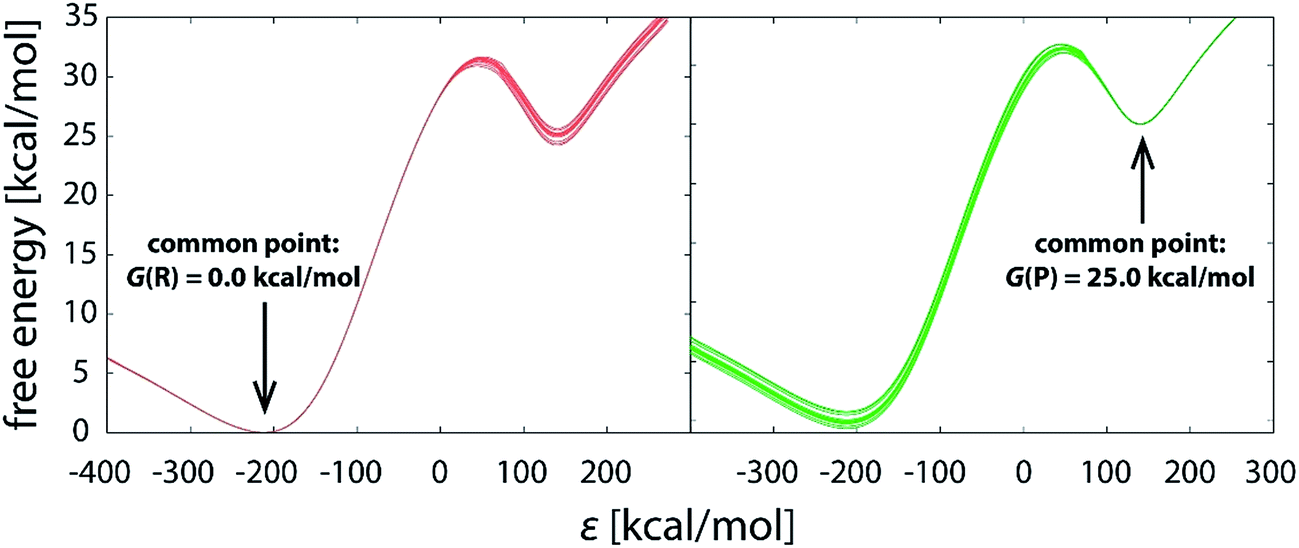 | ||
| Fig. 4 Reaction profiles of the same 10.1 μs (101 × 100 ns) batch of simulations, with the profiles brought to the common origin either in the well of reactants (left) or products (right). | ||
The persistent difference between the profiles (Fig. 3a–d) indicates that the reaction path sampling in the transition state region is insufficient. Perhaps the most illustrative insight into the transition state sampling issue is provided by the sampling statistics along the profile displayed in Fig. 5. During a FEP simulation, for each value of λ a part of the reaction coordinate (reflected in adjacent intervals on the discretized ε-axis) is sampled and the number of counts for each interval (bin) on the ε-axis is recorded; the counts are then converted into the EVB free energy profile according to the postulates of the FEP approach and the fundamental expression of EVB ground state energy (eqn (1)). The bits of the phase space sampled at subsequent values of λ largely overlap, and the coverage is fairly good along most of the profile, reflected in several thousands (or tens of thousands) of counts at almost all values of ε. However, there is an exception in that the sampling statistics is noticeably poorer in the TS region, as can be seen as a “gap” in the number of counts at ε ≈ 50 kcal mol−1. The TS region features about two orders of magnitude smaller number of counts than the rest of the profile, implying an order of magnitude larger statistical noise. Thus, in order to ensure convergence of profiles in the transition state region, extended sampling is in the first place required for the values of λ that contribute mainly to the transition state. For the 101 × 100 ns simulation (Fig. 3d), the transition state is sampled at λ-values between 0.32 and 0.37, with the largest contribution at λ = 0.36. As we extend the simulation time at λ = 0.36 from 100 ns to 2 μs, the profiles become virtually indistinguishable in the transition state (Fig. 3e) and the standard deviation of the barrier nearly diminishes (0.03 kcal mol−1, Table 1). However, deviations between profiles past the transition state persiss, resulting in barely reduced standard deviation of the reaction free energy (0.30 kcal mol−1, Table 1). But when the extended 2 μs sampling is also used with λ-values of 0.32, 0.33, 0.34, 0.35 and 0.37 (additional 12 μs of simulation altogether, Fig. 3f and Table 1), the profiles become reasonably converged along the entire reaction pathway. At that point the replicas effectively collapse into one single profile. The sampling of the pathway in parallel replicas, as is commonly done in enzymes, becomes irrelevant.
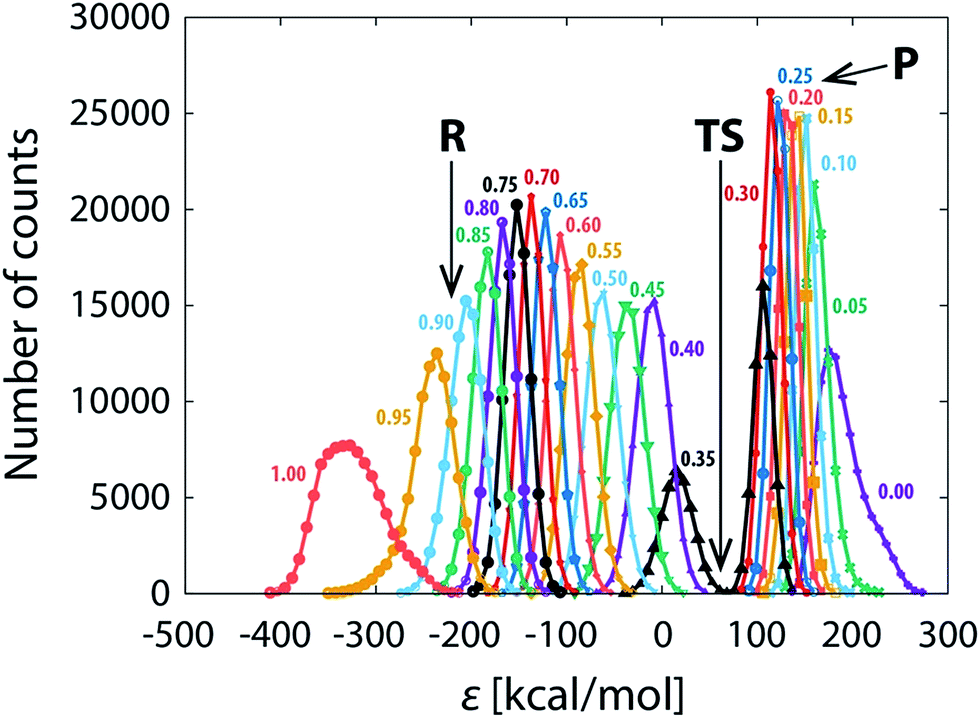 | ||
| Fig. 5 Sampling statistics for a FEP simulation (101 × 100 ns), given as the number of counts along the discretized (binned) reaction coordinate for different (indicated) values of λ. Regions pertaining to reactants (R), transition state (TS) and products (P) are indicated. Note that only every fifth profile is displayed (λ = 1.00, 0.95, 0.90, …) for the sake of clarity. | ||
In support of the above discussion, standard deviations characterizing the diversity of profiles are listed in Table 1. The average barrier reaches precision of ∼0.2 kcal mol−1 already at 101 ns simulation, but microseconds of extended sampling are needed in order to bring the deviation below 0.1 kcal mol−1. Such precision standards are much tighter than those of enzyme simulations (typically 0.5 kcal mol−1),25,28 but one should note that the typical precision of kinetic measurements converts into a ∼0.1 kcal mol−1 precision in the barrier due to the exponential relation between the barrier and the rate constant. For that sake it is difficult to reproduce the experimental precision by simulations.
In the context of reaction kinetics most often targeted by such simulations, deviations in the reaction free energy are much less important, even more so due to the fact that in the cascade of reactions only the rate limiting step has been considered and no experimental data is available on thermodynamics of that particular step. In addition, uncertainties in the reaction free energy have been proved to have negligible effect on the computed barrier.28
With prolonging simulation time, the maximum of the profiles gradually shifts to the left (smaller value of ε), which can be tentatively seen in the insets of Fig. 3. An equivalent measure is the value of λ with largest contribution to the transition state listed in Table 1. With longer simulations the value increases, meaning that the transition state occurs earlier. This is reasonable, because longer simulation ensures better relaxation at each FEP step, therefore the system is sooner ‘prepared’ for the oncoming crossing of the barrier.
The transition state sampling issue appears to be the key to the acquisition of fully converged reaction profiles. But why is the sampling of the transition state so significantly poorer? In order to answer this question, one needs to address geometric aspects.
4.2. Geometric aspects and relation to convergence
Simulations free of restraints allow the PEA and LFN molecule to assume a myriad of different mutual orientations. The torsional flexibility of the complex is very high, particularly in or near the state of reactants where the PEA molecule almost freely orbits all the area around LFN (see also Fig. 9). Approaching the transition state, the flexibility is reduced, as the α-carbon atom of PEA prefers to reside close to the plane of LFN rings, facilitating the hydride ion to be in-plane transferred to LFN from underneath N5. At the same time, fluctuations in interatomic distances are reduced, as well as torsional flexibility (Fig. 9). The profiles of interatomic distances directly involved in the reaction (Fig. 6), namely the C⋯H distance (breaking bond), the N⋯H distance (forming bond) and the donor–acceptor C⋯N separation reveal a peculiar feature, namely an abrupt jump in the C⋯H and C⋯N distance which always occurs at the value of λ pertaining to the transition state and is accomplished in less than 3 picoseconds.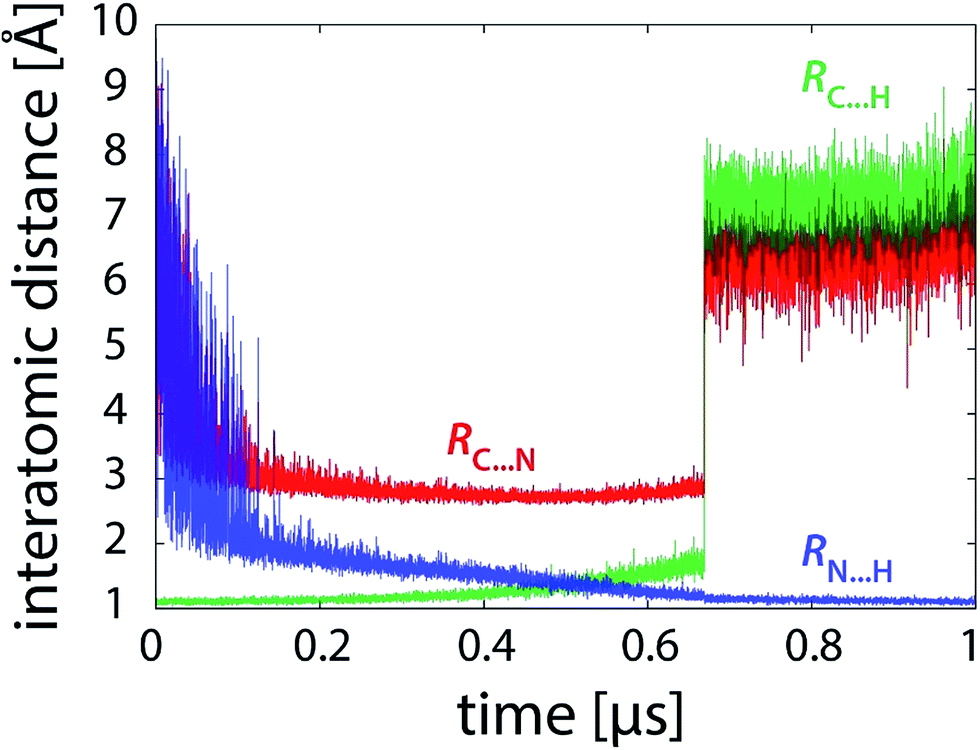 | ||
| Fig. 6 Profiles of characteristic interatomic distances during the reaction (101 × 10 ns unrestrained FEP simulation). | ||
What is the driving force for such a jump? It appears to be related to the rearrangement of hydrogen bonding involving the NH2 group of PEA as donor and either of the two ring C![[double bond, length as m-dash]](https://www.rsc.org/images/entities/char_e001.gif) O groups of LFN as acceptor, as shown in snapshot structures in Fig. 7 and in distance profiles in Fig. 8. With the only exception of the first ∼10% of the simulation, the NH2 group of PEA is for most of the time involved in a moderate hydrogen bond to either the C4O (HB1) or the C2O (HB2) ring carbonyl group. The swap between HB1 and HB2 occurs simultaneously with the abrupt jump in distances directly involved in the reaction (Fig. 6) just at the transition state.
O groups of LFN as acceptor, as shown in snapshot structures in Fig. 7 and in distance profiles in Fig. 8. With the only exception of the first ∼10% of the simulation, the NH2 group of PEA is for most of the time involved in a moderate hydrogen bond to either the C4O (HB1) or the C2O (HB2) ring carbonyl group. The swap between HB1 and HB2 occurs simultaneously with the abrupt jump in distances directly involved in the reaction (Fig. 6) just at the transition state.
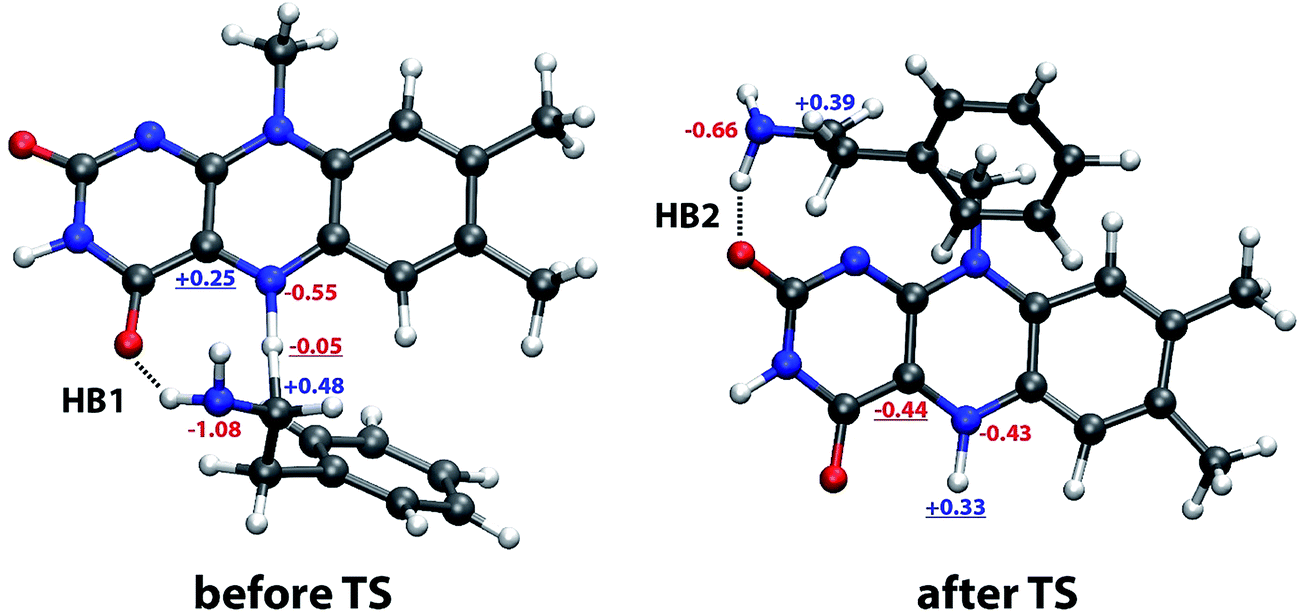 | ||
| Fig. 7 Typical snapshot structures before and after transition state involving two distinct sites stabilizing the complex by a hydrogen bond formed by the NH2 group of phenylethylamine and one of the CO groups of lumiflavin (HB1, before TS) and to the C2O group (HB2, after TS), with selected atomic charges in the reactant (left) and product state (right). The most relevant charges for the observed change in the structure are underlined. See Fig. 1 for atomic labels. | ||
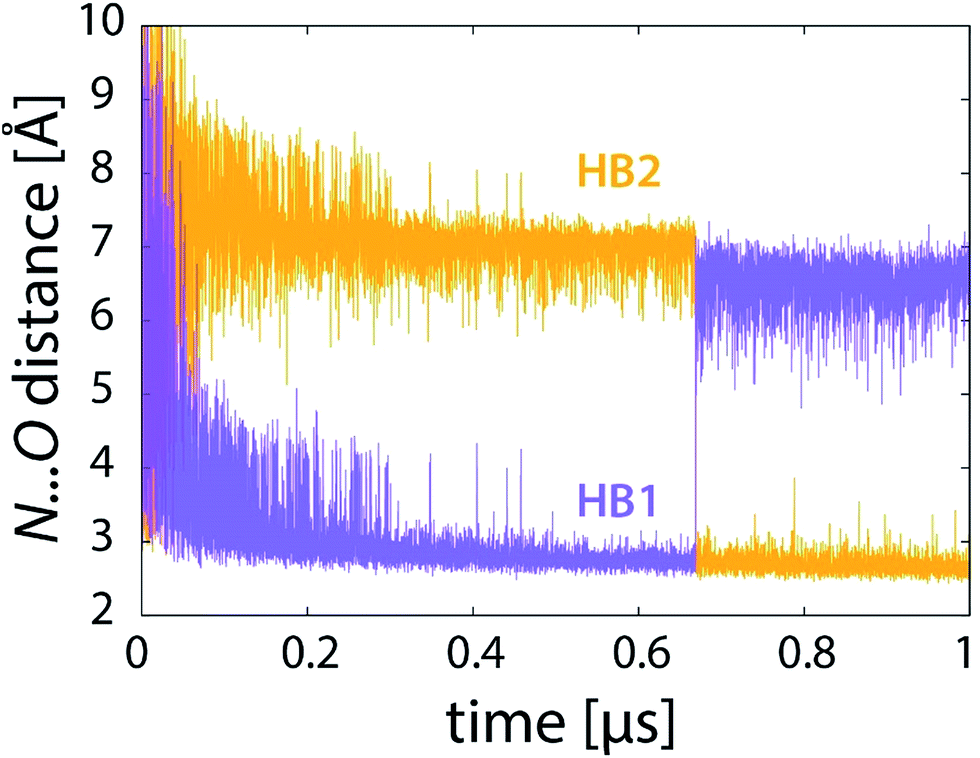 | ||
| Fig. 8 Profiles of donor⋯acceptor distances of the two hydrogen bonds (see Fig. 7) during the reaction (101 × 10 ns unrestrained FEP simulation). | ||
The reason for the abrupt change can be found in the changed charges of the involved atoms on passing from the reactant to the product state (Fig. 7). The most significant among these are (i) the largely positive charge built on the transferred hydrogen (from −0.05 to +0.33) resulting in repulsion with the α-carbon atom of PEA, and (ii) the even larger change on the C4a atom (from +0.25 to −0.44), switching the interaction with the negatively charged N atom of PEA from significantly attractive to significantly repulsive. Both these changes synergistically render the location of PEA near the reacting N5 atom of LFN unfavorable, resulting in a shift of the PEA molecule to the vicinity of the C2O group, thereby switching from HB1 to HB2.
But how is this feature linked to the transition state sampling issue? The point is that with all FEP simulations up to 10 nanoseconds per FEP step (101 × 10 ns), this large change in geometry is observed only once in each simulation trajectory – in other words, once PEA switches from one hydrogen-bond-stabilized site to another, it does not switch back. Consequently, the change is effectively irreversible and the statistics of the transition is poor. For proper statistics it is essential that this event occurs several times (i.e., several jumps there and back). Our observation shows that the aforementioned abrupt geometry change is reversible on a timescale of tens of nanoseconds, hence occurring more than once with FEP simulation of at least 100 nanoseconds per FEP step. For instance, with 100 ns of sampling at fixed λ two or three such events are observed, which is still not sufficient (see Fig. 3d). With the sampling extended by 2–12 microseconds in the transition state region, the number of events increases to at least a few dozen, resulting in improved statistics and convergent free energy profiles (Fig. 3e and f).
The timescale required for complete sampling (microseconds of simulation) is quite long. At present it is not clear if this is a general feature inherent to this class of chemical reactions, or it is rather determined by specific factors or even by characteristics of the force field. A thorough examination of these features is beyond the scope of the present work, but it remains clear that conformational fluctuations have noticeable effect on the free energy profile, and that considerable computational power may be required to reach full convergence.
4.3. Restrained simulations
In an attempt to drive the reaction geometrically in the same way as within the enzyme, the same scheme of position and distance restraints was applied as in our recent study of PEA oxidation by MAO A.28 The restraints prevent sizable fluctuations of the torsional alignment between PEA and LFN.Fig. 9 shows the profile of one of the coordinates characterizing the torsional alignment between PEA and LFN for various types of simulation. Despite minor difference between the profiles of restrained simulation in the enzyme and in the gas phase, the restrained simulation in the gas phase is geometrically much more similar to the one within the enzyme than to the unrestrained simulation in the gas phase. The torsional amplitudes of restrained simulations are several times smaller than with simulation free of restraints. The same also holds for other intermolecular degrees of freedom not shown presently. Therefore, the restrained gas phase simulation of the reaction is in a very good geometric match with the one in the enzyme, but quite different from the unrestrained one in the free space. The difference is well reflected in the profile of interatomic distances involved in the reaction, displayed in Fig. 10 (to be compared with Fig. 6).
 | ||
| Fig. 9 Profiles of torsional offset of the α-carbon atom of PEA from the plane of LFN rings during the FEP simulation in the gas phase (unrestrained and restrained) and within the MAO A enzyme.28 | ||
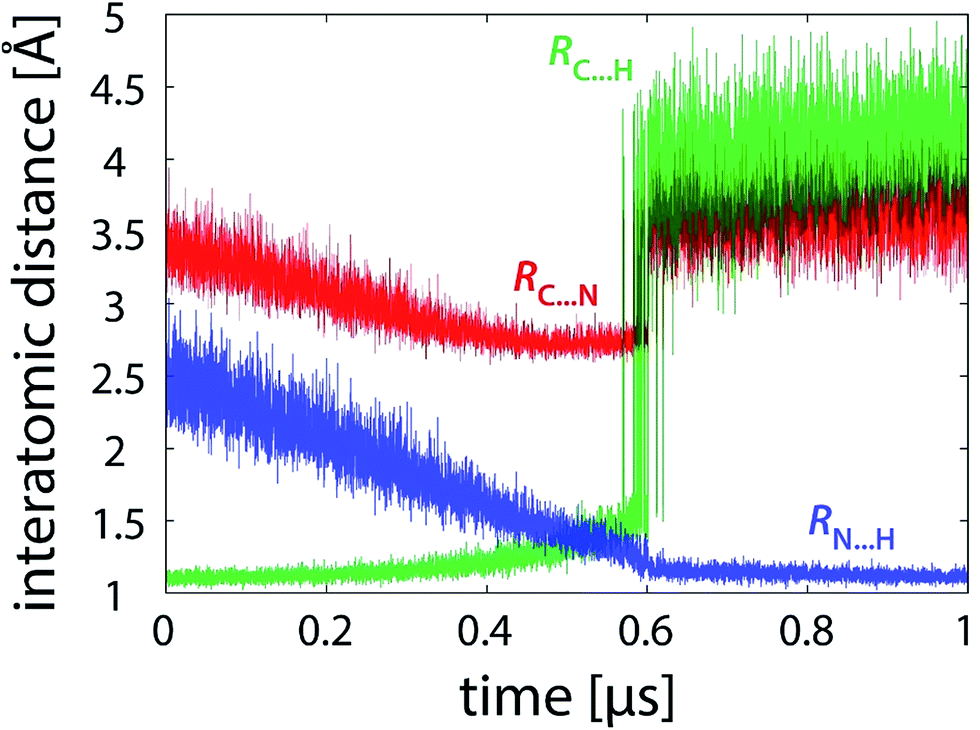 | ||
| Fig. 10 Profiles of characteristic interatomic distances during the reaction (101 × 10 ns restrained FEP simulation). | ||
The geometry change is still quite abrupt near the transition state, but it is less pronounced than in the unrestrained simulations. The magnitude of the C⋯H and C⋯N distance jump is smaller due to restraints, and reversibility of the jump is established on a roughly 10 times shorter timescale than in the unrestrained simulations, i.e. in nanoseconds rather than in tens of nanoseconds. Consequently, the restrained 101 × 10 ns simulation features better sampling of the transition state region, and the resulting barrier deviation between the replicas is somewhat smaller than in the unrestrained simulation of the same length (Table 1). While the same driving force is responsible for the geometry shift, the restraints largely prevent hydrogen bonds HB1 and HB2 from being formed, thereby reducing their contribution to the reaction pathway. Also, due to restraints the transition state occurs earlier than with unrestrained simulations. The corresponding transition state values of λ (Table 1) are by 0.06–0.08 larger for the former. The restraints enforce the α-CH group of PEA to be permanently oriented towards N5 of LFN (consistent with the earlier crossing of the barrier), but the system is prevented from fully relaxing to the optimal pathway.
4.4. Calibrated EVB parameters and validation on an enzyme reaction
Apart from geometric aspect, the difference between the pathways taken by unrestrained and restrained simulations is also reflected in the EVB parameters calibrated for each particular batch of simulations. In Table 1 the coupling constant H12 and the relative shift α02 are listed for each of the simulations performed in this work. The values differ significantly between the simulation strategies. For both unrestrained and restrained simulation the values of H12 and α02 increase with the elongating simulation time. The increasing tendency is more pronounced with unrestrained simulations, possibly due to the more complex phase space needed to be sampled, indicating that the shorter unrestrained simulations are still far from convergence. In contrast to that, in restrained simulations the confined phase space ensures somewhat faster convergence of H12 and α02. The computed free energy profiles of the unrestrained and restrained simulation are perceivably different (Fig. 11), confirming that the reaction pathways – and thus the mechanisms, as demonstrated below – are not equivalent.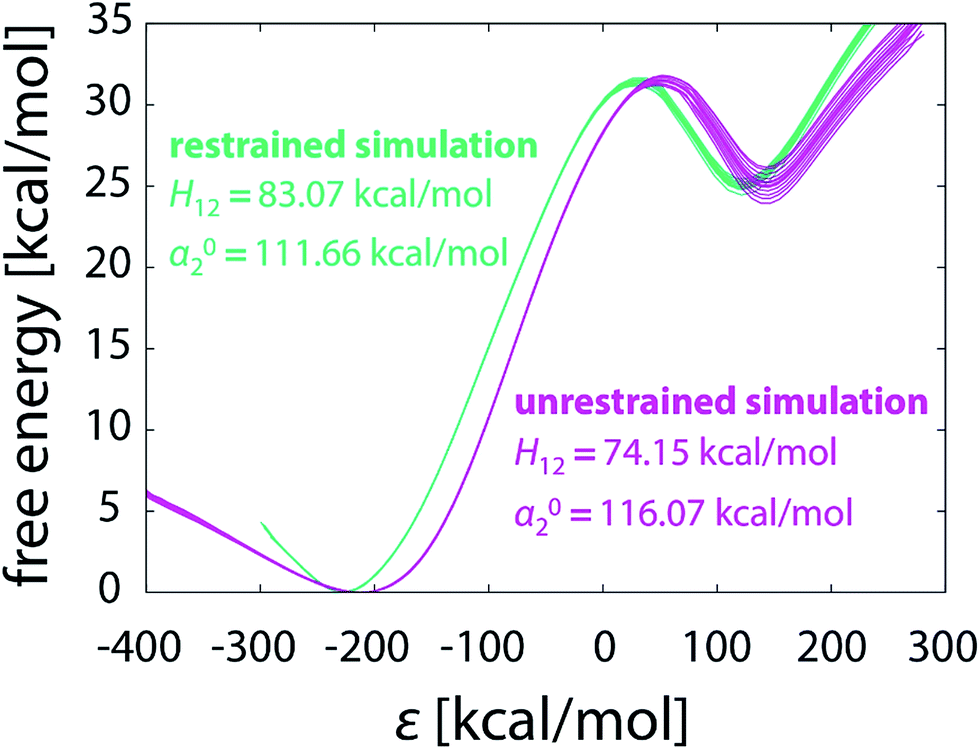 | ||
| Fig. 11 Free energy profiles obtained from unrestrained and restrained simulations, both in batch of sixteen 101 × 10 ns FEP runs. | ||
All EVB simulations are based on a pre-determined reaction mechanism defined by the force field and atomic charges of reactants and products. In this work the simulations are based on the postulated hydride transfer mechanism43 that has been thoroughly tested and validated on various examples.25,28,42 Fig. 11 already suggests that the reaction can proceed in a noticeably different manner depending on the use of restraints, but it can be further deducted that the mechanisms of unrestrained and restrained simulations are not the same. The EVB parameters calibrated by either simulation strategy in the gas phase (see the values in Fig. 11 and Table 1) were used for the calculation of free energy profiles of the same reaction embedded in the enzyme active site. We took the FEP simulation of our recent study28 consisting of 51 × 100 ps steps and computed the barrier with either set of parameters. This is an example of a routine EVB calculation, relying on the postulate that the EVB parameters for a reaction are independent of the surroundings and therefore transferrable between various types of media.29 However, the prerequisite for transferability is that the reaction in the medium of interest proceeds by exactly the same mechanism as in the medium where its EVB parameters were calibrated. The concept of catalysis, as defined by Warshel, also requires the identity of mechanisms between the catalyzed and reference reaction.29
The values of H12 and α02 derived from unrestrained and restrained simulation yield remarkably different free energy barrier for the reaction within the enzyme (24.26 and 19.07 kcal mol−1, respectively; see Table 2). This difference is several times larger than the precision at which the barrier is computed (∼0.5 kcal mol−1), and is large enough to invoke the issue whether the catalytic function of the enzyme has been properly reproduced in the case of unrestrained simulation of the reference reaction. Namely, while the barrier of 19.07 kcal mol−1 derived from restrained reference reaction (albeit not corrected for PEA deprotonation) is in reasonable agreement with the experimental value of 18.57 kcal mol−1,69 the use of unrestrained simulation as reference yields a highly overestimated barrier of 24.26 kcal mol−1 for the reaction in the enzyme. This discrepancy can be ascribed to the mismatch of mechanisms between the reference and enzymatic reaction: although the mechanisms are equivalent in terms of electronic effects, they differ in the conformational aspect controlled by restraints. The difference spans beyond the effects related to fine tuning of simulation parameters (e.g., number of steps) that typically shift the barrier by less than 1 kcal mol−1.28 Therefore, for a treatment of restrained reaction simulation in the enzyme, restrained simulation of the reference reaction in the gas phase works much better than the unrestrained one, despite that the latter evidently samples the reaction phase space better (more completely). Importantly, the similarity between simulations in different phases appears to be more decisive than the completeness of sampling. This implies that the requirement of identical mechanism for transferability of EVB parameters also includes conformational aspects, suggesting that that identical (or as similar as possible) restraints should be used in all types of environment. Consequently, the reasoning that the unrestrained and restrained simulation correspond to different mechanisms is justified, instructing cautious setup of the simulations.
| Strategy | H12 [kcal mol−1] | α02 [kcal mol−1] | ΔG‡ [kcal mol−1] |
|---|---|---|---|
| Unrestrained | 75.18 | 116.87 | 24.26 |
| Restrained | 83.07 | 111.66 | 19.07 |
4.5. SN2 reaction
The use of restraints apparently reduces the required time for convergence of free energy profiles (Section 4.3, Table 1). This can be rationalized by the reduced complexity of the phase space on using restraints, because only a subset of the phase space is available for sampling. As the elementary SN2 reaction between hexylbromide and chloride ion is probably less complex than the reaction between PEA and LFN, one can expect that the free energy profiles will converge even faster. In the same manner as in Table 1, Table 3 lists standard deviations between the replicated simulations for the SN2 reaction.| FEP steps | Total length | H12 [kcal mol−1] | α02 [kcal mol−1] | σ‡ [kcal mol−1] | σR [kcal mol−1] | λ at TS |
|---|---|---|---|---|---|---|
| 101 × 1 ps | 101 ps | 67.98 | 8.27 | 1.38 | 1.46 | 0.48–0.53 |
| 101 × 10 ps | 1.01 ns | 67.37 | 9.44 | 0.29 | 0.40 | 0.49–0.52 |
| 101 × 100 ps | 10.1 ns | 67.06 | 9.42 | 0.09 | 0.09 | 0.49–0.50 |
| 101 × 1 ns | 101 ns | 67.03 | 9.40 | 0.04 | 0.04 | 0.49–0.50 |
| 101 × 10 ns | 1.01 μs | 66.94 | 9.48 | 0.02 | 0.02 | 0.49–0.50 |
Indeed, convergence is attained at a much faster rate. Deviations between replicas in both the barrier and reaction free energy falls below 0.1 kcal mol−1 already with a 10.1 ns simulation – three orders of magnitude faster than with the PEA⋯LFN reaction (Table 1, Fig. 3e and f). With a 1.01 μs simulation, the free energy profiles are essentially indistinguishable (Fig. 12), but even with a two order of magnitude shorter simulation it can be safely concluded that completeness has been reached and that simulations become independent of the initial conditions.
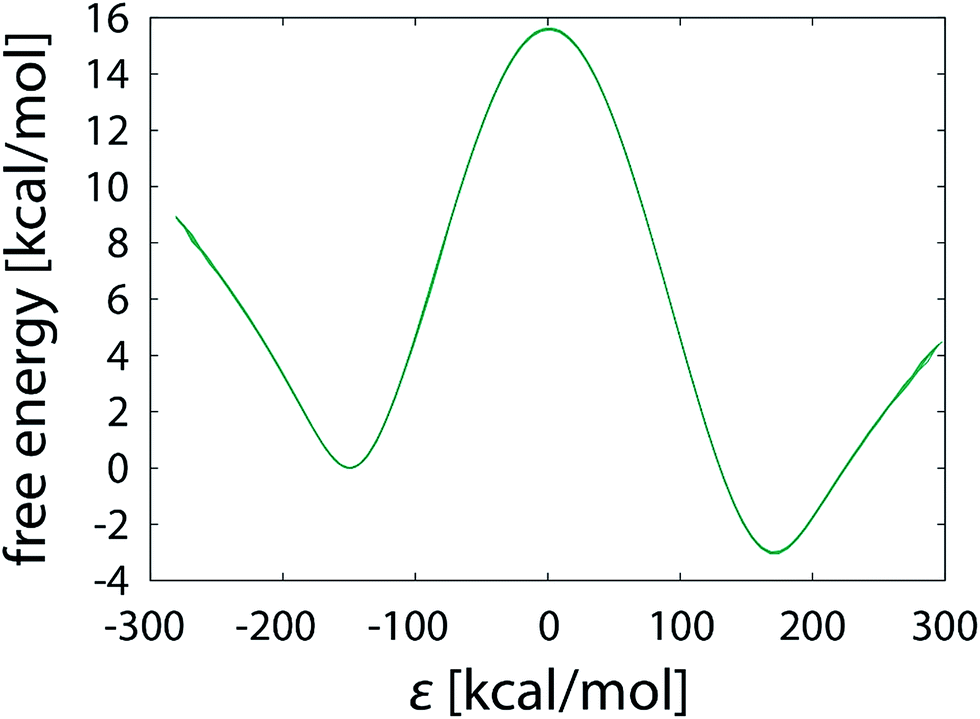 | ||
| Fig. 12 Free energy profiles obtained for the SN2 halogen exchange reaction between hexyl bromide and chloride ion, derived from 1.01 μs FEP simulations. Note that the displayed graph consists of sixteen overlaid profiles. | ||
Evidence supporting faster convergence can also be found in the sampling statistics along the reaction coordinate, in which all the areas are well sampled. Unlike the PEA⋯LFN reaction where a noticeable sampling deficit is observed in the TS region (Fig. 5) the sampling rate around TS is just barely reduced and remains comparable to the other areas, thus avoiding the necessity of extended sampling. This agrees with the assumption that the potential energy surface of the presently studies SN2 reaction is much more simple than the one corresponding to hydride transfer from PEA to LFN.
4.6. What can we learn?
Depending on the use of restraints, the presently studied reaction profiles in the gas phase converge quantitatively on an about microsecond timescale. This includes the complete sampling of the conformational space defined by the alignment of the reacting molecules and assures that the profiles are effectively independent of the initial conditions (differences between them are kept well below 0.1 kcal mol−1). Such precision matches or exceeds most experimental measurements. As was demonstrated by comparison between unrestrained and restrained simulations and by simulation of a benchmark SN2 reaction, the convergence requirements are critically dependent on the complexity of the potential energy surface for the investigated reactions. For the SN2 reaction convergent free energy profiles are obtained with three orders of magnitude shorter simulations.However, at present it is for several reasons difficult to reach such precision with reactions embedded in the fully scaled solvated protein. Firstly, the protein environment imposes barriers to conformational fluctuations already within the reacting moiety, making the sampling of this part of the phase space more difficult than with the isolated system. It is hard to estimate the required timescales, but they are likely to be considerably longer than with the gas phase models. Additionally, the complete sampling should include the conformational degrees of freedom within the protein, which probably requires comparable or longer timescales. Since not much is known about the coordinates or structures involved in these conformational fluctuations, the usage of advanced sampling techniques is dubious. At this point it should be noted that, while the cost of the EVB methodology is in principle comparable to that of classical simulations, the performance of available EVB packages is still somewhat behind the popular codes thoroughly optimized for massive parallelization, use on GPUs, etc., making micro- to millisecond timescales required for the complete sampling prohibitively expensive. Therefore, the common practice of using restraints to confine the phase space of an enzyme reaction, thereby reaching convergence of the profiles to lower but still acceptable precision (∼0.5 kcal mol−1), appears to remain the method of choice.
While at present adaption of the reaction simulation in the enzyme to the one in the gas phase remains a challenge for future studies, doing the other way around, i.e. tuning the reference reaction simulation to the setup of the enzyme simulation, appears to be reasonable. This is possible due to a peculiar convenience of the EVB methodology, namely that the calculation of the free energy profiles is done a posteriori using the statistical data acquired from the simulation. Thus it is not mandatory to run simulation of the reference reaction prior to the simulation in the enzyme, and adaption of simulation of the reference reaction to the one in the enzyme can be done after completing the latter.
We speculate that similar conclusions would have probably been achieved by using the model of aqueous solution instead of the gas phase model, because the disordered aqueous environment most likely allows for comparable conformational flexibility as in the gas phase. However, a reliable solution model is barely any smaller than the model of a solvated protein, requiring several orders of magnitude larger computational times, and is therefore not practical.
This study demonstrates that the optimal setup for the reference reaction in the gas phase includes the same scheme of restraints as used in the enzyme. In such a way, mechanistic equivalence of the reaction in both media is ensured, leading to proper application of EVB principles and meaningful results. All in all, the “ropes over mountains” problem cannot be avoided, but its impact can be reasonably controlled.
5. Conclusions
This work scrutinizes the completeness of sampling and the related convergence of the free energy profile of phenylethylamine oxidation by lumiflavin, a highly relevant biomolecular reaction with numerous applications in clinical neurosciences. The rate limiting step of this reaction is the cleavage of the C–H bond of the substrate, as is common in many enzymatic reactions. The reaction is catalyzed by the monoamine oxidaze enzymes, but simulation of the reaction in the enzymatic environment invokes sampling issues, particularly related to conformational flexibility within the reacting moiety as well as in the enzyme. This problem is inherent to simulations of enzymatic reactions and is not confined to the presently studied system. While at present the complexity of the system does not allow for the complete sampling of the reaction phase space, this can be done for the equivalent reaction in the gas phase. All the free energy calculations in this work were performed by the established Empirical Valence Bond (EVB) methodology coupled with the free energy perturbation sampling technique.We demonstrate that the most critical part of the convergence of the free energy profile is the transition state region, because it features about two orders of magnitude poorer sampling statistics than the rest of the profile. The main reason for this is the abrupt switching between two conformations stabilized by hydrogen bonding that occurs at (or just after) the transition state. Reversibility of this process is achieved on a timescale of tens of nanoseconds, thus requiring microseconds of simulation to provide sufficient statistics and complete the sampling. The use of restraints confining the alignment between the reacting molecules, as is commonly done in the enzyme, reduces the required timescale by about a factor of ten.
Importantly, requirements for convergent simulations can greatly vary between reactions even in the gas phase. We show that convergence is in large part determined by the complexity of the phase space. For instance, a benchmark SN2 reaction that evidently proceeds in a much simpler manner and is essentially free of sampling issues in the transition state region, reaches convergence with three orders of magnitude shorter simulations than the main reaction undertaken in this study.
While the complete sampling can be performed in a reasonable time for the gas phase reaction, resulting in a <0.1 kcal mol−1 precision in the free energy profile, the complexity of the conformational phase space currently prevents from doing so in the enzyme, posing a challenge for implementation of the presently used methodology for the most advanced platforms supporting massive parallelization. At the time being, the strategy relying on restraints remains the method of choice for ensuring limited but satisfactory precision (about 0.5 kcal mol−1) in the computed free energies and barriers. However, this is done at the expense of noticeably shrinking the phase space available for sampling.
By comparing the free energy profiles and the corresponding calibrated EVB parameters of the unrestrained and restrained simulation, it is evident that conformational fluctuations within the reacting moiety make an essential part of the reaction mechanism, hence unrestrained and restrained simulations deliver considerably different results. We demonstrate that a “like-for-like” strategy for the setup of the reference and enzymatic reaction (i.e., using same restraints with both) is optimal. In contrast, the use of unrestrained simulation in the gas phase as reference for the restrained simulation in the enzyme leads to a largely overestimated (by more than 5 kcal mol−1) free energy barrier, essentially failing to qualitatively reproduce catalytic function of the enzyme.
Rather than improving the reaction simulation within the enzyme, this work provides suggestions for improving the simulation of the reference reaction. It should be stressed that the latter is equally important for the proper treatment as the enzymatic reaction itself, hence the present work, apart from providing detailed insight into sampling and mechanistic issues, contributes to improved simulations of higher reliability, still within the constraints determined by complexity.
Acknowledgements
The author is thankful to Janez Mavri for stimulating discussions and critical comments. Miha Purg is ackgnowledged for developing the scripts that greatly simplify preparation, execution and analysis of EVB simulations. This work was supported by the Slovenian Research Agency within the program group funding scheme (P1-0012).References
- P. G. Bolhuis, D. Chandler, C. Dellago and P. L. Geissler, Annu. Rev. Phys. Chem., 2002, 53, 291–318 CrossRef CAS PubMed.
- A. Laio and M. Parrinello, Proc. Natl. Acad. Sci. U. S. A., 2002, 99, 12562–12566 CrossRef CAS PubMed.
- T. Huber, A. E. Torda and W. F. Vangunsteren, J. Comput.-Aided Mol. Des., 1994, 8, 695–708 CrossRef CAS PubMed.
- G. M. Torrie and J. P. Valleau, J. Comput. Phys., 1977, 23, 187–199 CrossRef.
- R. H. Swendsen and J. S. Wang, Phys. Rev. Lett., 1986, 57, 2607–2609 CrossRef PubMed.
- Y. Sugita and Y. Okamoto, Chem. Phys. Lett., 1999, 314, 141–151 CrossRef CAS.
- G. Henkelman, B. P. Uberuaga and H. Jonsson, J. Chem. Phys., 2000, 113, 9901–9904 CrossRef CAS.
- H. L. Woodcock, M. Hodoscek, P. Sherwood, Y. S. Lee, H. F. Schaefer and B. R. Brooks, Theor. Chem. Acc., 2003, 109, 140–148 CrossRef CAS.
- K. Lindorff-Larsen, S. Piana, R. O. Dror and D. E. Shaw, Science, 2011, 334, 517–520 CrossRef CAS PubMed.
- D. E. Shaw, P. Maragakis, K. Lindorff-Larsen, S. Piana, R. O. Dror, M. P. Eastwood, J. A. Bank, J. M. Jumper, J. K. Salmon, Y. B. Shan and W. Wriggers, Science, 2010, 330, 341–346 CrossRef CAS PubMed.
- D. E. ShawAnton: A Specialized Machine for Millisecond-Scale Molecular Dynamics Simulations of Proteins, Proc. 19th IEEE Symp. Computer Arithmetic, 2009, pp. 3 Search PubMed.
- J. P. Grossman, B. Towles, B. Greskamp and D. E. Shaw, Filtering reductions and synchronization in the Anton 2 network, Proc. Int. Par. and Distr. Processing Symp., 2015 Search PubMed.
- J. Juraszek, J. Vreede and P. G. Bolhuis, Chem. Phys., 2012, 396, 30–44 CrossRef CAS.
- A. G. Palmer, Acc. Chem. Res., 2015, 48, 457–465 CrossRef CAS PubMed.
- D. R. Glowacki, J. N. Harvey and A. J. Mulholland, Biochem. Soc. Trans., 2012, 40, 515–521 CrossRef CAS PubMed.
- S. Hay and N. S. Scrutton, Nat. Chem., 2012, 4, 161–168 CrossRef CAS PubMed.
- D. R. Glowacki, J. N. Harvey and A. J. Mulholland, Nat. Chem., 2012, 4, 169–176 CrossRef CAS PubMed.
- K. A. Henzler-Wildman, M. Lei, V. Thai, S. J. Kerns, M. Karplus and D. Kern, Nature, 2007, 450, U913–U927 CrossRef PubMed.
- H. J. Russell, A. R. Jones, S. Hay, G. M. Greetham, M. Towrie and N. S. Scrutton, Angew. Chem., Int. Ed., 2012, 51, 9306–9310 CrossRef CAS PubMed.
- Z. D. Nagel and J. P. Klinman, Nat. Chem. Biol., 2009, 5, 543–550 CrossRef CAS PubMed.
- S. C. L. Kamerlin, J. Mavri and A. Warshel, FEBS Lett., 2010, 584, 2759–2766 CrossRef CAS PubMed.
- S. C. L. Kamerlin and A. Warshel, Proteins, 2010, 78, 1339–1375 CAS.
- A. Warshel, P. K. Sharma, M. Kato, Y. Xiang, H. B. Liu and M. H. M. Olsson, Chem. Rev., 2006, 106, 3210–3235 CrossRef CAS PubMed.
- A. Warshel and R. P. Bora, J. Chem. Phys., 2016, 144, 180901 CrossRef PubMed.
- M. Repic, R. Vianello, M. Purg, F. Duarte, P. Bauer, S. C. L. Kamerlin and J. Mavri, Proteins, 2014, 82, 3347–3355 CrossRef CAS PubMed.
- B. A. Amrein, P. Bauer, F. Duarte, A. J. Carlsson, A. Naworyta, S. L. Mowbray, M. Widersten and S. C. L. Kamerlin, ACS Catal., 2015, 5, 5702–5713 CrossRef CAS PubMed.
- A. Barrozo, F. Duarte, P. Bauer, A. T. P. Carvalho and S. C. L. Kamerlin, J. Am. Chem. Soc., 2015, 137, 9061–9076 CrossRef CAS PubMed.
- G. Oanca, M. Purg, J. Mavri, J. C. Shih and J. Stare, Phys. Chem. Chem. Phys., 2016, 18, 13346–13356 RSC.
- J. Aqvist and A. Warshel, Chem. Rev., 1993, 93, 2523–2544 CrossRef.
- A. Warshel and M. Levitt, J. Mol. Biol., 1976, 103, 227–249 CrossRef CAS PubMed.
- A. Warshel and R. M. Weiss, J. Am. Chem. Soc., 1980, 102, 6218–6226 CrossRef CAS.
- M. H. M. Olsson, J. Mavri and A. Warshel, Philos. Trans. R. Soc., B, 2006, 361, 1417–1432 CrossRef CAS PubMed.
- A. J. Adamczyk, J. Cao, S. C. L. Kamerlin and A. Warshel, Proc. Natl. Acad. Sci. U. S. A., 2011, 108, 14115–14120 CrossRef CAS PubMed.
- J. Aqvist and A. Warshel, Biochemistry, 1989, 28, 4680–4689 CrossRef CAS PubMed.
- J. Aqvist and A. Warshel, J. Am. Chem. Soc., 1990, 112, 2860–2868 CrossRef.
- J. K. Hwang, Z. T. Chu, A. Yadav and A. Warshel, J. Phys. Chem., 1991, 95, 8445–8448 CrossRef CAS.
- J. K. Hwang and A. Warshel, J. Phys. Chem., 1993, 97, 10053–10058 CrossRef CAS.
- A. V. Pisliakov, J. Cao, S. C. L. Kamerlin and A. Warshel, Proc. Natl. Acad. Sci. U. S. A., 2009, 106, 17359–17364 CrossRef CAS PubMed.
- I. Feierberg, V. Luzhkov and J. Aqvist, J. Biol. Chem., 2000, 275, 22657–22662 CrossRef CAS PubMed.
- G. Jindal and A. Warshel, J. Phys. Chem. B, 2016, 120, 9913–9921 CrossRef CAS PubMed.
- H. J. Kulik, J. Zhang, J. P. Klinman and T. J. Martinez, J. Phys. Chem. B, 2016, 120, 11389–11394 CrossRef PubMed.
- M. Poberžnik, M. Purg, M. Repič, J. Mavri and R. Vianello, J. Phys. Chem. B, 2016, 120, 11419–11427 CrossRef PubMed.
- R. Vianello, M. Repic and J. Mavri, Eur. J. Org. Chem., 2012, 36, 7057–7065 CrossRef.
- J. C. Shih, K. Chen and M. J. Ridd, Annu. Rev. Neurosci., 1999, 22, 197–217 CrossRef CAS PubMed.
- M. Husain, D. E. Edmondson and T. P. Singer, Biochemistry, 1982, 21, 595–600 CrossRef CAS PubMed.
- M. C. Walker and D. E. Edmondson, Biochemistry, 1994, 33, 7088–7098 CrossRef CAS PubMed.
- J. R. Miller and D. E. Edmondson, Biochemistry, 1999, 38, 13670–13683 CrossRef CAS PubMed.
- J. R. Miller and D. E. Edmondson, J. Biol. Chem., 1999, 274, 23515–23525 CrossRef CAS PubMed.
- R. K. Nandigama and D. E. Edmondson, Biochemistry, 2000, 39, 15258–15265 CrossRef CAS PubMed.
- M. A. Akyuz, S. S. Erdem and D. E. Edmondson, J. Neural Transm., 2007, 114, 693–698 CrossRef CAS PubMed.
- D. E. Edmondson, C. Binda, J. Wang, A. K. Upadhyay and A. Mattevi, Biochemistry, 2009, 48, 4220–4230 CrossRef CAS PubMed.
- J. Wang and D. E. Edmondson, Biochemistry, 2011, 50, 7710–7717 CrossRef CAS PubMed.
- A. K. Tan and R. R. Ramsay, Biochemistry, 1993, 32, 2137–2143 CrossRef CAS PubMed.
- T. Z. E. Jones, D. Balsa, M. Unzeta and R. R. Ramsay, J. Neural Transm., 2007, 114, 707–712 CrossRef CAS PubMed.
- A. W. J. Bach, N. C. Lan, D. L. Johnson, C. W. Abell, M. E. Bembenek, S. W. Kwan, P. H. Seeburg and J. C. Shih, Proc. Natl. Acad. Sci. U. S. A., 1988, 85, 4934–4938 CrossRef CAS.
- J. Grimsby, K. Chen, L. J. Wang, N. C. Lan and J. C. Shih, Proc. Natl. Acad. Sci. U. S. A., 1991, 88, 3637–3641 CrossRef CAS.
- R. B. Silverman, Acc. Chem. Res., 1995, 28, 335–342 CrossRef CAS.
- K. A. Kurtz, M. A. Rishavy, W. W. Cleland and P. F. Fitzpatrick, J. Am. Chem. Soc., 2000, 122, 12896–12897 CrossRef CAS.
- M. A. Akyuz and S. S. Erdem, J. Neural Transm., 2013, 120, 937–945 CrossRef PubMed.
- V. E. Atalay and S. S. Erdem, Comput. Biol. Chem., 2013, 47, 181–191 CrossRef CAS PubMed.
- P. F. Fitzpatrick, Arch. Biochem. Biophys., 2010, 493, 13–25 CrossRef CAS PubMed.
- R. Orru, M. Aldeco and D. E. Edmondson, J. Neural Transm., 2013, 120, 847–851 CrossRef CAS PubMed.
- K. Cakir, S. S. Erdem and V. E. Atalay, Org. Biomol. Chem., 2016, 14, 9239–9252 CAS.
- J. R. Tormoz, M. B. Suarez and P. F. Fitzpatrick, Arch. Biochem. Biophys., 2016, 612, 115–119 CrossRef PubMed.
- G. Zapata-Torres, A. Fierro, G. Barriga-Gonzalez, J. C. Salgado and C. Celis-Barros, J. Chem. Inf. Model., 2015, 55, 1349–1360 CrossRef CAS PubMed.
- S. S. Erdem, O. Karahan, I. Yildiz and K. Yelekci, Org. Biomol. Chem., 2006, 4, 646–658 CAS.
- A. Fierro, D. E. Edmondson, C. Celis-Barros, M. Rebolledo-Fuentes and G. Zapata-Torres, PLoS One, 2016, 11, 1–10 Search PubMed.
- E. Abad, R. K. Zenn and J. Kastner, J. Phys. Chem. B, 2013, 117, 14238–14246 CrossRef CAS PubMed.
- R. M. Geha, I. Rebrin, K. Chen and J. C. Shih, J. Biol. Chem., 2001, 276, 9877–9882 CrossRef CAS PubMed.
- J. March, Advanced organic chemistry: reactions, mechanisms, and structure, Wiley, New York, 4th edn, 1992 Search PubMed.
- N. S. Isaacs, Physical organic chemistry, Longman Scientific & Technical, Wiley & Sons, Burnt Mill, Harlow, Essex, England New York, 2nd edn, 1995 Search PubMed.
- S. S. Shaik, Acta Chem. Scand., 1990, 44, 205–221 CrossRef CAS.
- A. Sharir-Ivry and A. Shurki, J. Phys. Chem. A, 2008, 112, 13157–13163 CrossRef CAS PubMed.
- J. Chandrasekhar and W. L. Jorgensen, J. Am. Chem. Soc., 1985, 107, 2974–2975 CrossRef CAS.
- J. Chandrasekhar, S. F. Smith and W. L. Jorgensen, J. Am. Chem. Soc., 1984, 106, 3049–3050 CrossRef CAS.
- J. K. Hwang, G. King, S. Creighton and A. Warshel, J. Am. Chem. Soc., 1988, 110, 5297–5311 CrossRef CAS.
- M. Purg, M. Repic and J. Mavri, Kemija v šoli in družbi, 2013, 25, 10–18 Search PubMed.
- M. Repic, M. Purg and J. Mavri, Empirical Valence Bond Online Tutorial, http://www.ki.si/en/departments/d01-department-of-computational-biochemistry-and-drug-design/empirical-valence-bond/ Search PubMed.
- E. Y. Lau, K. Kahn, P. A. Bash and T. C. Bruice, Proc. Natl. Acad. Sci. U. S. A., 2000, 97, 9937–9942 CrossRef CAS.
- Y. Nagata, Y. Ohtsubo and M. Tsuda, Appl. Microbiol. Biotechnol., 2015, 99, 9865–9881 CrossRef CAS PubMed.
- M. M. Häggblom and I. D. Bossert, Dehalogenation: microbial processes and environmental applications, Kluwer Academic Pub., Boston, 2003 Search PubMed.
- R. Borstnar, M. Repic, S. C. L. Kamerlin, R. Vianello and J. Mavri, J. Chem. Theory Comput., 2012, 8, 3864–3870 CrossRef CAS PubMed.
- W. L. Jorgensen, D. S. Maxwell and J. TiradoRives, J. Am. Chem. Soc., 1996, 118, 11225–11236 CrossRef CAS.
- G. A. Kaminski, R. A. Friesner, J. Tirado-Rives and W. L. Jorgensen, J. Phys. Chem. B, 2001, 105, 6474–6487 CrossRef CAS.
- M. J. Robertson, J. Tirado-Rives and W. L. Jorgensen, J. Chem. Theory Comput., 2015, 11, 3499–3509 CrossRef CAS PubMed.
- Maestro, version 9.7, Schrödinger, LLC, New York, NY, 2014 Search PubMed.
- M. J. Frisch, G. W. Trucks, H. B. Schlegel, G. E. Scuseria, M. A. Robb, J. R. Cheeseman, G. Scalmani, V. Barone, B. Mennucci, G. A. Petersson, H. Nakatsuji, M. Caricato, X. Li, H. P. Hratchian, A. F. Izmaylov, J. Bloino, G. Zheng, J. L. Sonnenberg, M. Hada, M. Ehara, K. Toyota, R. Fukuda, J. Hasegawa, M. Ishida, T. Nakajima, Y. Honda, O. Kitao, H. Nakai, T. Vreven, J. A. Montgomery Jr, J. E. Peralta, F. Ogliaro, M. J. Bearpark, J. Heyd, E. N. Brothers, K. N. Kudin, V. N. Staroverov, R. Kobayashi, J. Normand, K. Raghavachari, A. P. Rendell, J. C. Burant, S. S. Iyengar, J. Tomasi, M. Cossi, N. Rega, N. J. Millam, M. Klene, J. E. Knox, J. B. Cross, V. Bakken, C. Adamo, J. Jaramillo, R. Gomperts, R. E. Stratmann, O. Yazyev, A. J. Austin, R. Cammi, C. Pomelli, J. W. Ochterski, R. L. Martin, K. Morokuma, V. G. Zakrzewski, G. A. Voth, P. Salvador, J. J. Dannenberg, S. Dapprich, A. D. Daniels, Ö. Farkas, J. B. Foresman, J. V. Ortiz, J. Cioslowski and D. J. Fox, Gaussian 09, Revision A.02, Gaussian, Inc., Wallingford CT, 2009 Search PubMed.
- D. A. Case, J. T. Berryman, R. M. Betz, D. S. Cerutti, I. T. E. Cheatham, T. A. Darden, R. E. Duke, T. J. Giese, H. Gohlke, A. W. Goetz, N. Homeyer, S. Izadi, P. Janowski, J. Kaus, A. Kovalenko, T. S. Lee, S. LeGrand, P. Li, T. Luchko, R. Luo, B. Madej, K. M. Merz, G. Monard, P. Needham, H. Nguyen, H. T. Nguyen, I. Omelyan, A. Onufriev, D. R. Roe, A. Roitberg, R. Salomon-Ferrer, C. L. Simmerling, W. Smith, J. Swails, R. C. Walker, J. Wang, R. M. Wolf, X. Wu, D. M. York and P. A. Kollman, AMBER 2015, University of California, San Francisco, 2015 Search PubMed.
- J. Marelius, K. Kolmodin, I. Feierberg and J. Aqvist, J. Mol. Graphics Modell., 1998, 16, 213–225 CrossRef CAS PubMed.
| This journal is © The Royal Society of Chemistry 2017 |