 Open Access Article
Facile transformation of low cost melamine–oxalic acid into porous graphitic carbon nitride nanosheets with high visible-light photocatalytic performance†
Xiaopeng Hana,
Li Tiana,
Hongjin Jianga,
Lingru Konga,
Jianan Lva,
Jing Shana,
Jiwei Wang*ab and
Xiaoxing Fan *ab
*ab
aSchool of Physics, Liaoning University, Shenyang, 110036, P. R. China. E-mail: xxfan@lnu.edu.cn; jiweiwang6688@yahoo.com; Fax: +86-24-62202309; Tel: +86-18-640064965
bLiaoning Key Laboratory of Semiconductor Light Emitting and Photocatalytic Materials, Liaoning University, Shenyang 110036, P. R. China
First published on 3rd March 2017
Abstract
Here, we report a simple, robust and large-quantity synthetic pathway to form porous graphitic carbon nitride nanosheet structures, using a long strip-like structure of melamine–oxalic acid (MO) as a starting product. The addition of oxalic acid can influence the thermal condensation model and inhibit grain growth of g-C3N4. Meanwhile, the synergism of MO precursor and specific heating process can effectively adjust the porosity and number of layers. The synthesized porous g-C3N4 nanosheets possess large specific surface areas (203 m2 g−1), a widened band gap 2.98 eV, and improved electron transport ability, exhibit high photocatalytic activities as much as 8 times than bulk g-C3N4 for the photodegradation of gas pollute under visible light (λ > 420 nm). This work shows a significant progress for low-cost fabrication of high quality porous 2D g-C3N4 with excellence photocatalytic activity.
Introduction
Graphitic carbon nitride, generally known as g-C3N4, which consists of two-dimensional (2D) conjugated planes packed together with tri-s-triazine repeating units through van der Waals interactions,1 is recognized as the most stable allotrope among various carbon nitrides under ambient conditions.2 Recently, g-C3N4, has emerged as a metal-free visible-light photocatalyst for relevant reactions, including water splitting,3 CO2 reduction,4 and NO removal.5 Nanostructure engineering is an efficient protocol to tailor the morphology, texture, electronic structure and surface properties of g-C3N4.1 Considerable effort have been placed on the design and fabrication of nanostructure for improving the photocatalytic activity of g-C3N4, such as porous structure, hollow spheres, nanorods, nanowires, nanosheets, helical nanorods and so on.6–10 Controlling morphologies and surface characteristics of the g-C3N4 nanostructure matrix is an effective technique to advance g-C3N4 photocatalysis with efficient charge transportation and migration as well as mass diffusion during the photocatalytic reaction.In general, methods to tailor the structural properties of g-C3N4 are mainly through the introduction of different morphologies and porosity in the bulk g-C3N4 by using the nano-templating and nanocasting approach. The porosity, morphology, surface area and pore size can be easily tuned by appropriate templates. Indeed, the controllable nanostructure design of g-C3N4, such as porous g-C3N4, 1D nano architectures, hollow g-C3N4 nanospheres, and so forth, has been exhaustively explored by researchers through hard- or soft-templating methods in liquid precursors.9,11–15 For instance, mesoporous g-C3N4 materials can be developed by nitrogen-rich precursors in the presence of different nanostructured silica based hard templates, such as silica nanoparticles or nanospheres and mesoporous silica templates,15–17 the obtained mesoporous g-C3N4 exhibit accessible open pores, large surface area, and improved light harvesting features due to multiple scattering effects and enhanced mass diffusion of reactant molecules. The as-prepared materials exhibited improved photocatalytic activity under visible-light illumination. However, the use of templates was not economical, environmentally unfriendly, and can't deal with the requirement of mass production. Thus, developing a new synthetic strategy solving the above problem has become a rather urgent necessity to advance carbon nitride photocatalysis.
Recently, making use of organic supramolecular complexes as precursors to obtain well-ordered carbon nitrides materials with different morphologies is a novel approach. For instance, Shalom group, Stucky group and Thomas group reported the “self-templating” approach to obtain various special morphologies carbon nitride (such as mesoporous hollow spheres, nanoparticles, nanotubes, and nanosheets) by using preorganized hydrogen-bonded cyanuric acid–melamine supramolecular network as precursors.18–21 Wang group reported that g-C3N4 composed of networks of primary nanobelts and anomalous nanorods were prepared by using polymerization of cyanuric chloride and melamine in acetonitrile at 180 °C.22 And Gao group reported porous nanorod-type g-C3N4/metal oxide composites and Cu-doped graphitic carbon nitride nanosheet were prepared by using Cu–melamine supramolecular framework as precursor.23,24 The simple, safe, efficient and cheap synthetic way has initiated the very promise of “self-templating” approach for facile synthesis of g-C3N4.
Herein, we report a new synthesis of porous g-C3N4 nanosheets by using oxalic acid mediated melamine as precursor, accompanied with a designed heat-treated process. Oxalic acid as the carboxylic acid could combine with melamine through hydrogen bond link between a carboxyl group (–COOH) in oxalic acid and amido group in melamine. Thus, we chose melamine and oxalic acid together acted as new precursor and hoped that oxalic acid can play an important role in the process of the thermal condensation, meanwhile, take full advantage of the residue result from the oxalic acid by a designed heat-treated process. As expected, the obtained materials have a porous nanosheet microstructure with a high specific surface area of 203 m2 g−1. The photocatalytic performance of the resultant g-C3N4 was great enhanced when evaluated by 2-propanol degradation under visible-light irradiation. Moreover, photophysical and photochemical behavior of charge carriers in porous g-C3N4 nanosheets was further investigated.
Experimental
Synthesis of porous and bulk g-C3N4
The synthesis of melamine–oxalic acid (MO) complex is as follows: melamine (2.52 g) was dissolved in distilled water (100 ml) then heated at 80 °C for 0.5 h. Oxalic acid (0.42, 0.504, 0.63, 0.84, 1.26 and 2.52 g, the molar ratio of melamine to oxalic acid are 1, 2, 3, 4, 5 and 6, respectively) was dissolved in distilled water (20 ml) and obtained oxalic acid solution. Subsequently, oxalic acid solution was added to the above melamine solution drop by drop with stirring at 80 °C for 2 h, and results in the fast precipitation of a white solid. Finally, white precipitated MO complexes were separated by suction filtration of the above solution. After washed by distilled water, the resulting powders were dried at 80 °C for 2 h. The as-obtained MO complexes are abbreviated MO-1, MO-2, MO-3, MO-4, MO-5 and MO-6, according to the molar ratios of melamine and oxalic acid, respectively. The MO-X (X = 1, 2, 3, 4, 5 and 6) was placed in an alumina crucible with a cover and then put into the middle region of a quartz tube. The quartz tube was heated to 550 °C in a tubular furnace for 4 h at a rising rate of 5 °C min−1 with N2 flow of 40 ml min−1. The calcined products are abbreviated to CNO-1, CNO-2, CNO-3, CNO-4, CNO-5 and CNO-6, according to the molar ratios of melamine to oxalic acid, respectively. Then, the samples of CNO-X were further calcined at 470 °C for 2 h in air, and were abbreviated to CNOA-1, CNOA-2, CNOA-3, CNOA-4, CNOA-5 and CNOA-6, respectively (A denotes heating in air atmosphere).As a contrast, three samples were prepared. Bulk g-C3N4 was prepared at the same process above mentioned but without oxalic acid treatment. The bulk g-C3N4 was abbreviated to CNO-0, and CNOA-0 (further calcined in air), respectively. Another sample was prepared by only direct heating MO-4 at 550 °C in air 2 h, the sample was abbreviated to CNO-AIR.
Characterization
The thermogravimetric-differential scanning calorimetry analysis (TG-DSC) measurements were performed on NETZSCH STA 409 PG/PC analyzer, the detected range of temperature is from room temperature to 800 °C at a heating rate of 10 °C min−1. X-ray diffraction (XRD) patterns were obtained using a powder X-ray diffractometer (Cu Kα radiation source, TD-3500, Tongda Co. Ltd. China). The UV-vis diffuse reflectance spectrum was recorded by a UV-vis spectrophotometer (UV-2550, Shimadzu) at room temperature and transformed to the absorption spectrum according to the Kubelka–Munk relationship. The nitrogen adsorption–desorption isotherms were measured via nitrogen physisorption at 77 K on a surface area and porosity analysizer Instrument (Quadrasorb evo, Quantachrome). The specific surface areas (SBET) were calculated according to the Brunauer–Emmett–Teller (BET) method and pore size distribution plots were obtained by using the Barrett–Joyner–Halenda (BJH) model. The Fourier transform infrared (FT-IR) experiment was obtained using a Magna-IR750 FT-IR spectrometer in the KBr pellet, scanning from 4000 to 400 cm−1. The general morphology of samples was measured on a scanning electron microscopy (SEM, S-3400N). Transmission electron microscope (TEM) images were obtained on a JEOL JEM-2100 electron microscope with an accelerating voltage of 200 kV, the samples for TEM were prepared by dispersing the final powders in ethanol, and the dispersion was dropped on carbon–copper grids. X-ray photoelectron spectroscopy (XPS) data were obtained ona PHI 5000 Versa Probe using 200 W monochromated Al Kα radiation. Binding energies were calibrated using the adventitious carbon (C 1s) = 284.6 eV. The atomic ratio of each element in different samples was determined via elemental analysis (CHN-O-Rapid, Heraeus). Photoluminescence (PL) spectra were recorded on a fluorescence spectrophotometer (Hitachi F7000). The fluorescence decays were obtained with a nanosecond laser time-correlated single photon counting (TCSPC) setup (FluoroMax-4 Spectrofluorometer, Horiba Jobin Yvon Corp). The instrument response function of the laser SPC system has a fwhm of 1 ns and the time resolution is estimated at 200 ps. The time ranges are 0.055 ns per channel, in 4096 effective channels. The estimated reproducibility is around 2% for the nanosecond decays. The tail gas was probed by using a flue gas analyzer (Multilyzer STe M60).Photocatalytic activity measurements
The photocatalytic activities of the samples were performed by oxidizing 2-propanol using a gastight system with a quartz window. In a typical process, powder sample (0.1 g) was put on a 4 cm2 glass groove. The glass with photocatalyst was then put into a 300 ml reactor, filled with air to one atmospheric pressure. Then, 5 μl 2-propanol solutions were injected into the reactor, then evaporate to generate a high-concentration 2-propanol gas. Prior to light irradiation, the reactor was left in the dark for at least 3 h until an adsorption–desorption equilibrium was finally established. The light source for the visible-light photocatalytic reaction was a 300 W Xe arc lamp equipped with a λ > 420 nm cutoff filter. After 120 min irradiation, 1 ml of the gas sample was picked up by using an injector, and sent to a gas chromatograph with FID detector (GC1690, JieDao Tech).Preparation of working electrodes
The photoelectrodes were prepared by electrophoretic deposition method (EPD). The fluorine-doped tin oxide (FTO) substrates were cleaned by ultrasonication in distilled water, absolute ethanol for 30 min sequentially and then dried with a clean, dry airflow. 40 mg of photocatalyst and 10 mg iodine were dispersed in 40 ml acetone by at least 60 min sonication to prepare a homogeneous supernatant solution. EPD was carried out under constant voltage conditions and the thickness was controlled through the time of deposition. FTO (10 mm × 20 mm) substrates with applied voltage of 12 V were inserted as-obtained supernatant solution for 15 min. After deposition, substrates with particle deposits were taken out from the suspension, and then deposited films were dried at room temperature. Finally, the FTO glass deposited with the prepared photocatalyst powder was heated to 350 °C for 1 h in muffle furnace to improve the adhesion of photocatalyst powder on the FTO conductive glass.Photoelectrochemical measurements
Electrochemical experiments were carried out using a Princeton Applied Research electrochemical workstation with three-electrode configuration. The catalyst coated on FTO glass, Pt foil, Ag/AgCl electrode and 0.5 M Na2SO4 aqueous solution were used as the working electrode, the counter-electrode, the reference electrode, and the electrolyte, respectively. The active area of the film was 0.28 cm2. A 300 W Xe arc lamp equipped with a λ > 420 nm cutoff filter was utilized as a light source. The electrochemical impedance spectra (EIS) were measured by the same potentiostat in a frequency range of 100 kHz to 0.1 Hz at potentials of 0 V vs. open circuit voltage under illumination.Results and discussion
Formation of molecular cooperative assembly between melamine and oxalic acid
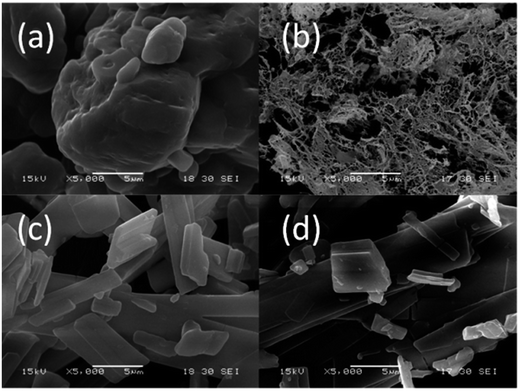
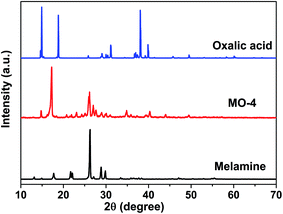
The precursor of g-C3N4 formed by MO precipitation from the mixture of melamine and oxalic acid in hot deionized water was investigated by SEM at lower magnification. Fig. 1 shows that the whiter precipitation is composed of the uniform long strips whose thickness and width are related to the molar ratios of melamine to oxalic acid. Increasing the amount of oxalic acid, the thickness and width of the long strip increase too (Fig. 1c and d and S1a–d†). However, the melamine is a large granular structure (Fig. 1a), and oxalic acid presents a nanomesh structure with thin thickness (Fig. 1b). Obviously, the morphology of whiter MO precipitation is quite different to the pure melamine and oxalic acid, which suggests that MO was produced by a reaction.The obtained MO precipitation is different from pure melamine that also can be confirmed by XRD characterization. Fig. 2 shows the XRD patters of MO-4, melamine and oxalic acid. It can be seen that the characteristic peaks of MO-4 are not belong to both melamine and oxalic acid, indicating that MO-4 is not an aggregate composed by melamine and oxalic acid, but a compound resulted from the reaction of melamine with oxalic acid. Furthermore, we can see from the FT-IR analysis of MO-4 (Fig. S2†), the vibrational absorption peaks of melamine get weakened and disappeared compared to the FT-IR spectra of pure melamine, in particular, the NH2 and NH motifs at 3000–3500 cm−1 become unobvious. It suggests that the reaction caused by hydrogen bond link between carboxyl group (–COOH) in oxalic acid and amido group in melamine influences the stretching mode.25 Based on above analysis, it is believed that the formation of these long strips should be directly related to the structure of the molecular assembly of MO complex as shown in Scheme 1. Nonstoichiometric oxalic acid and melamine linked by hydrogen bond might grow preferentially along the one direction and formed long strip morphology.
 | ||
| Scheme 1 Chemical formula of melamine–oxalic acid hydrogen bonded aggregates (MO). Dotted lines indicate hydrogen bonds. | ||
Thermal polycondensation of MO-X to g-C3N4
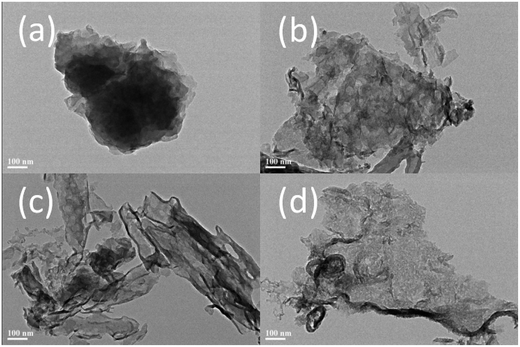
Of particular interest is that the combination of melamine and oxalic acid as a precursor might add some advantages to the synthesis of g-C3N4 for photocatalytic applications. (1) The oxalic acid mediated melamine can be expected yield porous or other nanostructures depending on the precursor molecules with design heating atmosphere. (2) The use of oxalic acid mediated melamine might also modify the polycondensation and the chemical structure of g-C3N4 with the formation of a band structure that would facilitate electron transfer and delocalization.As expected, the productions by using oxalic acid mediated melamine as precursor presented unique nanostructure. Here, the specific morphology and texture of productions were investigated by TEM and shown in Fig. 3. TEM image of CNO-0 illustrates a typical non-porous and stratiform structure (Fig. 3a), but those of as-obtained samples from oxalic acid mediated melamine as precursor show the characteristics of porous nanosheets structure (Fig. 3b–d), which could be attributed to that oxalic acid modified the polycondensation process. In addition, it can be found that CNOA-4 possesses more holes and thinner thickness than CNO-4 and CNO-AIR, this advantage should be attributed to the “two-step heating” method which leads to larger specific surface area.
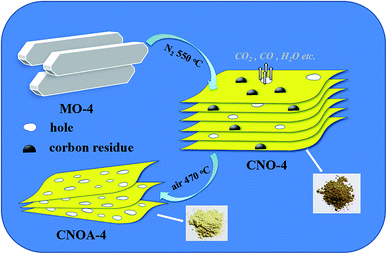
The specific surface area (SBET) and porous architecture was investigated by N2 adsorption–desorption isotherms and corresponding pore size distribution (Fig. 4 and S3†). The N2 adsorption–desorption isotherms of as-obtained samples from the precursor of oxalic acid mediated melamine all reveal stepwise adsorption and desorption process, which is characteristic of mesoporous materials. Table 1 summarized the SBET and pore volumes of all samples, the SBET of CNO-0 synthesized by pure melamine is 9 m2 g−1, while the samples prepared by oxalic acid mediated melamine show larger SBET, the phenomenon protrudes the function of oxalic acid. In order to study the formation mechanism of large specific surface area, different heated atmospheres were carried out. Take the sample of MO-4 as an example, the SBET were 32 and 29 m2 g−1 for samples heated at 550 °C in N2 and air, respectively. Interestingly, by adopting a two-step heating method, for instance, first heated in N2 and then in air, the sample possesses an as larger specific surface area as 203 m2 g−1. Therefore, compared to one-step heating method, the two-step heating method remarkably improves the SBET of g-C3N4, which actually result from solving the problem of “pore resealing”. In general, the preparation of porous g-C3N4 by using organic template method is confronted with the practical problem that the condensation towards larger extended CN-structures takes place around or above the decomposition temperature of the common used template. And thus, decomposition of the template at too early a stage results in the resealing of the pores.13,26–29 So, by using organic template, when only heated in air, the resealing of the pores decreased the specific surface area due to less porous structure production. While when heated only in N2 atmosphere, some carbon residue generated by the decomposition of MO and existed in the g-C3N4, for the carbon residue cannot be removed. Thus, both calcined in air and N2 atmosphere cannot provide sufficient pores and influence the specific surface area. In summary, the function of “two-step heating” method can be depicted as follows, the first step is heating at N2 atmosphere to generate carbon residue from the composition of oxalic acid and keep the carbon residue exist in the g-C3N4, the second step is further calcination in air to remove the carbon and obtain porous g-C3N4 with large specific surface area. Indeed, a wide pore size distribution ranged from 2 to 26 nm in CNOA-4 is observed, which is consistent with the result of the above TEM images. To prove the removal of carbon residue by the further treatment in air, the elemental analysis was carried out. The C/N atomic ratio was shown in Table S1,† the C/N ratio of the CNO-4 was 0.674, but it decrease to 0.671 after calcination in air, CNO-4 contains more carbon residue than CNOA-4, the decrease of C/N ratio implies that the carbon residue was removed. Moreover, Fig. S4† shows the comparison of different samples in optical view. The color of the samples in N2 atmosphere was brown by reason of carbon residue, while the color of the samples calcined further in air became yellow which is the same color as that of typical g-C3N4. The fade in color confirmed the fact that the carbon was removed by calcination in air.
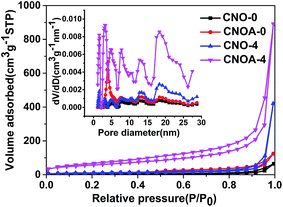 | ||
| Fig. 4 Nitrogen adsorption–desorption isotherms and corresponding pore size distribution of CNO-0, CNOA-0, CNO-4 and CNOA-4. | ||
| Sample | SBET (m2 g−1) | Pore volume (cm3 g−1) | Average crystallite sizes (nm) |
|---|---|---|---|
| CNO-0 | 9 | 0.073 | 8.5 |
| CNOA-0 | 34 | 0.199 | 10.5 |
| CNO-1 | 23 | 0.369 | 7.5 |
| CNOA-1 | 120 | 0.649 | 9.8 |
| CNO-2 | 26 | — | 5.1 |
| CNOA-2 | 141 | 1.124 | 8.2 |
| CNO-3 | 27 | — | 6.7 |
| CNOA-3 | 153 | 0.692 | 8.6 |
| CNO-4 | 32 | 0.651 | 5.9 |
| CNOA-4 | 203 | 1.348 | 6.9 |
| CNO-5 | 28 | — | 6.2 |
| CNOA-5 | 154 | 0.949 | 6.4 |
| CNO-6 | 23 | — | 6.8 |
| CNOA-6 | 141 | 0.862 | 6.9 |
| CNO-AIR | 29 | 1.677 | 4.2 |
The SBET of CNOA-0 (CNO-0 heated in air at 470 °C) is 3 times than that of CNO-0, which should be caused by thermal oxidation etching.30,31 The function of thermal oxidation etching should mainly reduce the thickness of sample through overcoming the weak van der Waals force between layers,32 thus improve the specific surface area. Interestingly, after the same calcination in air, the SBET of CNOA-4 increases almost 6 times. So, we need to further analyze the function of thermal oxidation etching to the specific surface area. Combined with the above analysis, it is believed that some pores were obtained before and during further calcination in air by removing the carbon, and the already existed pores help the oxygen entering the inner of the g-C3N4 to enhance the thermal oxidation etching and further increase the specific surface area. Therefore, the synergism of thermal oxidation etching and oxalic acid mediated melamine precursor can effective increase the specific surface area, porosity and adjust the thickness of g-C3N4.
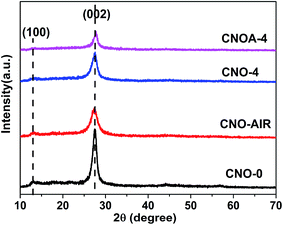
XRD was used to characterize the phase structure of the porous g-C3N4 (Fig. 5). All XRD patterns exhibit two distinct peaks at 13.0° and 27.4°, which respectively correspond to the characteristic diffraction of the (100) and (002) planes of the g-C3N4, and caused by the interlayer stacking of aromatic segments and the in-plane structural packing motif, respectively. The similarity of XRD patterns indicates that oxalic acid has no significant influence on the formation of graphitic stacking structures of g-C3N4, and the most of NH2 group of melamine have been reserved. However, the XRD peaks of CNO-X and CNO-AIR were much weaker and broader than those of CNO-0, indicating its crystalline was not as high as that of CNO-0. The average crystallite sizes were calculated to be 8.5, 4.2, 5.9 and 6.9 nm for CNO-0, CNO-AIR, CNO-4 and CNOA-4 according to the broadening of the (002) peak in the XRD patterns by Scherer's formula, respectively. It indicated that the addition of oxalic acid leads to the decrease of crystallite size and the inhibition of the crystal growth of graphitic carbon nitride. Moreover, compared with CNO-4, the crystal size of CNOA-4 increased after further heating in air, this can be ascribed to the high temperature which enhanced the grains growth. This phenomenon also can be found in the other samples (Fig. S5†).
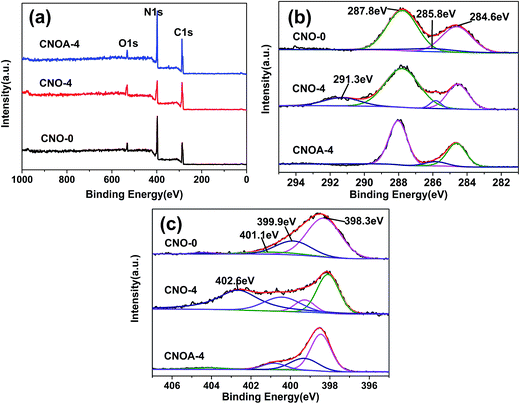
To further investigate the chemical composition and chemical states of bulk and as-obtained porous nanosheets, XPS measurement was conducted. As shown in Fig. 5, besides the main elements of C and N on the surface, there is a small amount of oxygen (Fig. 6a), which is mainly caused by the adsorbed water and carbon dioxide. Fig. 6b demonstrated that C 1s spectrum could be fitted with three components at 284.6 eV, 285.8 eV and 287.8 eV, the component at 284.6 eV corresponded to C–C, which originated from pure carbon such as graphite or amorphous carbon. The peak at 285.8 eV corresponded to C![[double bond, length as m-dash]](https://www.rsc.org/images/entities/char_e001.gif) N or C
N or C![[triple bond, length as m-dash]](https://www.rsc.org/images/entities/char_e002.gif) N, which could be ascribed to defect-containing sp2-hybridized carbon atoms presented in graphitic domains.33 The peak at 288.1 eV corresponded to the sp2-hybridized carbon in N
N, which could be ascribed to defect-containing sp2-hybridized carbon atoms presented in graphitic domains.33 The peak at 288.1 eV corresponded to the sp2-hybridized carbon in N![[double bond, length as m-dash]](https://www.rsc.org/images/entities/char_e001.gif) C–N2 coordination, which connected with three neighboring N atoms in one double and two single bonds.34 As can be seen, compared with CNO-0, there was no obvious binding energy shift in C 1s of the g-C3N4 prepared by MO-4 apart from the peak at 291.3 eV. The peak of 291.3 eV should be attributed to the π–π* shake-up satellite of conjugated C
C–N2 coordination, which connected with three neighboring N atoms in one double and two single bonds.34 As can be seen, compared with CNO-0, there was no obvious binding energy shift in C 1s of the g-C3N4 prepared by MO-4 apart from the peak at 291.3 eV. The peak of 291.3 eV should be attributed to the π–π* shake-up satellite of conjugated C![[double bond, length as m-dash]](https://www.rsc.org/images/entities/char_e001.gif) C bonds,35,36 that might be caused by “carbon residue”. Also, this peak was disappeared after the further air treatment, and also support the fact of the carbon residue was removed. In the N 1s spectrum (Fig. 6c), four binding energies could be separated. The dominant peak at 398.3 eV corresponds to the sp2-hybridized nitrogen in C containing triazine rings (C–N
C bonds,35,36 that might be caused by “carbon residue”. Also, this peak was disappeared after the further air treatment, and also support the fact of the carbon residue was removed. In the N 1s spectrum (Fig. 6c), four binding energies could be separated. The dominant peak at 398.3 eV corresponds to the sp2-hybridized nitrogen in C containing triazine rings (C–N![[double bond, length as m-dash]](https://www.rsc.org/images/entities/char_e001.gif) C), whereas the peak located at 399.9 eV is usually attributed to the bridging N atoms in N–(C)3 groups, and the peak at 401.1 eV indicates the amino groups (N–H). Obviously, a new peak at 402.6 eV appears in the N 1s spectra of CNO-4, the peak correspond to N–O.34,37 It may be contributed by a decomposed product especially when calcined in N2 atmosphere, since the peak disappear for CNOA-4 which calcined in air.
C), whereas the peak located at 399.9 eV is usually attributed to the bridging N atoms in N–(C)3 groups, and the peak at 401.1 eV indicates the amino groups (N–H). Obviously, a new peak at 402.6 eV appears in the N 1s spectra of CNO-4, the peak correspond to N–O.34,37 It may be contributed by a decomposed product especially when calcined in N2 atmosphere, since the peak disappear for CNOA-4 which calcined in air.
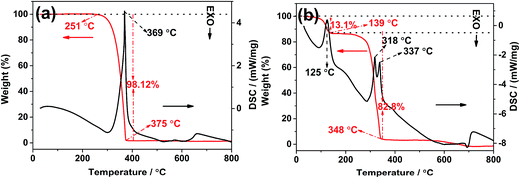
In order to understand the synthetic process of different precursors, TG-DSC was carried out. The TG-DSC curves of melamine and MO-4 are shown in Fig. 7a and b, respectively. The TG-DSC curves clearly show significant difference between the two precursors. The melamine shows only one sharp weight loss accompanied with one endothermal peak in the temperature range of 290–370 °C, which can be attributed to the sublimation and thermal condensation of melamine occurred in this temperature range. The total weight loss is 98.12%, implying that the melamine sublimate completely during heating process in an open system. Nevertheless, the MO-4 displays a different stepwise weight-losses, the first weight loss (about 13.1%) with an endothermal peak at 125 °C can be ascribed to the removal of physically adsorbed water or oxalic acid. The second weight loss in the temperature range of 200–348 °C, with two endothermal peaks at 318 °C and 334.7 °C, which could be attributed to the decomposition of oxalic acid, the sublimation and thermal condensation of melamine, respectively. In order to know the decomposition process of MO, we have been probed the tail gas by heating MO in a tube furnace at the temperature range of 100–400 °C. The result displays that CO2, H2O and CO gas emitted continuously during heating, especially when the temperature was above 290 °C, the gas released sharply, meanwhile, some hydrogen presented at high calcination temperature. These indicate that the decomposition and reaction of oxalic acid occurred in this temperature range, and the continuous gas release process could act as an important role on the thickness and porosity of the 2D materials.13,38–40 The gas analysis also indicates the oxalic acid can act as a “dynamic gas template” which would be removed by thermal decomposition in N2, this conclusion is consistent with the SBET result that addition of oxalic acid increase the specific surface area when only heating in N2. Furthermore, the transformation of CNO-4 to CNOA-4 was detected in air atmosphere by TG. As shown in Fig. S6,† a slight mass loss of CNO-0, which could be attributed to the removal of physically adsorbed water. But, the mass loss of CNO-4 was higher than that of CNO-0, this can be explained by that the excess carbon residue was removed in air.
From the above analysis, a possible formation mechanism of porous g-C3N4 nanosheets can be proposed. As illustrated in Scheme 2, firstly, when MO-4 was heated at 550 °C in N2, the decomposition and reaction of oxalic acid in MO-4 would produce some pores and generate carbon residue existed in CNO-4, thus, the as-obtained brown CNO-4 is a nanosheet structure with pores. Second, when the above CNO-4 was heated at 470 °C in air, the carbon residue would be removed and formed plenty of holes, meanwhile, the thickness of the sample decreased due to the thermal oxidation etching. Furthermore, the formed pores can also help the oxygen entering the inner of the g-C3N4 enhancing the thermal oxidation etching. Thus, the obtained CNOA-4 with typical yellow color possesses high porosity, few layers and large specific surface area.
The electronic band structures of the porous g-C3N4 nanosheets were studied by analysis of their optical absorption spectra and the plots of the (αhν)1/2 versus photon energy (hν). The UV-vis diffuse reflectance spectra in Fig. 8a shows an obvious blue shift of the intrinsic absorption edge for the CNOA-4 and CNO-4 compared with that of the CNO-0. This occurrence could be attributed to the well-known quantum size effect because of smaller crystal sizes and porosity.30 While the red shift in optical absorption from 460 to 700 nm are observed for CNO-AIR, which was caused by a minor amount of carbon generated by the pyrolysis of MO. The carbon may be incorporated into the melon-based carbon nitride structures through replacing the ring nitrogen atoms.41 The band gap energy (Eg) can be estimated from the intercept of the tangents to the plots of (αhν)1/2 versus photon energy. As shown in Fig. 8b, the band gaps optically obtained were approximately 2.76, 2.80, 2.98 eV and 2.72 eV for the samples of CNO-0, CNO-4, CNOA-4 and CNO-AIR, respectively. The larger band gap by shifting conduction and valence bands in opposite directions can contribute to provide more powerful photogenerated holes and electrons and inhibits the recombination of the photogenerated electrons and holes. In addition, samples prepared from MO-4 show a slight absorption at the range from 450 nm to 700 nm, which could be related to the increased defects owing to more impurities. This phenomenon also can be found in the UV-visible absorption spectra of CNOA-X (X = 1, 2, 3 and 5, Fig. S7†).
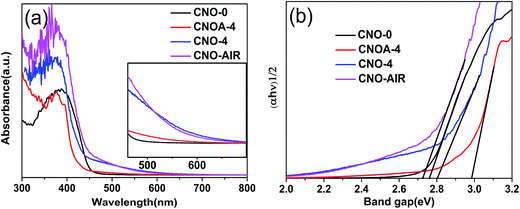 | ||
| Fig. 8 UV-vis absorption spectra (a) and the transformed Kubelka–Munk function vs. the energy of the light absorbed (b) of the samples of CNO-0, CNOA-4, CNO-4 and CNO-AIR. | ||
The photocatalytic activities of the samples were evaluated by oxidative dehydrogenation of 2-propanol to acetone under visible light irradiation (λ > 420 nm). 2-Propanol photodegradation is firstly by photo-oxidative dehydrogenation to give acetone and eventually photo-oxidization to CO2.42 Some literature42–45 have reported that 2-propanol photodegradation can serve as a good reaction model to evaluate the photocatalytic activities of semiconductors. Fig. 9 shows the evolved rate of acetone over different photocatalysts under visible light irradiation. The photocatalytic activity was 4.62, 13.86, 20.76, 25.56, 36.50, 25.78 and 20.77 ppm min−1 on CNO-0, CNOA-1, CNOA-2, CNOA-3, CNOA-4, CNOA-5 and CNOA-6, respectively. As can be seen, the photocatalytic activities of as-obtained CNOA-X by using oxalic acid mediated melamine as precursor accompanied with “two-step heating” method are higher than that of CNO-0 obtained from pure melamine, and there is a positive correlation between the photocatalytic activity and the specific surface area on CNOA-X, which indicate the specific surface area play a significant role on the photocatalytic activities. Nevertheless, the photocatalytic activities of CNO-4 and CNO-AIR are inferior to pure g-C3N4, although their specific surface areas are higher than that of pure g-C3N4. The phenomenon could be attributed to high carbon content causing excess defects which will act as recombination centers for photogenerated electrons and holes, thus decreasing the photocatalytic activity.
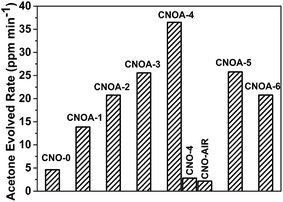 | ||
| Fig. 9 Photocatalytic production of acetone from 2-propanol over different photocatalysts under visible light irradiation (λ > 420 nm). | ||
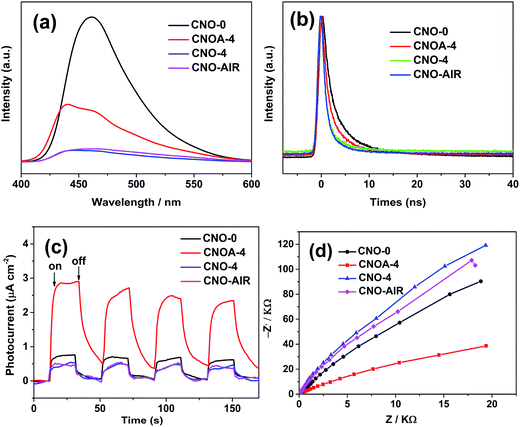
It is well known that aside from specific surface area, the second factor is the separation and recombination rates of the photogenerated electrons and holes in the photocatalysts. This factor conventionally relates to semiconductor photoexcitation, recombination of photoinduced charge carriers, and the transfer of photoinduced charge carriers.5 From the above result of UV-vis, we can know that the quantum size effect of samples could be inhibits the recombination of the photogenerated electrons and holes. Moreover, as a result of the delamination effect, the charge migration distance from bulk to the surface was remarkably reduced, thus reducing their recombination possibility during their migration. To test this deduction, photophysical and photochemical behavior of charge carriers in samples was further explored. Fig. 10a displays the PL spectra of the samples under excitation at 360 nm and at room temperature. The strong emission peak of CNO-0 around 461 nm is derived from the direct electron and hole recombination of band transition. The PL intensity of CNOA-4 is lower than that of pure g-C3N4, which clearly indicates that the recombination of photo-generated charge carriers between the CB-g-C3N4 to the VB-g-C3N4 is greatly inhibited in the CNOA-4. Thus, CNOA-4 exhibited higher photocatalytic activity. But as for CNO-4 and CNO-AIR, it shows a contradictory phenomenon that CNO-4 and CNO-AIR have the weaker PL peak than CNO-0, while with inferior photocatalytic activities. We made a speculation that high carbon content plays a positive role in the above phenomenon. This process can be described as follow, high carbon content decreases the photocatalytic activity because it causes excess defects which will act as recombination centers for photogenerated electrons and holes. In this case, high recombination rates of the photogenerated carriers is supposed to match high intensity of PL spectra, but the absence of additional spectral features in the PL spectra of the samples with high carbon content leads to nonradiative charge transfer process and the quenched for PL spectra.46,47
To further confirm the transfer efficiency of charge carriers in the samples, time-resolved fluorescence spectroscopy were also determined, and the results are shown in Fig. 10b. The change in the tendency of decay time can be clearly identified. The addition of oxalic acid in synthesis processes leads to a decrease in fluorescence lifetime when compared with the pure g-C3N4 sample (5.11 ns). CNO-4 shows the fastest fluorescence decays, which is down to 1.35 ns, about 3.76 ns shorter than that of the pure g-C3N4 (details in Table S2†). Some studies suggest that the decreased lifetime has a negative impact for separation of electrons and holes.21,30
The photoelectrochemical properties of bulk g-C3N4 and porous g-C3N4 nanosheets were studied by measuring their photocurrent and electrochemical impedance responses. As shown in Fig. 10c, the photocurrents were measured during repeated on–off cycles of light illumination with the bias potential applied at 0.6 V versus Ag/AgCl. As can be seen, the photocurrent density was 0.76 and 2.90 μA cm−2 on CNO-0 and CNOA-4, and the photocurrent density of the CNOA-4 electrode is larger than CNO-0, demonstrating that the separation efficiency of the photoinduced electron–hole pairs is improved in CNOA-4, which is due to the unique photophysical properties of the porosity and 2D nanosheets.48 Moreover, similar to the photocatalytic activity, the photocurrent density of the CNO-4 and CNO-AIR are also less than that of pure g-C3N4, because the defects against charge carrier separation. The electrochemical impedance spectrum shown in Fig. 10d, suggests the electron transfer resistance decreased on CNOA-4 which possesses, the smallest diameter of the semicircular Nyquist plots. So, CNOA-4 with improved separation efficiency of the photoinduced electron–hole pairs and electronic conductivity, displayed enhanced photocatalytic activity.
Conclusion
In conclusion, we have demonstrated that the molecular cooperative assembly between melamine and oxalic acid, MO, is a promising precursor material of g-C3N4 enabling simultaneous optimization of the texture and photoelectric properties. The function of the oxalic acid is modifying the thermal condensation model, playing a role as the dynamic gas template and enhancing thermal oxidation etching. This method has the merits of low-cost, easy scale up, and environmental friendliness. The resultant porous nanosheets possess not only a large surface area and thin sheet thickness but also an increased bandgap, which benefit to inhibit the recombination of photogenerated electrons and holes and improve electron transport ability along the in-plane direction due to the quantum confinement effect. As a result, the porous nanosheets as photocatalysts show much superior photocatalytic activities than the bulk g-C3N4.Acknowledgements
This work was supported by the National Natural Science Foundation of China (11274150, 11574124), and the Education Minister of Liaoning Province (JG2016ZD0015). X. X. Fan is indebted to the support from the Program of Liaoning Key Laboratory of Semiconductor Light Emitting and Photocatalytic Materials.Notes and references
- D. Zheng, C. Pang, Y. Liu and X. Wang, Chem. Commun., 2015, 51, 9706–9709 RSC
.
- S. Cao, J. Low, J. Yu and M. Jaroniec, Adv. Mater., 2015, 27, 2150–2176 CrossRef CAS PubMed
.
- X. Wang, K. Maeda, A. Thomas, K. Takanabe, G. Xin, J. M. Carlsson, K. Domen and M. Antonietti, Nat. Mater., 2009, 8, 76–80 CrossRef CAS PubMed
.
- G. Dong and L. Zhang, J. Mater. Chem., 2012, 22, 1160–1166 RSC
.
- G. Dong, W. Ho, Y. Li and L. Zhang, Appl. Catal., B, 2015, 174, 477–485 CrossRef
.
- J. Sun, J. Zhang, M. Zhang, M. Antonietti, X. Fu and X. Wang, Nat. Commun., 2012, 3, 704–707 Search PubMed
.
- D. Zheng, C. Huang and X. Wang, Nanoscale, 2015, 7, 465–470 RSC
.
- X. H. Li, J. Zhang, X. Chen, A. Fischer, A. Thomas, M. Antonietti and X. Wang, Chem. Mater., 2011, 23, 4344–4348 CrossRef CAS
.
- Y. Zheng, L. Lin, X. Ye, F. Guo and X. Wang, Angew. Chem., 2014, 53, 11926–11930 CrossRef CAS PubMed
.
- S. Yang, X. Feng, X. Wang and K. Mullen, Angew. Chem., 2011, 50, 5339–5343 CrossRef CAS PubMed
.
- W. J. Ong, L. L. Tan, Y. H. Ng, S. T. Yong and S. P. Chai, Chem. Rev., 2016, 116, 7159–7329 CrossRef CAS PubMed
.
- L. Jian, H. Wang, P. C. Zu, H. Moehwald, S. Fiechter, R. V. D. Krol, L. Wen, J. Lei and M. Antonietti, Adv. Mater., 2015, 27, 712–718 CrossRef PubMed
.
- Z. Yang, Y. Zhang and Z. Schnepp, J. Mater. Chem. A, 2015, 3, 14081–14092 CAS
.
- W. Shen, J. Mater. Chem., 2011, 21, 3890–3894 RSC
.
- J. Zhang, F. Guo and X. Wang, Adv. Funct. Mater., 2013, 23, 3008–3014 CrossRef CAS
.
- V. Polshettiwar, D. Cha, P. X. Zhang and P. J. M. Basset, Angew. Chem., 2010, 122, 9731 CrossRef
.
- M. Groenewolt and M. Antonietti, Adv. Mater., 2005, 17, 1789–1792 CrossRef CAS
.
- M. Shalom, S. Inal, C. Fettkenhauer, D. Neher and M. Antonietti, J. Am. Chem. Soc., 2013, 135, 7118–7121 CrossRef CAS PubMed
.
- Y. Ishida, L. Chabanne, M. Antonietti and M. Shalom, Langmuir, 2014, 30, 447–451 CrossRef CAS PubMed
.
- Y. S. Jun, J. Park, S. U. Lee, A. Thomas, W. H. Hong and G. D. Stucky, Angew. Chem., 2013, 52, 11083–11087 CrossRef CAS PubMed
.
- Y.-S. Jun, E. Z. Lee, X. Wang, W. H. Hong, G. D. Stucky and A. Thomas, Adv. Funct. Mater., 2013, 23, 3661–3667 CrossRef CAS
.
- Y. Cui, Z. Ding, X. Fu and X. Wang, Angew. Chem., 2012, 51, 11814–11818 CrossRef CAS PubMed
.
- J. Wang, H. Xu, X. Qian, Y. Dong, J. Gao, G. Qian and J. Yao, Chem.–Asian J., 2015, 10, 1276–1280 CrossRef CAS PubMed
.
- J. Gao, J. Wang, X. Qian, Y. Dong, H. Xu, R. Song, C. Yan, H. Zhu, Q. Zhong, G. Qian and J. Yao, J. Solid State Chem., 2015, 228, 60–64 CrossRef CAS
.
- L. I. Huo, F.-H. Liao, J.-R. Li and S. Zhang, Int. J. Mod. Phys. B, 2011, 25, 3271–3279 CrossRef CAS
.
- Y. Zhang, T. Mori and J. Ye, Sci. Adv. Mater., 2012, 4, 282–291 CrossRef CAS
.
- Y. Wang, X. Wang and M. Antonietti, Angew. Chem., 2012, 51, 68–89 CrossRef CAS PubMed
.
- Y. Wang, X. Wang, M. Antonietti and Y. Zhang, ChemSusChem, 2010, 3, 435–439 CrossRef CAS PubMed
.
- X. Han, Y. Wang, J. Lv, L. Kong, L. Tian, X. Lu, J. Wang and X. Fan, RSC Adv., 2016, 6, 83730–83737 RSC
.
- P. Niu, L. Zhang, G. Liu and H.-M. Cheng, Adv. Funct. Mater., 2012, 22, 4763–4770 CrossRef CAS
.
- Q. Gu, Z. Gao, H. Zhao, Z. Lou, Y. Liao and C. Xue, RSC Adv., 2015, 5, 49317–49325 RSC
.
- Y. Li, R. Jin, Y. Xing, J. Li, S. Song, X. Liu, M. Li and R. Jin, Adv. Energy Mater., 2016, 6, 1601273 CrossRef
.
- C. Chang, Y. Fu, M. Hu, C. Wang, G. Shan and L. Zhu, Appl. Catal., B, 2013, 142–143, 553–560 CrossRef CAS
.
- A. P. Dementjev, A. D. Graaf, M. C. M. V. D. Sanden, K. I. Maslakov, A. V. Naumkin and A. A. Serov, Diamond Relat. Mater., 2000, 9, 1904–1907 CrossRef CAS
.
- J. J. Song, Y. Huang, S. W. Nam, M. Yu, J. Heo, N. Her, J. R. V. Flora and Y. Yoon, Sep. Purif. Technol., 2015, 144, 162–167 CrossRef CAS
.
- N. Inagaki and H. Kimura, J. Appl. Polym. Sci., 2008, 111, 1034–1044 Search PubMed
.
- J. J. Li, C. Z. Gu, P. Xu, Q. Wang and W. T. Zheng, Mater. Sci. Eng., B, 2006, 126, 74–79 CrossRef CAS
.
- X. Lu, K. Xu, P. Chen, K. Jia, S. Liu and C. Wu, J. Mater. Chem. A, 2014, 2, 18924–18928 CAS
.
- F. He, G. Chen, Y. Zhou, Y. Yu, Y. Zheng and S. Hao, Chem. Commun., 2015, 51, 16244–16246 RSC
.
- F. He, G. Chen, Y. Yu, Y. Zhou, Y. Zheng and S. Hao, Chem. Commun., 2015, 51, 425–427 RSC
.
- H. Yan, Chem. Commun., 2012, 48, 3430–3432 RSC
.
- X. Fan, J. Gao, Y. Wang, Z. Li and Z. Zou, J. Mater. Chem., 2010, 20, 2865 RSC
.
- X. Li, T. Kako and J. Ye, Appl. Catal., A, 2007, 326, 1–7 CrossRef CAS
.
- X. Fan, Y. Wang, X. Chen, L. Gao, W. Luo, Y. Yuan, Z. Li, T. Yu, J. Zhu and Z. Zou, Chem. Mater., 2010, 22, 1276–1278 CrossRef CAS
.
- X. Han, J. Lü, L. Tian, L. Kong, X. Lu, Y. Mei, J. Wang and X. Fan, Chin. J. Catal., 2017, 38, 83–91 CrossRef
.
- X. Xia, N. Deng, G. Cui, J. Xie, X. Shi, Y. Zhao, Q. Wang, W. Wang and B. Tang, Chem. Commun., 2015, 51, 10899–10902 RSC
.
- V. Gupta, N. Chaudhary, R. Srivastava, G. D. Sharma, R. Bhardwaj and S. Chand, J. Am. Chem. Soc., 2011, 133, 9960–9963 CrossRef CAS PubMed
.
- L. Shi, K. Chang, H. Zhang, X. Hai, L. Yang, T. Wang and J. Ye, Small, 2016, 12, 4431–4439 CrossRef CAS PubMed
.
Footnote |
| † Electronic supplementary information (ESI) available. See DOI: 10.1039/c7ra01205e |
| This journal is © The Royal Society of Chemistry 2017 |

