
 Open Access Article
 This Open Access Article is licensed under a
 Creative Commons Attribution 3.0 Unported Licence
Molecular docking, molecular dynamics simulation, biological evaluation and 2D QSAR analysis of flavonoids from Syzygium alternifolium as potent anti-Helicobacter pylori agents†
Tirumalasetty Muni Chandra Babuad,
Sivarathri Siva Rajeshb,
Baki Vijaya Bhaskara,
Savita Devic,
Aluru Rammohane,
Thirunavakkarasu Sivaramanb and
Wudayagiri Rajendra *a
*a
aBioinformatics Center, Division of Molecular Biology, Department of Zoology, Sri Venkateswara University, Tirupati – 517 502, Andhra Pradesh, India. E-mail: rajendraw2k@yahoo.co.in
bStructural Biology Laboratory, Department of Bioinformatics, School of Chemical and Biotechnology, SASTRA University, Thanjavur, 613 401, Tamil Nadu, India
cPathogen Biology Laboratory, Department of Biotechnology and Bioinformatics, School of Life Sciences, University of Hyderabad, Hyderabad, India
dDepartment of Bioinformatics, DES-Fergusson Centre for Higher Learning, Ranigunta – 517 528, Andhra Pradesh, India
eNatural Products Division, Department of Chemistry, Sri Venkateswara University, Tirupati – 517 502, Andhra Pradesh, India
First published on 27th March 2017
Abstract
The present study was carried out with the specific aim to evaluate anti-Helicobacter pylori (Hp) and urease inhibitory activities of three flavonoids, namely 5-hydroxy-7,4′-dimethoxy-6,8-di-C-methylflavone (1), kaempferol-3-O-β-D-glucopyranoside (2) and kaempferol-3-O-α-L-rhamnopyranoside (3), of Syzygium alternifolium fruits. These flavonoids were examined for anti-H. pylori activity against two Hp strains, Hp 26695 and Hp P12, through a microbroth dilution assay with a time kill kinetics study and also the evaluation of their ability to lower H. pylori colonization with AGS (gastric epidermal cells). In addition, a urease inhibition assay was performed with these compounds, followed by 2D QSAR, molecular docking and molecular dynamics simulations on these compounds with target proteins, urease and cytotoxin associated gene (Cag A). The in vitro studies showed that compounds 2 and 3 show significant anti-H. pylori activity whereas compound 1 exhibits moderate activity when compared to amoxicillin and that these compounds also show strong bactericidal kinetics in a time dependent manner. These compounds potentially reduce the H. pylori colonization with a significant loss of its adhesion with AGS cells and inhibit the Hp urease activity. 2D QSAR analysis reveals that these compounds exhibit an acceptable correlation of RMSE = 0.905 and R2 = 0.820 with the biological assays. The compounds show strong inhibitions by forming H-bonding interactions with the active pocket residues of the target proteins as evidenced by 10 ns molecular dynamics simulations. Hence, the current investigation will provide a new vision for the discovery of potent antimicrobial agents from natural sources against H. pylori infections.
1. Introduction
Helicobacter pylori is a Gram negative, spiral-shaped flagellated microaerophilic bacteria which causes gastric infection, induces gastric pathologies, such as chronic gastritis, peptic ulcer and long term chronic infections, and increases the risk of gastric adenocarcinoma.1,2 The prevalence of H. pylori infection is about 40% in developing countries.3 H. pylori colonizes the surface of the gastric mucosa of human stomachs and it is one of the most adapted microbial pathogen. The rate of colonization of H. pylori varies by geographic location and economic status.4 H. pylori typically infects the individual in early life after colonization of bacteria and can remain dormant for months, years or decades without inducing any noticeable clinical symptoms.5,6H. pylori adapts and resides in the mucous layer and establishes an attachment with gastric epithelial cells which leads to persistent colonization in the stomach and evasion of an immune response. The maintenance of H. pylori mediated chronic inflammation and mechanism of controlling the induction is not well understood.7 The complete eradication of H. pylori colonization and treatment of gastrointestinal disorders usually involves antibiotic therapy with the combination of two or three drugs such as amoxicillin (AMX), clarithromycin (CLR) and metronidazole (MNX)8 and the administration of proton pump inhibitors such as lansoprazole or omeprazole to cure gastrointestinal disorders. The incessant usage of these antibiotics against H. pylori infection leads to the development of resistance and treatment becomes more complicated.
Many bacterial virulent factors such as Cag A (cytotoxin-associated gene A), Vac A (vacuole-associated gene A) and urease have been linked to the development of peptic ulcer diseases and gastric adenocarcinoma. Among these Cag A is considered to be the primary oncogenic protein, associated with the increased virulence and risk of gastric cancer. Cag A, a protein with 120 to 140 kDa encoded by the gene “cag A” in the cag PAI cytotoxin-associated gene pathogenicity island,9 is translocated in the host cell by a type IV secretion system (T4SS) after bacterial attachment.10 The injected Cag A within the host cell is phosphorylated at the tyrosine residue in a small sequence motif of glutamate–proline–isoleucine–tyrosine–alanine (EPIYA) by intracellular tyrosine phosphorylation or a non-phosphorylation pathway and induces cell morphological changes, and is termed as a “humming bird phenotype”.11,12
H. pylori is characterized by significant urease activity that converts urea to ammonia, which counters the stomach acids and creates a neutralizing environment for protecting H. pylori from the acid in the stomach,13 which contributes to the pathogenesis of H. pylori induced peptic ulcers.14 Hence, the specific inhibition of urease activity has been proposed as a possible strategy to eradicate H. pylori colonization.15 Urease (urea amidohydrolase EC 3.5.1.5) is the largest hetero polymeric enzyme, consisting of UreA (Mr 30![[thin space (1/6-em)]](https://www.rsc.org/images/entities/char_2009.gif) 000) and UreB (Mr 66000) subunits and the active site contains two Ni2+ ions.16 The active site amino acids of H. pylori urease are principally conserved in all known ureases. Hence, the catalytic mechanism of the enzyme is believed to be the same.17
000) and UreB (Mr 66000) subunits and the active site contains two Ni2+ ions.16 The active site amino acids of H. pylori urease are principally conserved in all known ureases. Hence, the catalytic mechanism of the enzyme is believed to be the same.17
Enduring usage of synthetic drugs to eradicate H. pylori infections associated with peptic ulcer and gastric cancer are complicated and has significant adverse side effects. Hence, traditional and alternative modes of treatment are now being addressed with the investigation of new sources of drugs or bioactive compounds derived from natural medicinal plants to eradicate H. pylori colonization and to prevent gastrointestinal disorders.
Earlier studies have reported that many natural plant derived extracts/compounds possess anti-ulcer, anti-H. pylori, and anti-gastric cancer activity. Phenolic phytochemicals from oregano and cranberry have been reported to exhibit anti-bacterial activity against H. pylori and its urease and proline dehydrogenase inhibitory activity.18 The ethanolic extract of Rosmarinus officinalis L. was reported to demonstrate anti-gastric ulcer activity against ethanol-induced gastric ulcers in rats.19 Grape extract has been reported to display anti-bacterial activity against H. pylori and eradicate the colonization of bacteria in gastric epithelial cells.20 The antibacterial efficacy of compounds from Indigofera barberi has also been reported against multidrug resistant Gram negative bacterial infections.21
Except for few reports on Syzygium species, no systematic investigations were carried out on Syzygium alternifolium, the endemic plant located in the Seshachalam hill ranges of Tirumala-Tirupati hills of Andhra Pradesh, South India, with particular reference to its anti-H. pylori activity. Keeping in mind the ethnopharmacological importance of natural medicines, the present paper aims to evaluate anti-H. pylori activity of flavonoids (1–3) isolated from S. alternifolium, coupled with in silico analysis using molecular docking and MD simulations.
2. Materials and methods
Chemicals and reagents
Amoxicillin, bovine serum albumin (BSA), fetal calf serum (FCS), horse serum, MTT (3-(4,5-di methyl thiazol 2-thiazol 2-yl)2,5 diphenyltetrazolium bromide) and Hams F12 K media were purchased from Sigma-Aldrich.Plant material
5-Hydroxy-7,4′-dimethoxy-6,8-di-C-methylflavone (compound 1), kaempferol-3-O-β-D-glucopyranoside (compound 2) and kaempferol-3-O-α-L-rhamnopyranoside (compound 3) (Fig. 1) were isolated from the fruits of S. alternifolium as previously described.22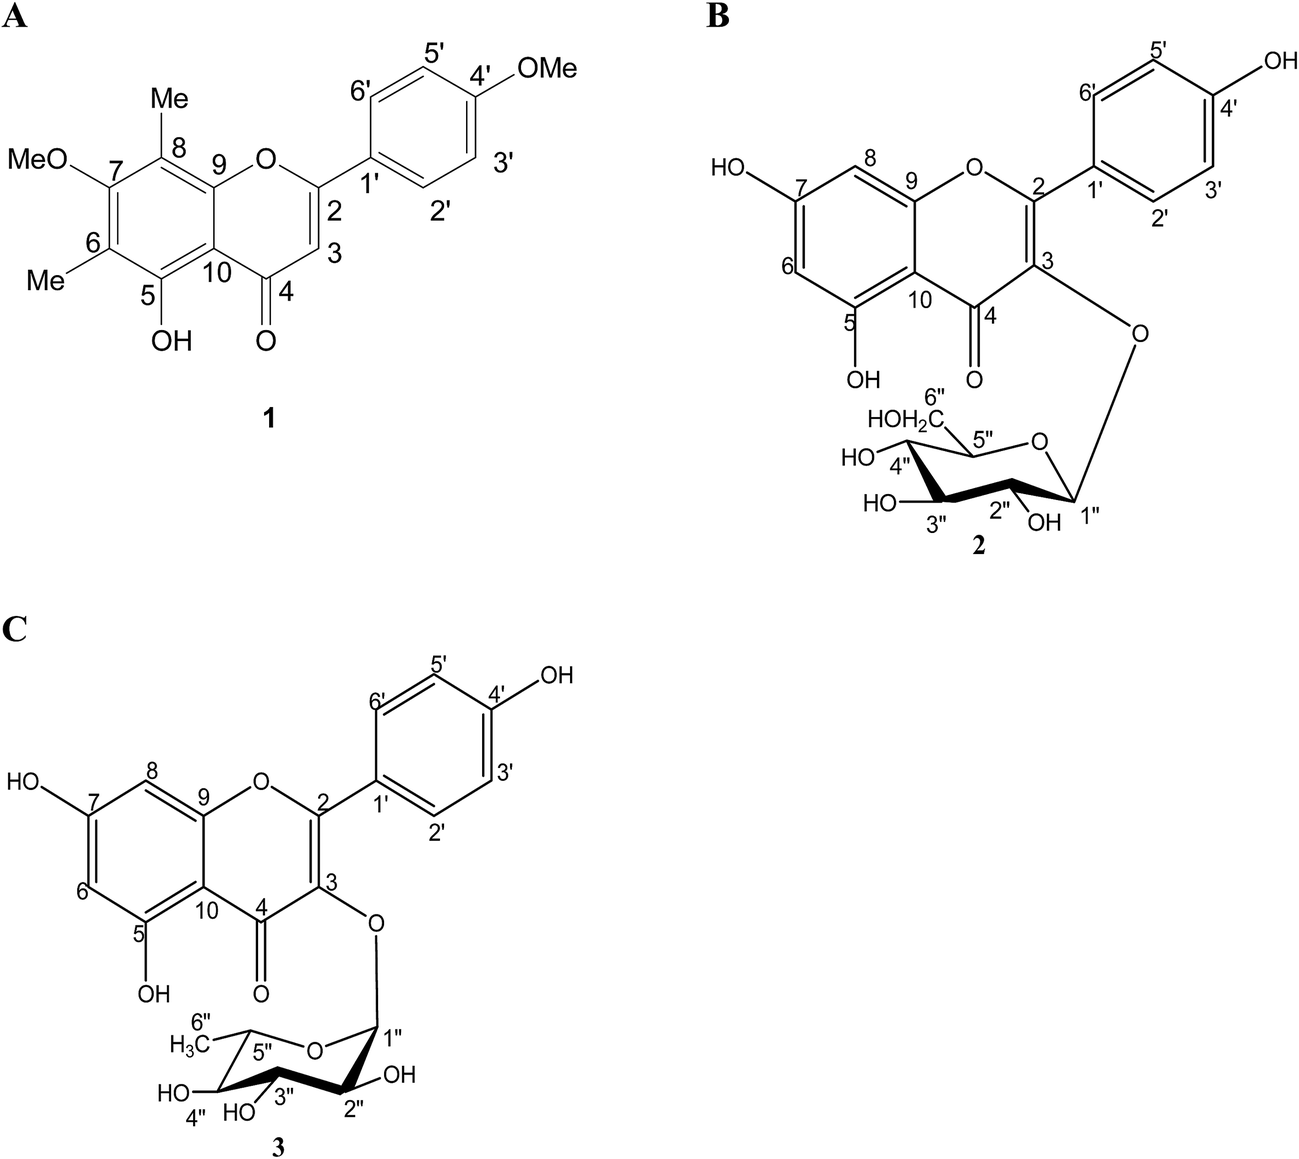 | ||
| Fig. 1 The chemical structures of isolated compounds (A) 5-hydroxy-7,4′-dimethoxy-6,8-di-C-methylflavone (1), (B) kaempferol-3-O-β-D-glucopyranoside (2) and (C) kaempferol-3-O-α-L-rhamnopyranoside (3). | ||
Culture of Helicobacter pylori
H. pylori strains Hp 26695 and Hp P12, were used for in vitro studies routinely cultured either on GC agar plates containing 10% horse serum, supplemented with vancomycin (10 μg mL−1), nystatin (2 μg mL−1) and trimethoprim (2.5 μg mL−1) or brucella broth containing 10% fetal calf serum under a microaerophilic environment (10% CO2, 85% N, 5% O2 and >95% relative humidity) at 37 °C for 48 hours.Cell culture
The AGS (human gastric adenocarcinoma) cell line was procured from the National Center for Cell Sciences, Pune, India. The cells were maintained as a monolayer culture at sub confluence in a 95% air and 5% CO2 humidified atmosphere at 37 °C. Hams F12 K media supplemented with 10% fetal calf serum and 1% penicillin–streptomycin were used for routine sub-culturing and for all in vitro experiments.23Mircobroth dilution assay
H. pylori susceptibility testing was performed using a microbroth dilution assay method with a 96 well micro titer plate. Compounds 1, 2 and 3 were dissolved in 10% DMSO. Sterile double-distilled water was used for further serial dilutions of the dissolved compound with a concentration range of 5–100 μg. The samples were suspended in 100 μL of brucella broth supplemented with 5% fetal calf serum in a 96 well micro titer plate. A 3 day old H. pylori liquid culture was diluted with brucella broth and 100 μL of this was incubated into each well to give a final concentration of 1 × 10⁶ CFU per well. The plates were incubated for 3 days in a microaerophilic atmosphere at 37 °C. Amoxicillin was used as a positive control since H. pylori is susceptible to amoxicillin and 0.9% saline was used as a negative control. After the incubation period, H. pylori growth was assayed by measuring the absorbance at 625 nm. The minimum inhibitory concentration (MIC) was defined as the least concentration in μg to restrict the growth by measuring the absorbance at 625 nm (no macroscopic visible growth).Time dependent killing kinetics
Time dependent killing kinetic analyses of compounds (1–3) against H. pylori strains, Hp 26695 and Hp P12, were performed at 0.5×, 1× and 2× the MIC, as determined previously, and the assay was initiated with a concentration of 1 × 10⁶ CFU per well. After incubation for 6, 12, 18 and 24 hours at different MICs of the compounds, the absorbance was measured at 625 nm. The Hp culture treated without the compound was treated as the control. The experiment was performed in triplicate. The rate and extent of killing were expressed as mean log10 CFU mL−1 against time.Infection of AGS cells with H. pylori culture pre-treated with flavonoid compounds (1–3) from S. alternifolium
H. pylori strains, Hp 26695 and Hp P12, were cultured overnight to get final concentrations of 5 × 10⁵ CFU mL−1 which were pre-treated with compounds 1, 2 and 3 in the concentration range of 5–100 μg mL−1 in a 96 well plate as per the above protocol and incubated for 12 and 24 hours. After the incubation period, the H. pylori culture was centrifuged at 3500 × g for 10 min, the pellet was collected and washed twice with phosphate buffer saline (PBS). The pellet was re-suspended with fresh culture media of brucella broth.AGS cells were grown in Hams F-12 K medium, supplemented with 10% fetal bovine serum, incubated at 37 °C in 5% CO2, 100% humidity and 90% confluence. The cells were washed with PBS (pH 7.4) and detached using 0.25% trypsin–EDTA. AGS cells were coated in a 96-well plate and incubated overnight to allow for adherence. H. pylori cultures (26695, P12) were pre-treated with different concentrations ranging from 5–100 μg mL−1 of amoxicillin as a positive control and PBS as a negative control, which were distributed to each well at a multiplicity of infection (MOI) of bacteria to AGS cell ratio of 100:1. After overnight incubation, the culture medium was replaced with RPMI 1640 and washed with PBS to remove non-adherent cells. AGS cell proliferation was monitored by adding the tetrazolium salt 3-(4,5-dimethylthiazol-2-yl)-2,5-diphenyltetrazolium bromide (MTT) and the absorbance was read at 570 nm using a micro plate reader and standardized against the AGS cell control.
Extraction of H. pylori urease
For the urease inhibition assay, 50 mL of H. pylori broth culture containing 106 cells per mL were centrifuged (5000 × g, 4 °C) for 5 min to collect bacteria and the removed pellet was re-suspended in 30 mM Tris·HCl, (pH 8.1). The resultant suspension was re-centrifuged (10000 × g) at 4 °C for 10 min. The pellet was vortexed with 20% sucrose in Tris·HCl and cells were re-suspended in phosphate buffer at pH 7 and incubated on ice with 30 mg L−1 protease inhibitor for 30 min. Furthermore, these cells were disturbed by sonication for 60 s. Soluble and insoluble fractions were separated by centrifugation for 15 min (15000 × g, 4 °C). The obtained supernatant was used as the H. pylori urease source.
Urease inhibition assay
The reaction mixture, comprising of 25 μL of Hp urease solution, 55 μL of phosphate buffer solution (3 mM, 4.5 pH) and 100 mM urea was incubated with 10 μL of compound in various concentrations (5–100 μmoles) for 15 min at 30 °C in a 96 well micro titer plate. The amount of ammonia produced was used to determine the urease activity by an indophenol method.24 After the incubation period, 40 μL of phenol reagent, containing a mixture of 1% phenol, 0.005% of sodium nitroprusside and an appropriate amount of NaOH, were added to each well.The increasing absorbance at 630 nm was measured using a microplate reader after incubation for 50 min at 37 °C. The percentage of inhibition was calculated from the formula 100 − (OD test well/OD control) × 100. Acetohydroxamic acid (AHA) was used as the standard inhibitor.
2D QSAR study
Quantitative structure activity relationship (QSAR) is an application of combinatorial chemistry to analyze experimental data and build numerical models of the data for prediction and interpretation. 2D QSAR analysis was performed for 19 flavonoid compounds collected from literature, and their biological activity corresponding to Hp urease was collected from the literature,25and compounds 1–3 using the QuaSAR module in the MOE. The QSAR model was constructed for the above compounds with selected 2D descriptors (molecular weight, clogP, HBA, HBD, rotatable bonds, molar refractivity and TPSA) from the QuaSAR descriptor panel. The experimentally measured pIC50 for compounds 1–3, the 19 flavonoids and the control drug, AHA, against H. pylori urease were entered manually as activity fields. The regression analysis was performed; the RMSE and R2 values were derived from the QuaSAR fit. $PRED descriptor is the dependent variable for the activity field pIC50 generated by QuaSAR validate.
A QSAR correlation plot was generated by plotting the values of pIC50 on the x-axis and the predicted values ($PRED) on the y-axis for all the above compounds. Furthermore, in order to identify active compounds in the data set “QuaSAR Contingency” application was implemented and followed by principal component analysis (PCA) by plotting a 3D graphical scatter plot with three vector values.
ADME prediction
The bioavailability of flavonoid compounds was assessed through the prediction of adsorption, distribution, metabolism and excretion (ADME) properties using the online server preADMET (http://preadmet.bmdrc.org/).26 In this study we chose the properties human intestinal absorption (HIA), in vitro Caco-2 (colon adeno carcinoma) cell permeability, in vitro MDCK (Madin–Darby canine kidney) cell permeability, in vitro plasma protein binding and in vivo BBB (blood–brain barrier) penetration to be predicted in this program.Homology modeling of Cag A
The oncogenic protein, Cag A (accession no. 400261222), of H. pylori was modeled with the selected template structure, N-terminal of Cag A protein ABC crystal (PDB ID. 4DVY), through a homology based method using Modeller 9.12v.27 Since no complete crystal structure was available to carry out MD simulations due to the intrinsically disorder nature, the final obtained model was used for the evaluation of the stereochemical quality by various structure validation programs. PROCHEK was used to verify the stereochemical quality of amino acids in a given PDB structure through Ramachandran plot calculations.28 ERRAT, a program used to analyze the statistics of non-bonded interactions between atom types and plot values of the error function verses residues in a sliding window,29 Verify 3D, a program adopted to analyze the compatibility of an atomic model (3D) with its own amino acid sequences, where each residue is assigned a structural class based on its local and environment (beta, loop, polar, non-polar etc.).30Molecular docking analysis
Molecular docking studies were carried with H. pylori urease and the modeled Cag A protein with compounds 1–3, the reference drug, acetohydroxamic acid, and the antibiotic, amoxicillin, using the docking module implemented in MOE 2010.12 (Molecular Operating Environment).31 Initially the protein structures were protonated with the addition of polar hydrogens, followed by energy minimization with the MMFF94x force field, in order to get the stable conformer of the proteins. Flexible docking was employed, the inhibitor binding site residues were softened and highlighted through the “Site Finder” module implemented in the MOE software. The grid dimensions (Å) were predicted as X: 39.27, Y: 29.13, Z: 28.51 and X: 27.84, Y: 25.0, Z: 30.89 for urease and Cag A respectively. The docking was carried out with the default parameters i.e., placement: triangle matcher, recording 1: London dG, refinement: force field, and a maximum of 10 conformations of each compound were allowed to be saved in a separate database file in a .mdb format.After the docking process, the binding energy and binding affinity of the protein–ligand complexes were calculated using a molecular mechanics generalized Born interactions/volume integral (MM-GB/VI) implicit solvent method in the LigX module implemented in MOE.32
Molecular dynamics simulations
A 10 ns molecular dynamics simulation was performed using GROMACS 5.0.233 with the AMBER 99SB-ILDN force field.34 MD simulations of the protein–ligand complexes were performed to elucidate the facts behind the effectiveness of these compounds in the inhibition of Cag A. The protein topology for Cag A was created in the Gromacs program, the ligand topology parameterization of compounds 1–3 and selected hits were performed using the PRODRG2 server.35 The unliganded Cag A, as well as Cag A liganded with compounds, was immersed in the center of a cubic box of a simple point charge (SPC) water model,36 with a minimum distance of 1.0 nm between the wall and any part of the protein set up at the initial stage of the simulation. The solvated system was neutralized with an aqueous environment of 0.1 M ionic strength by the addition of Na+ (sodium) and Cl− (chloride). The minimized system was then heated to desired temperatures for 1 ns under an isothermal ensemble by soft coupling with the Berendsen thermostat (NVT).37 The van der Waals cutoff was 14 Å. The integration time step was 1 femtosecond (fs), with the neighbor list being updated every fifth step using the grid option and a cutoff distance of 12 Å. Periodic boundary conditions were used with a constant number of particles in the system, constant pressure, and constant temperature simulation criteria (NPT). In this simulation, the systems were coupled with Parrinello–Rahman barostat38 to equilibrate at 1 bar pressure for 1 ns. Production simulations of 10 ns were performed. In total five simulations were performed and are represented as follows.
(1) Cag Aa: model structure of Cag A without ligand.
(2) Cag Ab: model structure of Cag A complexes with compound 1.
(3) Cag Ac: model structure of Cag A complexes with compound 2.
(4) Cag Ad: model structure of Cag A complexes with compound 3.
(5) Cag Ae: model structure of Cag A complexes with amoxicillin.
All the MD runs were executed on an Intel xenon processor with 8 GB RAM, running an Ubuntu v14.041 Linux operating system on a HP Z230 workstation, Bioinformatics Infrastructure Facility, Department of Zoology, Sri Venkateswara University, Tirupati, India.
3. Results and discussion
Microbroth dilution assay
The anti-H. pylori activity was determined for compounds 1–3 through a microbroth dilution assay against two clinical isolations of H. pylori, strains Hp 26695 and Hp P12. The Minimum Inhibitory Concentration at 50% (MIC50) in μg mL−1 of the compounds was calculated against the above H. pylori strains. The results showed that compound 1 has moderate inhibition on both the strains of H. Pylori with a MIC50 of 54.5 ± 5.4 and 64.8 ± 4.9 μg mL−1, respectively. Compound 2 has significant inhibition of the growth of Hp 26695 and Hp P12 strains of H. pylori with a MIC50 of 36.7 ± 5.4 and 37.6 ± 3.2 μg mL−1, respectively. Similarly, compound 3 showed significant bactericidal activity against H. pylori strains of Hp 26695 and Hp P12 with a MIC50 of 46.2 ± 5.2 and 52.53 ± 10.2 μg mL−1, respectively, with reference to the positive antibiotic amoxicillin with a MIC50 of 18.2 to 23.4 μg mL−1.Previous reports on other polyphenols such as quercetin, protocatechuic acid, naringene and epicatechin have shown a marked effect on H. pylori growth. Quercetin has shown a MIC value in the range of 124–64 μg mL−1,39 whereas protocatechuic acid, naringene and epicatechin have shown MIC values of 128, 256 and 512 μg mL−1, respectively.40
The overall results reported in the present study show that the natural flavonoids (1–3) derived from the traditional medicinal plant S. alternifolium are effective against H. pylori growth when compared to earlier studies.
Killing kinetics
The rate and extent of killing of H. pylori by compounds 1, 2 and 3 were assessed against Hp strains 26695 and P12 at various time intervals viz., 0, 6, 12 and 18 and 24 hours, to monitor their effectiveness as bactericidal agents. An initial stock culture consisting of 1 × 10⁶ CFU mL−1 was used for the time dependent kinetic studies.The control group showed slow growth up to 12 h, thereafter it showed exponential growth up to 24 h and reached ∼1 × 10⁸ CFU mL−1. From the time dependent kinetic study, we observed that the compounds exhibited a marked effect on both of the strains of H. pylori. Compound 1 at 0.5× MIC showed no significant effect on Hp 26695 up to 18 h and thereafter it showed a slow decline up to 24 h. At 1× and 2× the MICs it showed a moderate effect and the rate of killing also increased with the increase in incubation time and reached ∼1 × 10³ and ∼1 × 10² CFU mL−1, respectively. Compound 2 at 0.5× MIC showed mild activity. At 1× MIC it showed significant bactericidal activity and the rate of killing gradually increased with increasing time. Complete killing occurred at 2× MIC after 24 h (Fig. 2A–C).
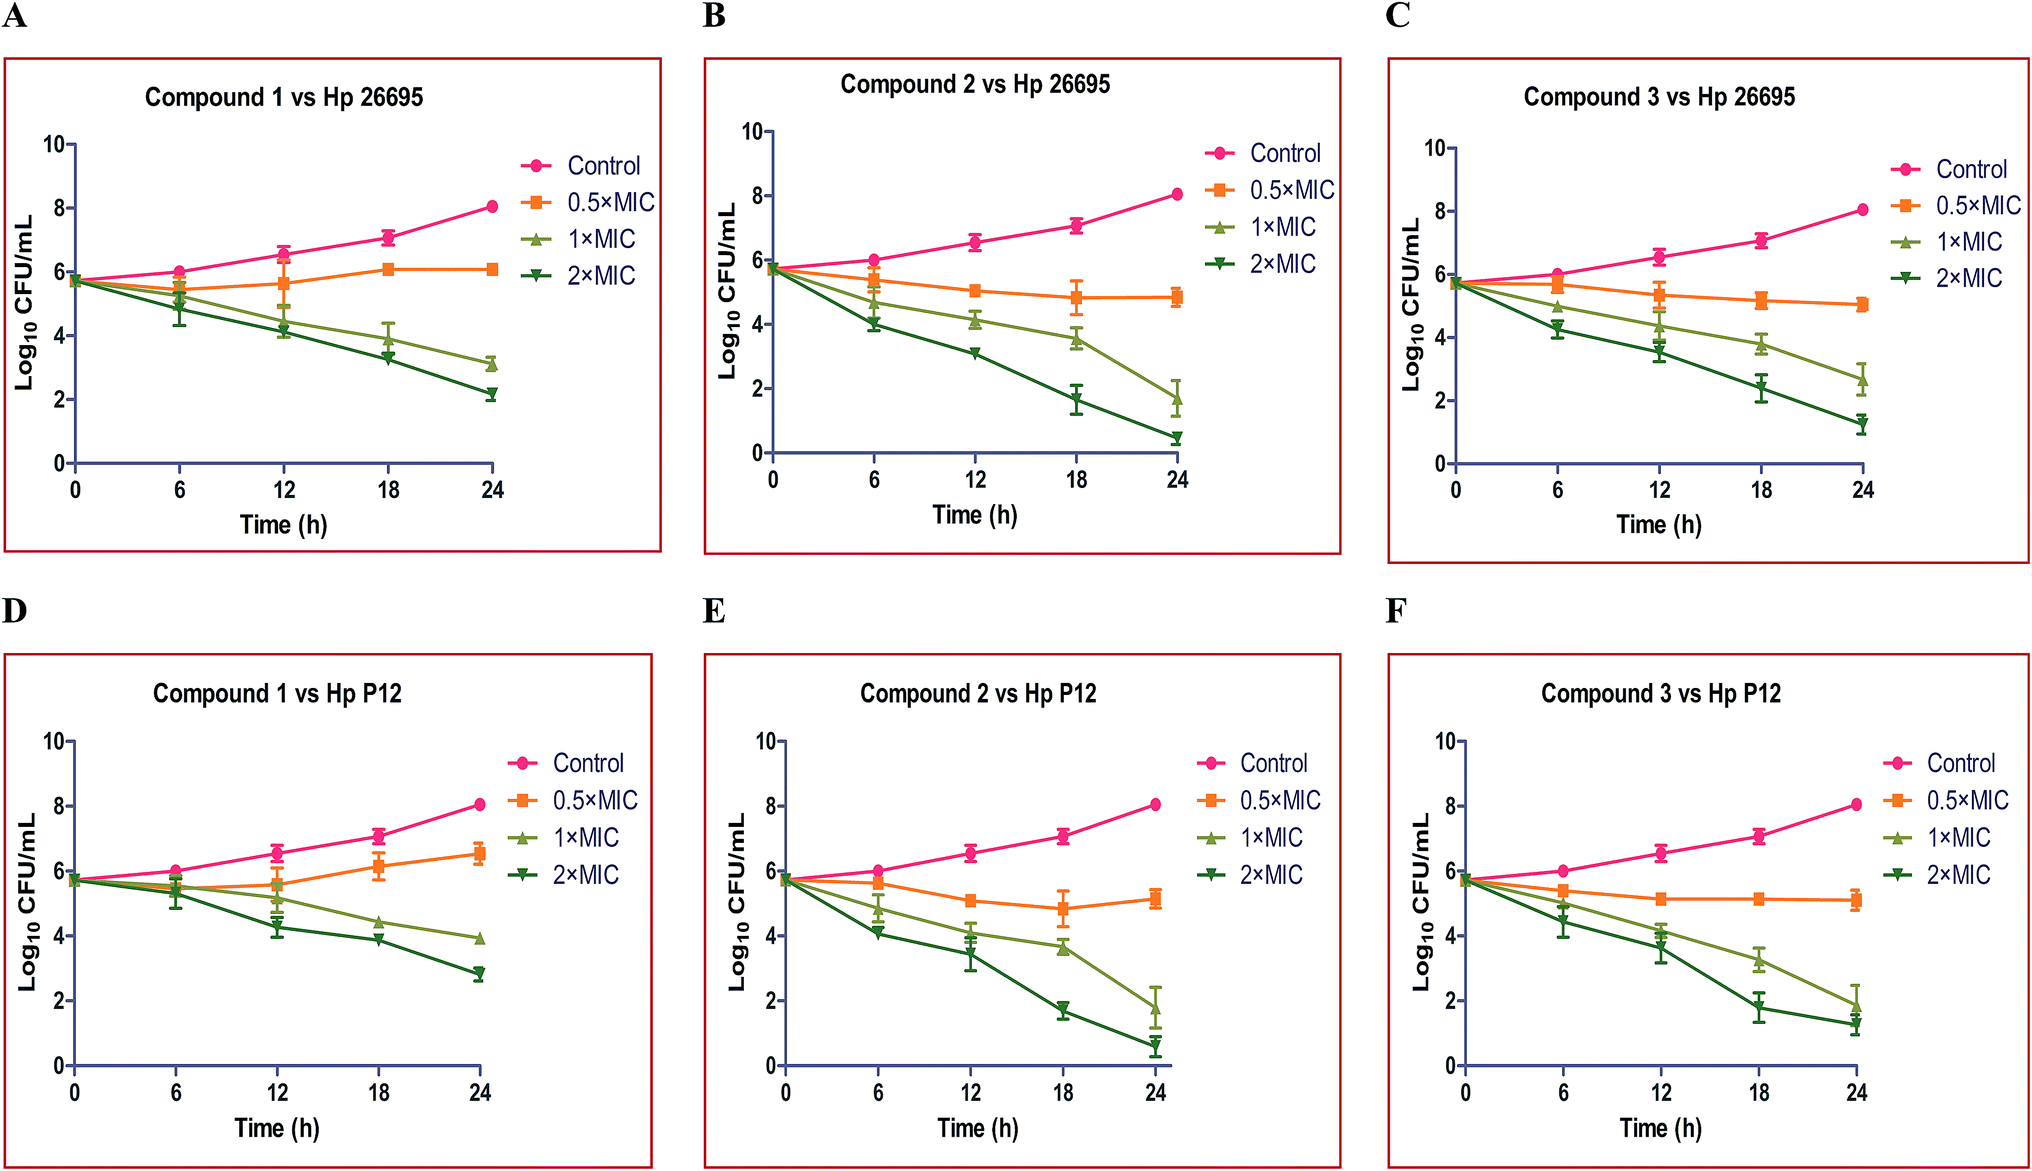 | ||
| Fig. 2 Time course kinetics of the bactericidal activity of compounds 1, 2 and 3 on H. pylori 26695 (A, B and C) and H. pylori (D, E and F) strains after exposure to 0.5×, 1× and 2× the MIC of the particular compound and the control group treated with normal saline. | ||
Time–kill curves were also performed for these compounds against the Hp P12 strain. Compound 1 at 0.5× MIC showed no significant activity throughout the 24 h incubation and it showed modest activity at 1× and 2× the MIC. Compounds 2 and 3 showed a more or less similar kind of killing kinetics at 0.5×, 1× and 2× the MIC, as shown in Fig. 2D–F.
Eradication of the H. pylori colonization
Compounds 1–3 were evaluated for their ability to eradicate H. pylori colonization with AGS gastric epithelial cells. AGS cell growth was monitored after the addition of the H. pylori culture pre-treated with compounds 1, 2 and 3 in concentrations of 25, 50, 75 and 100 μg mL−1 and incubated for 12 and 24 hours. The results showed that treatment with compounds 1–3 significantly decreased the H. pylori attachment with AGS cells when compared with the control, which caused increased cell proliferation. In this study, compound 3 was more effective against H. pylori and increased the AGS cell proliferation in in vitro tests with 84.2 ± 4.0 and 83.7 ± 3.0% of cell growth at 12 hours. Similarly 90.3 ± 2.0 and 88.0 ± 4.0% cell growth against Hp 26695 and Hp P12 stains, respectively, were seen for 24 hours incubation (Table 1). Hence, all these compounds have shown anti-H. pylori activity and reduced the H. pylori colonization with gastric epithelial cells in a dose-dependent manner. Compound 1 exhibited moderate anti-H. pylori activity by eradicating the H. pylori population in the AGS cell line and compounds 2 and 3 showed significant inhibition of the H. pylori growth in AGS cell lines (Fig. 3).| S. no | Concentration in μg | % AGS cells proliferation at different time intervals | |||
|---|---|---|---|---|---|
| 12 hours | 24 hours | ||||
| 26695 | P12 | 26695 | P12 | ||
| a The assay was performed in triplicate and values are reported as mean ± SD. | |||||
| Compound 1 | 25 | 18.6 ± 1.5 | 19.5 ± 1.5 | 24.4 ± 5.2 | 24.4 ± 1.7 |
| 50 | 42.2 ± 3.6 | 31.3 ± 3.6 | 51.8 ± 5.7 | 35.4 ± 2.4 | |
| 75 | 60.2 ± 2.1 | 47.5 ± 3.0 | 69.3 ± 6.3 | 50.8 ± 2.0 | |
| 100 | 78.0 ± 1.6 | 72.6 ± 4.5 | 78.6 ± 1.5 | 76.9 ± 1.5 | |
| Compound 2 | 25 | 32.3 ± 3.9 | 34.8 ± 1.6 | 41.7 ± 3.1 | 41.3 ± 2.7 |
| 50 | 43.7 ± 5.2 | 51.0 ± 2.1 | 54.1 ± 4.4 | 53.4 ± 3.5 | |
| 75 | 65.4 ± 4.1 | 74.5 ± 3.3 | 67.6 ± 2.9 | 76.1 ± 3.3 | |
| 100 | 70.3 ± 1.9 | 80.5 ± 0.7 | 79.2 ± 1.0 | 84.4 ± 1.9 | |
| Compound 3 | 25 | 38.5 ± 1.5 | 33.8 ± 1.2 | 42.4 ± 1.7 | 42.3 ± 2.5 |
| 50 | 49.8 ± 3.7 | 51.7 ± 3.1 | 53.4 ± 3.3 | 57.2 ± 1.2 | |
| 75 | 60.6 ± 1.5 | 64.8 ± 1.7 | 63.3 ± 4.4 | 67.4 ± 2.4 | |
| 100 | 84.2 ± 4.0 | 83.7 ± 3.0 | 90.3 ± 2.0 | 88.0 ± 4.0 | |
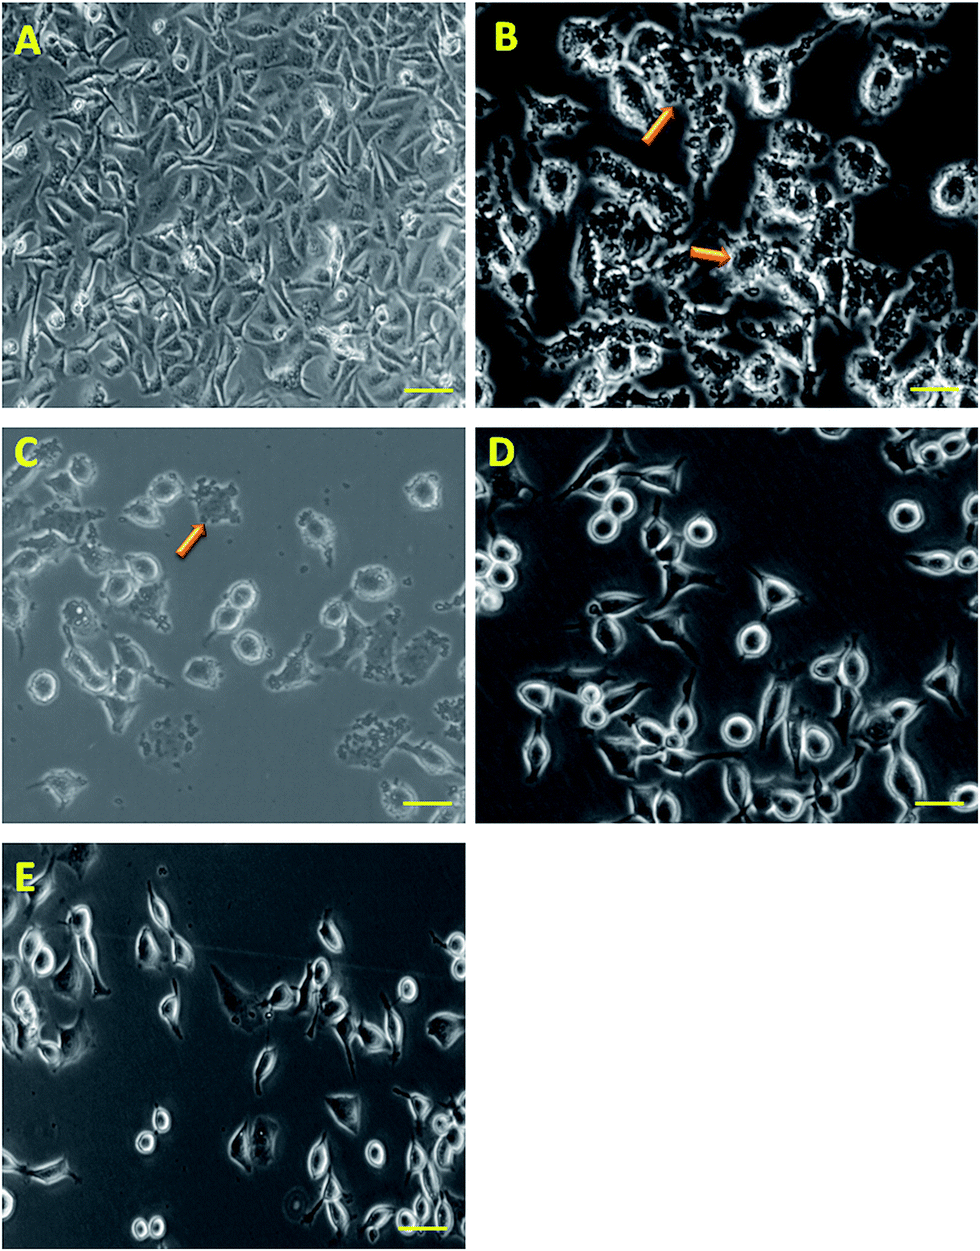 | ||
| Fig. 3 Infection of AGS cells with H. pylori culture and pre-treated with compounds 1, 2 and 3 (C, D and E) and the infection with the H. pylori culture without treatment (B), AGS cells without infection treated with normal saline (A) at 37 °C in an atmosphere of 5% CO2. The morphological changes in the AGS cells were observed under light microscopy at 100× magnification, scale bar = 20 μm. | ||
It is well documented that bacteria attaches to gastric epithelial cells, which is considered to be the first step of H. pylori-induced gastritis/gastric cancer. The reduced proliferation of H. pylori in the AGS cell line during the treatment with these compounds might be attributed to the interference of these compounds in the mechanism of adhesion of bacteria with the AGS cells by inhibiting the factors involved in adhesion. It is also recorded that the pre-treatment of the H. pylori culture with the compounds caused a significant loss of attachment of H. pylori to AGS cells in a concentration dependent manner. In addition, it is also observed that the rate of AGS cell proliferation is directly proportional to the concentration of the compounds resembling the control (without H. pylori treatment) which suggests that higher concentrations of compound reduced the influence of H. pylori on the AGS cell proliferation.
Urease inhibition assay
Though H. pylori is not acidophilic, the bacteria can colonize the highly acidic gastric environment due to the secretion of the enzyme urease, which produces ammonia through the hydrolysis of urea. Hence, it has the ability to neutralize the gastric acids with ammonia, which provides a congenial environment for its survival in the acidic environment of the gastric mucous layer of stomach. Due to the significant virulent character of urease, many researchers have targeted and focused on Hp urease inhibition with novel synthetic or natural anti-H. pylori/anti-urease drugs.41In the current study we have evaluated the inhibitory properties of anti-H. pylori urease for the isolated flavonoids (1–3) from S. alternifolium through the urease inhibition assay using an indophenol method. The bioassay results showed that all the three compounds have shown inhibition on Hp urease in a dose-dependent manner. The results demonstrated that compounds 2 and 3 have significantly inhibited H. pylori urease, with IC50 values of 28.2 ± 4.8 and 46.4 ± 2.8 μmoles respectively, while compound 1 showed moderate urease inhibition with an IC50 value of 55.62 ± 3.8 μmoles when compared to the positive control reference drug AHA with IC50 value of 19.4 ± 2.6 μmoles.
Earlier studies on quercetin against Hp urease have shown a marked inhibition of urease activity with an IC50 of 11.2 μM, whereas kaempferol has shown an IC50 of 105 μM.25 In the present study the conjugated sugar moiety in compounds 2 and 3 has enhanced the urease inhibition twice when compared to aglycone kaempferol.
2D QSAR analysis
In order to validate the in vitro bioassays and docking studies on Hp urease, the 2D QSAR analysis was performed to identify potential ligand molecules. The 2D QSAR model was constructed for these compounds with experimentally derived pIC50 values, system predicted pIC50, $PRED and standard 2D descriptors. Furthermore, the regression graph was plotted for pIC50 vs. $PRED. A linear correlation resulted from the regression analysis for all the compounds against H. pylori urease and it exhibited excellent linearity [$PRED = 0.937 (pIC50) + 0.248] with RMSE = 0.905, R2 = 0.820 (Fig. 4A).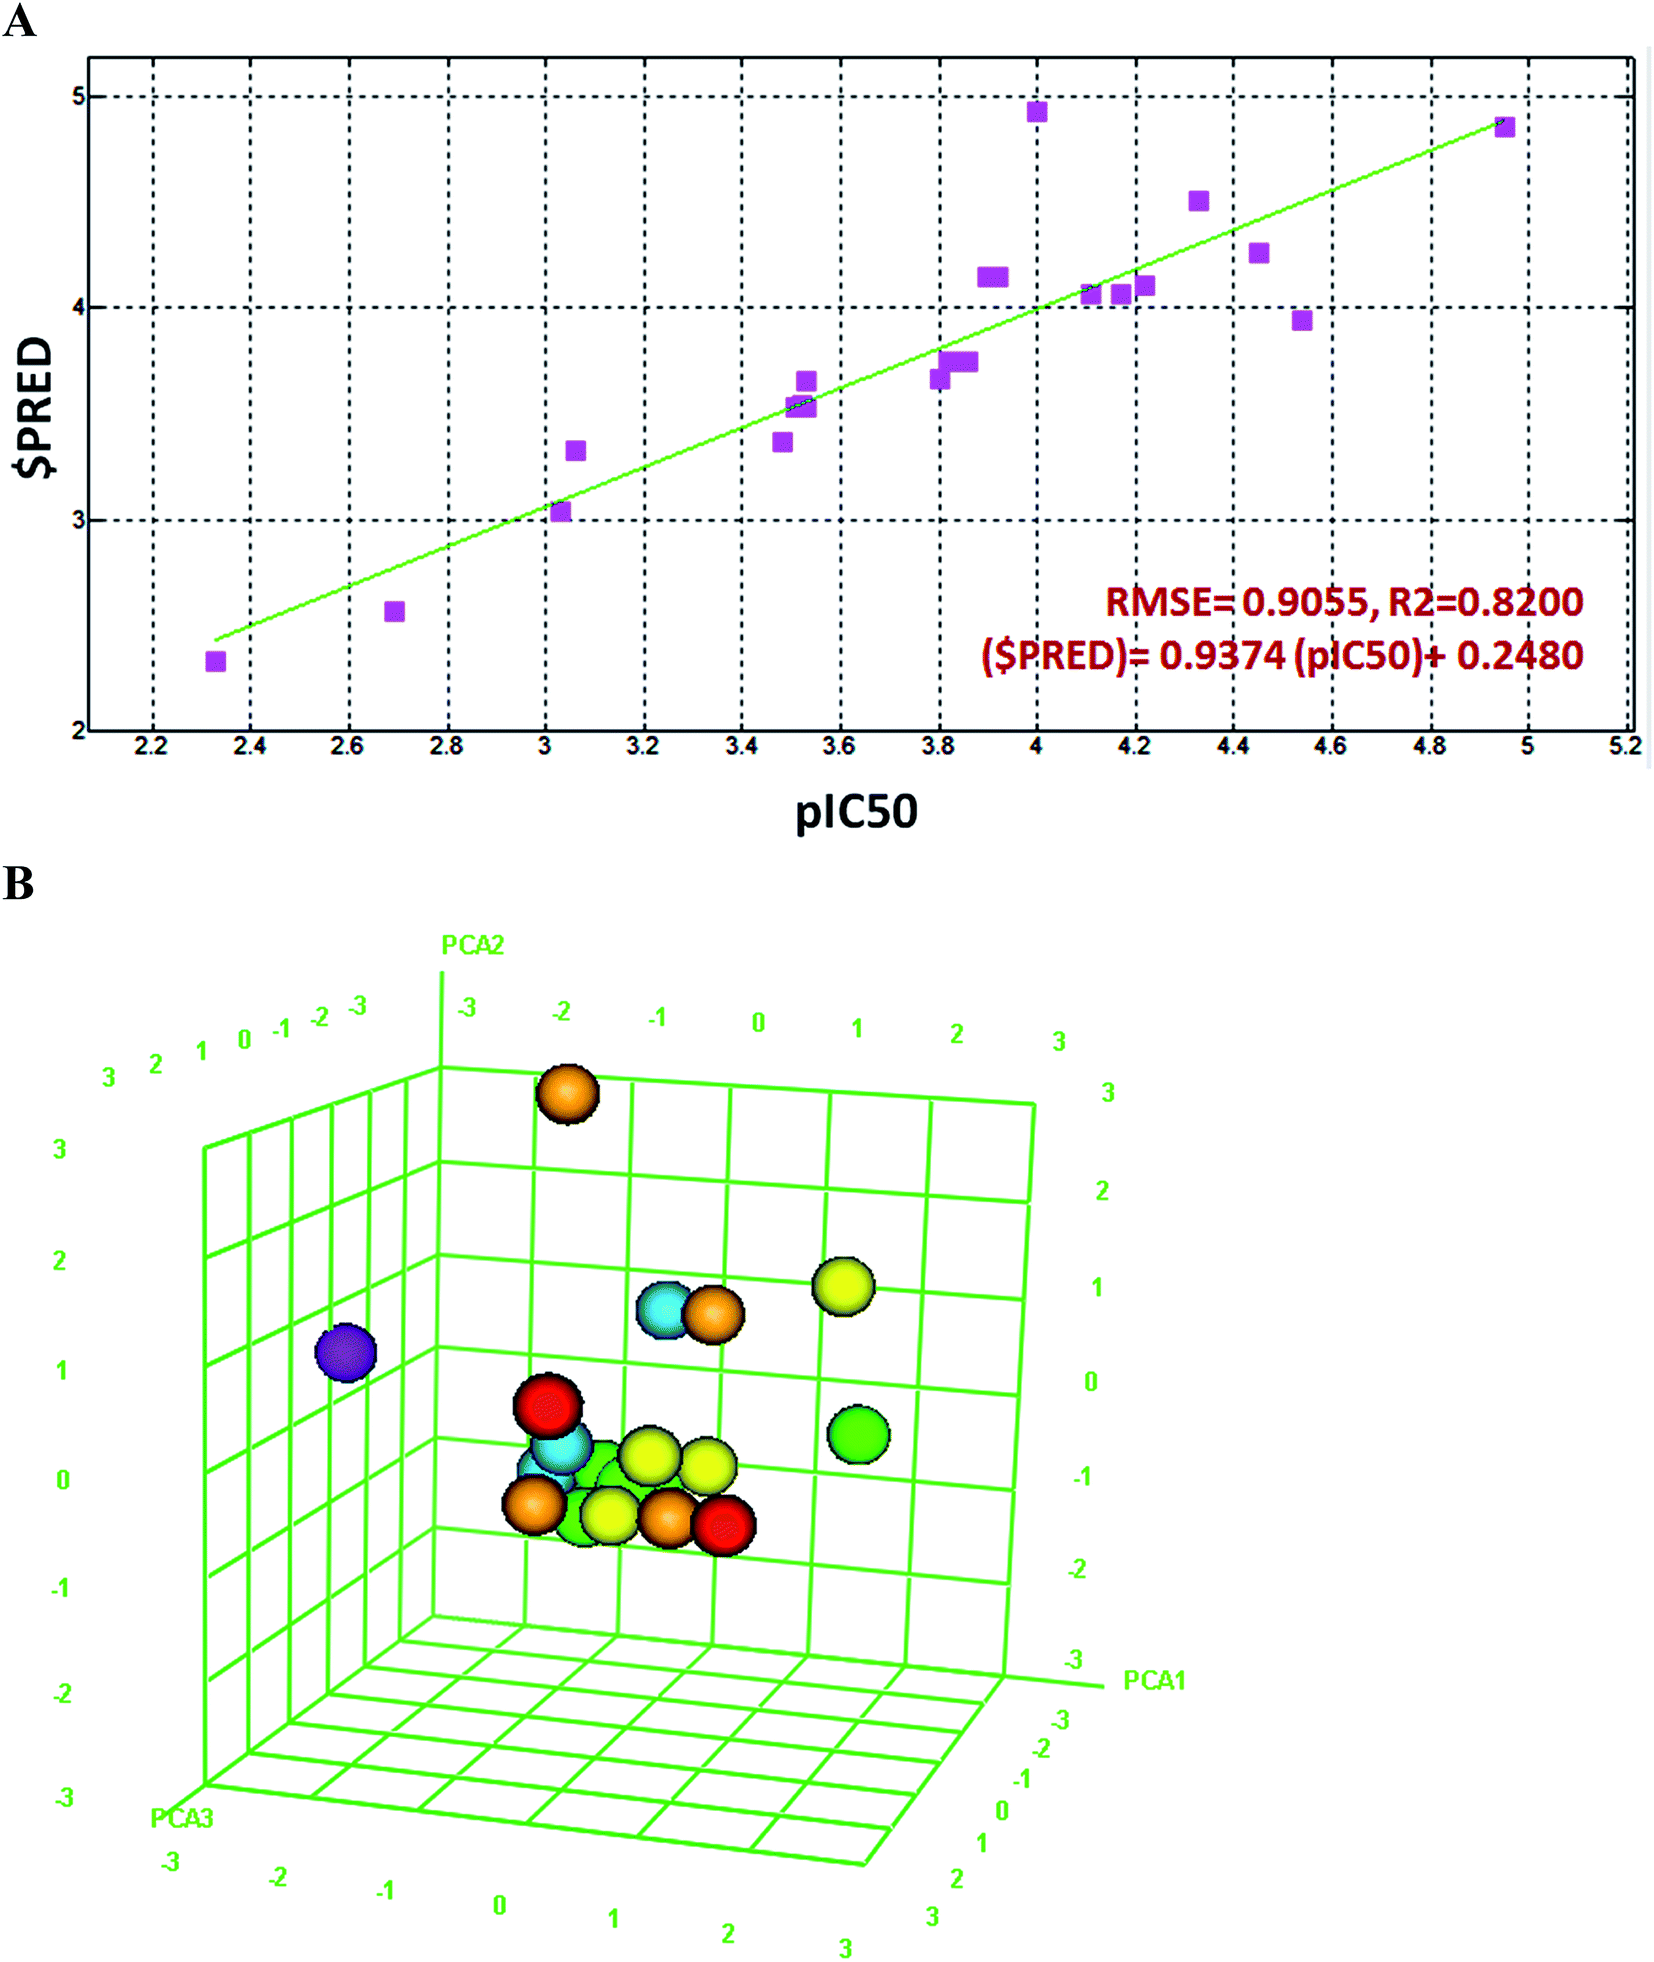 | ||
| Fig. 4 (A) Linear correlation graph of experimentally measured pIC50 values of compound 1–3, 19 flavonoids and reference drug, acetohydroxamic acid, against H. pylori urease enzyme. The linearity of 2D QSAR model was shown with error value (RMSE) and correlation actor (R2) (B) Principal Component Analysis (PCA) plot of all these compounds, 3D graphical plot was constructed with three eigenvectors PCA1, PCA2 and PCA3 in the range of −3 to +3 and coordinate value of each compound is represented with a colored spot. | ||
The Z-Score was predicted for all the compounds, wherein a Z-score value of 2.5 and above can be considered to indicate the molecules which are outliers to the fit. Compounds 2 and 3 showed significant Z-scores of 0.614 and 1.478 respectively. Compound 1 had a moderate value of 2.095 when other flavonoids were collected from literature (Table S1†).
Principal component analysis was carried out using three eigenvectors, viz. PCA1, PCA2 and PCA3, and a 3D graphical plot was created, which included 98% of variance. In the plot, all the values were found to lie in the range of −3 to +3 and are shown with different colored spots which correspond to the pIC50 of compounds (Fig. 4B).
Bioavailability
Pharmacokinetic studies and ADME properties are important conditions and major factors for the evaluation of bioavailability of compounds. Whatever compound is designed/isolated that is going to be a drug, it should satisfy the ADME properties and only then will it be approved as drug in clinical trials.In the present study, the bioavailability was assessed for 19 flavonoids and compounds 1–3 by calculating the properties, viz., human intestinal absorption (HIA), in vitro Caco-2 permeability, in vitro MDCK cell permeability, in vitro plasma binding protein and in vivo blood brain barrier (BBB) penetration. The results showed that all the compounds have a good HIA percentage, among them compound 1 showed the highest HIA of 95.97%. All the compounds showed medium Caco-2 cell permeability, among them tangeretin, compound 1, liquiritigenin, compound 2 and naringenin showed satisfactory values of 53.60, 42.68, 21.04, 11.45 and 10.52 nm s−1, respectively. Many of the compounds have medium MDCK permeability, among them luteolin and baicalein have the highest values of 182.90 and 101.90.
The binding of the drug with plasma proteins has greatly influenced drug availability and drug action. Usually, the unbound drug with plasma proteins will be easily diffuse or transport across the cell membrane and be available for interacting with the specific molecular target. The compounds, liquiritigenin, naringenin, and luteolin show a strong binding to plasma proteins of 100% and dihydromyricetin, baicalein, myricetin, apigenin, chrysin, quercetin and compound 1 have satisfactory values of 99.90, 98.98, 96.98, 97.25, 95.04, 93.23 and 90.51% respectively. The compounds, compound 1, 2, myricitrin and hesperetin show weak binding to plasma proteins, 57.17, 65.99, 65.41, 68.721% respectively, and rest of the compounds have moderate binding.
In addition, in vitro BBB penetration capacity was predicted for all the compounds, showing medium absorption to the central nervous system (CNS). Many of the compounds have shown moderate absorption, among them liquiritigenin, chrysin and luteolin have shown significant values of 1.786, 0.935 and 0.873, respectively. Whereas low absorption to the CNS was observed for formononetin, hesperetin, myricitrin, tangeretin, luteolin glycoside, and compound 2 and 3 with values of 0.063, 0.086, 0.035, 0.027, 0.035, 0.036 and 0.042, respectively. All the predicted ADME values are summarized in the Table S2.†
Some of the natural compounds have shown low bioavailability and also reported marked bioactivity and binding affinity with target proteins. Natural products and their derivatives are structurally complex, planner and cover a much larger space and also have more chiral centers, rings and functional groups, which allow for higher bioactivity. These features are not satisfied by combinatorial and synthetic compounds even though they satisfied all ADME conditions.
Molecular modeling and docking analysis
The constructed model of H. pylori Cag A has been verified through the PROCHECK server. The results showed that 90.5, 8.2, 0.4 and 1.0% of residues are located in most favored, additional, generously allowed and disallowed regions, respectively. The environmental profile for Cag A was computed with verify 3D, which showed that it was mostly above zero, 70%. The non-bonded interactions between the atoms were also computed with the ERRAT program, which showed the overall quality factor of 75.54 (Fig. 6).In order to strengthen the in vitro bioassay, docking analysis was carried out for compounds 1, 2 and 3 with selective pharmacological targets such as urease and cytotoxin-associated gene A (Cag A) protein of H. pylori which are involved in the pathogenesis and induction of gastric adenocarcinoma.
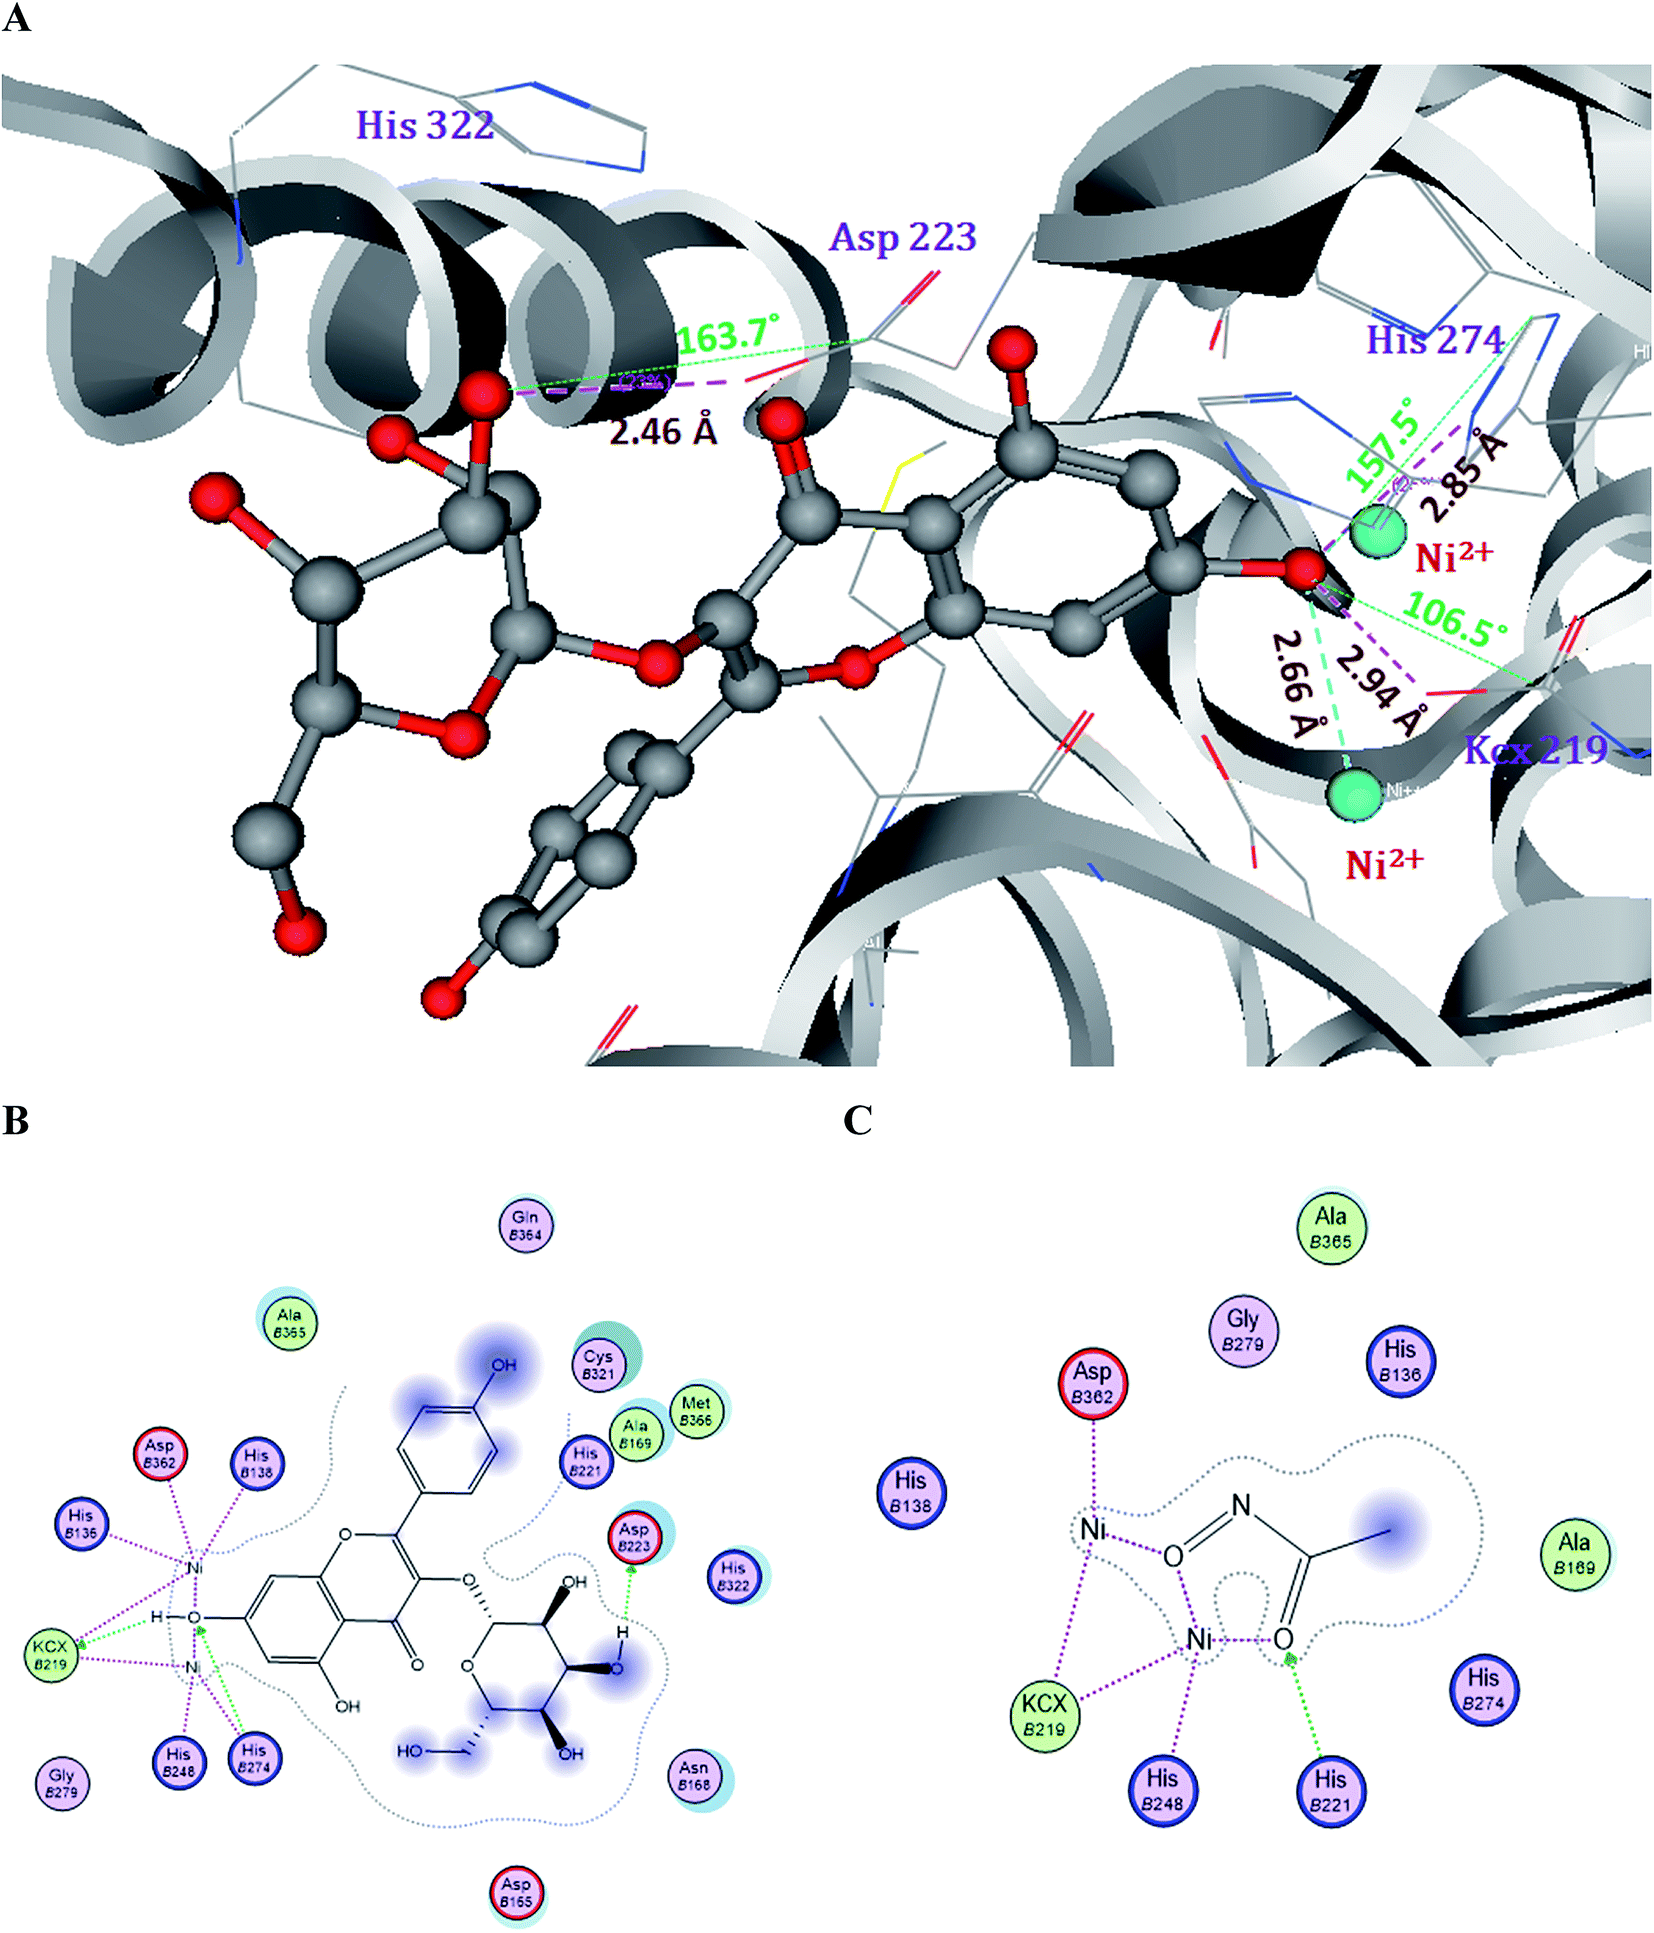
The crystal structure of H. pylori (PDB id: 1E9Y) was retrieved from the protein data bank, it has complexes with the reference drug acetohydroxamic acid (AHA). The active pocket of urease is assembled with basic and polar amino acids, two Ni2+ ions, one of which forms ionic bonds with Asp362 and KCx219, and the second Ni2+ ion interacts with His248 and KCx219. These supramolecular assemblies of the enzyme will offer protection from acid inactivation by hydrolyzing urea and produce ammonia, which develops a neutral coating over the molecular surface. The reference drug AHA interacts with the helix–turn–helix motif and it opens the active site when the inhibitor is bound and closes it in the absence of inhibitor.42 AHA forms one H-bond with His221 by accepting an electron pair and two ionic bonds with two Ni2+ ions. In the low physiological pH conditions (pH 3), the Ni-chelating histidine residue is protonated at the epsilon and delta positions of the imidazole ring, which triggers the dissociation of the nickel ions from the catalytic site and is attributed to the loss of enzyme.43
The docking results of Hp urease showed that compounds 2 and 3 have significant binding modes, with dock scores of −36.5 and −34.62 respectively, and compound 1 has a moderate dock score of −14.5, when compared with the control drug acetohydroxamic acid.
Compound 2 forms three H-bonds and one ionic bond with the Ni2+ ions in the active site of Hp urease. Among them, the 7-OH of compound 2 forms two H-bonds, one with OQ of KCx219 and another one with NE of His274 by donating an electron pair. The 3′′-OH of the glucose moiety in compound 2 forms one H-bond with OD of Asp223 by donating an electron pair (Fig. 5).
 | ||
| Fig. 5 Molecular and Lig plot interactions of compound 2 (A and B) with the active site residues of H. pylori urease enzyme and comparison with the reference drug acetohydroxamic acid (C). | ||
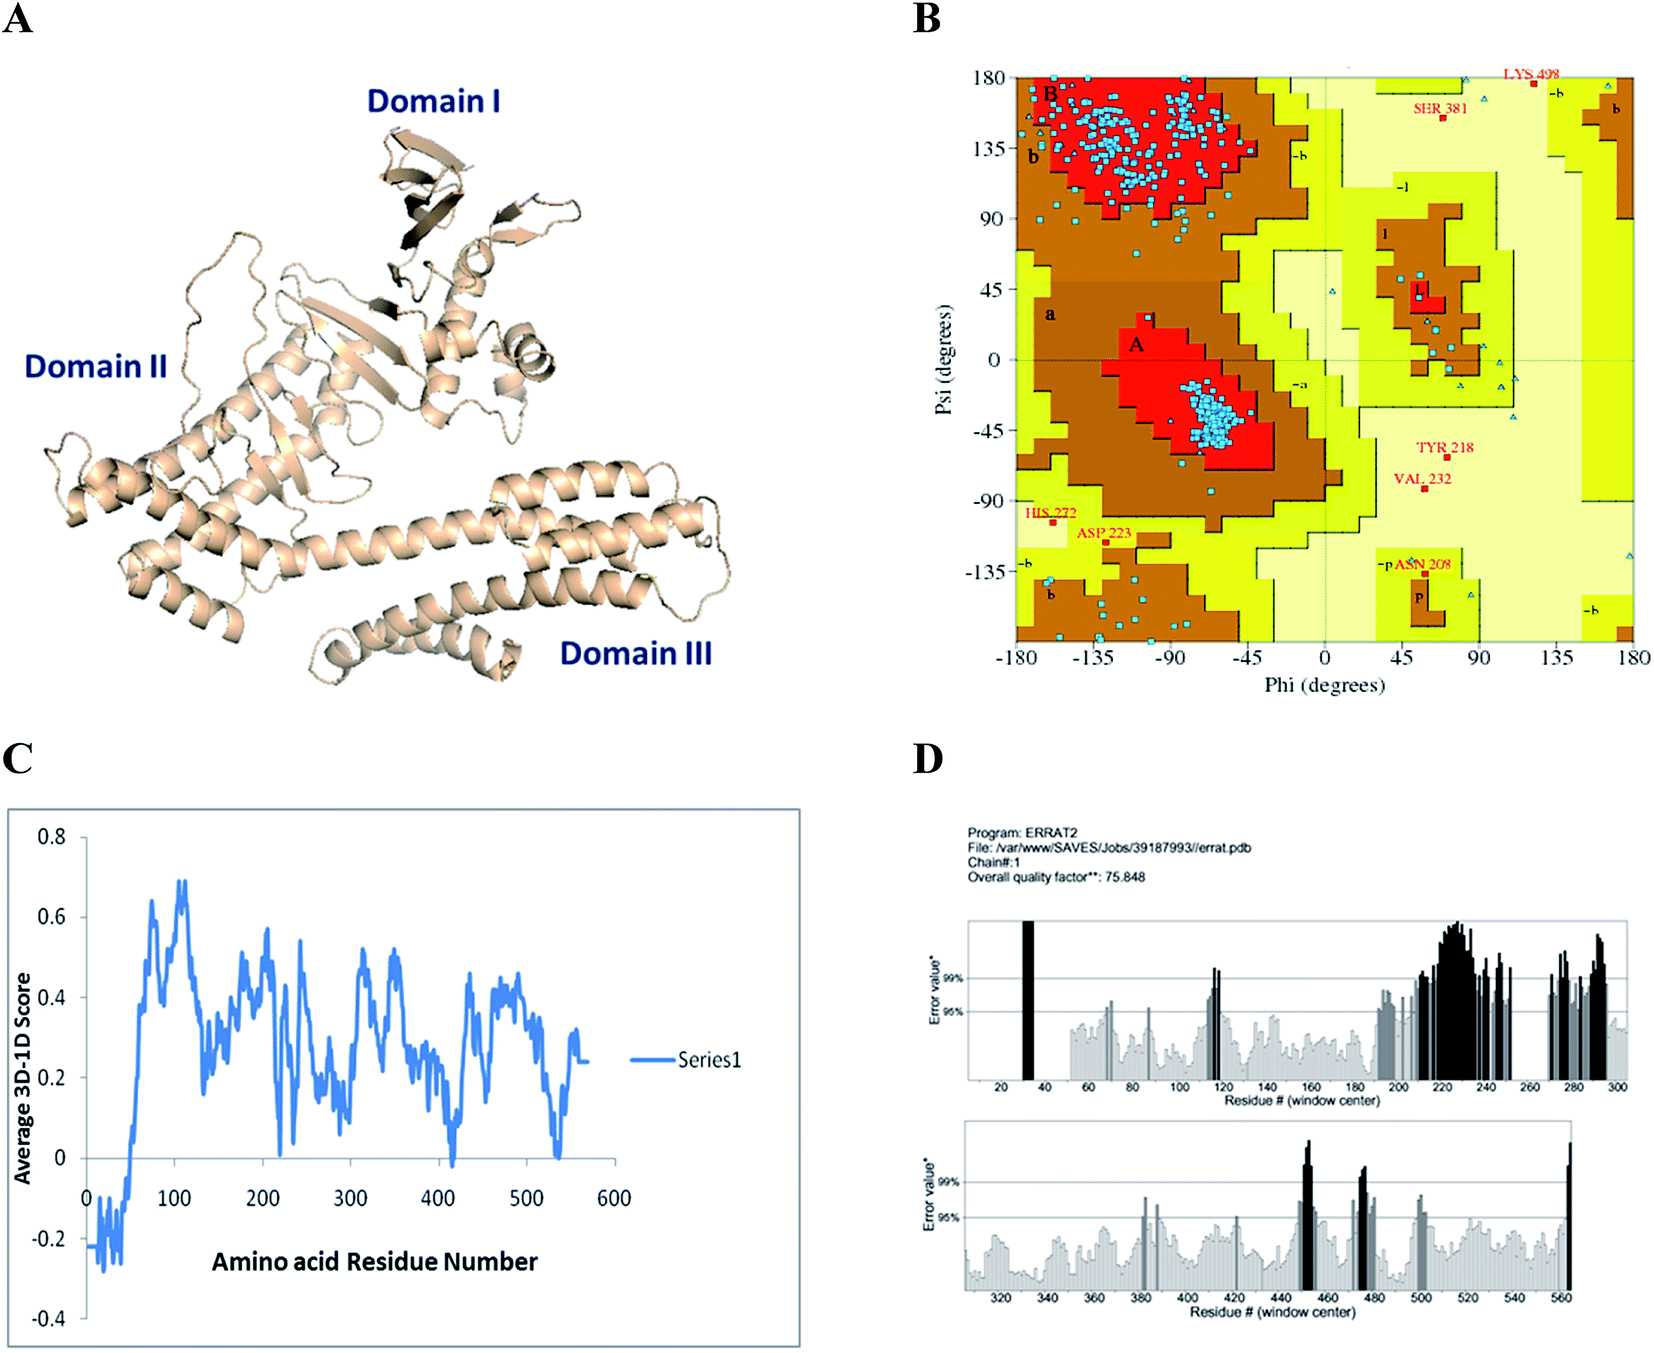 | ||
| Fig. 6 (A) 3D molecular structure of Cag A of H. pylori structure elucidated with the Modeller 9.12 software, (B) Ramachandran plot calculations for Cag A protein computed with the PROCHECK program. (C) Determines the compatibility of the atomic model with the 1D amino acid sequence using Verify 3D. (D) The 3D profile verified results of the Cag A model using ERRAT program. | ||
Compound 3 forms two H-bonds and one ionic bond. In the same manner, the 7-OH group forms two H-bonds one with OQ of KCx219 and another one with NE of His274 by donating an electron pair. Whereas compound 1 shows only one H-bond with NH of Arg338 by accepting an electron pair, when compared with the control drug AHA which showed two ionic bonds with two Ni2+ ions and one H-bond with His221 (Fig. S1†). The H-bonds, binding affinities and energy profiles of compounds 1–3 towards the active site amino acids of the enzyme are summarized in Table 2. The binding modes of compounds 2 and 3 suggested that they fitted more stably into the urease binding pocket by interacting with Ni2+ ions and key residues KCx219, Asp223, His274 and Asp362 and mimicked the binding mode of the reference drug AHA. Thus these interactions provide support for the significant decrease in urease activity.
| S. no | Compound | Dock score (S) | Binding energy (kcal mol−1) | Binding affinity | Bonding interaction | Bond length (Å) | Bond type |
|---|---|---|---|---|---|---|---|
| H. pylori urease | |||||||
| 1 | Compound 1 | −14.5 | −9.267 | 7.66 | Arg 338 NH⋯O | 2.84 | H-acc |
| 2 | Compound 2 | −36.5 | −16.29 | 8.32 | Kcx219OQ⋯H | 3.80 | H-don |
| Asp223OD⋯H | 1.44 | H-don | |||||
| His274NE⋯O | 2.85 | H-don | |||||
| Ni⋯O | 2.66 | Ionic | |||||
| 3 | Compound 3 | −34.62 | −19.81 | 9.85 | Kcx219OQ⋯H | 3.81 | H-don |
| His274NE⋯O | 2.90 | H-don | |||||
| Ni⋯O | 2.70 | Ionic | |||||
| 4 | Acetohydroxamic acid | −48.7 | −20.3 | 10.2 | His221NE⋯O | 2.98 | H-acc |
| Ni⋯O | 2.48 | Ionic | |||||
| Ni⋯O | 2.39 | Ionic | |||||
| Ni⋯O | 2.57 | Ionic | |||||
|
|||||||
| H. pylori Cag A protein | |||||||
| 5 | Compound 1 | −12.24 | −11.52 | 6.20 | Phe277O⋯H | 1.85 | H-don |
| Asn405ND⋯O | 3.19 | H-acc | |||||
| 6 | Compound 2 | −17.28 | −13.46 | 6.80 | Ser271O⋯H | 1.56 | H-don |
| Asn405ND⋯O | 2.98 | H-acc | |||||
| Arg413NH⋯O | 2.92 | H-acc | |||||
| 7 | Compound 3 | −20.62 | −15.32 | 7.15 | Phe277O⋯H | 2.68 | H-don |
| Glu370OE⋯H | 1.35 | H-don | |||||
| Asn405ND⋯O | 2.90 | H-acc | |||||
| 8 | Amoxicillin | −17.88 | −11.64 | 7.00 | Lys729O⋯H | 1.49 | H-don |
| Phe277N⋯O | 2.44 | H-acc | |||||
Previous reports on other flavonoids, quercetin, baicalein and scutellarin, have shown a stable non-competitive mode of inhibition of Hp urease with significant H-bond interactions with the same binding pocket as compound 2 and 3. Quercetin has shown a quite different style of binding mode by forming a cleft beside the same binding pocket with a Ki value of 9.34 μM and it also forms stable H-bond interactions with Val320, Cys321, Met366 and Gly367. The recent reports on baicalein and scutellarin suggest that it inhibits Hp urease by interacting with the key residue Cys321 located in the mobile flap through S–H π interactions with binding energies of −10.12 and −8.09 kcal mol−1 respectively and no interaction with the Ni2+ ions.44
For the Cag A protein, the results show that compound 3 has the highest dock score of −20.62 with the highest binding energy of −15.32 kcal mol−1 and a binding affinity (pki) of 7.15. Compound 2 shows a dock score of −17.28 with −13.46 kcal mol−1 and 6.80 being the binding energy and binding affinity values, respectively.
Compound 1 shows moderate activity with a dock score of −12.24. It has a binding energy of −11.52 kcal mol−1 with a binding affinity value of 6.20 when compared with the reference antibiotic amoxicillin which showed a −17.88 dock score and a binding energy of −11.64 kcal mol−1 with a binding affinity (pki) of 7.00 (Table 2). These findings prompted us to perform MD simulations of the docked protein–ligand complexes to elucidate the dynamic behavior of compounds against Cag A.
Molecular dynamics simulations
The inhibition of Cag A by the compounds was demonstrated by performing MD simulations of the protein and protein–ligand complexes with comprehensive analysis of the dynamic trajectories i.e., root mean square deviation (RMSD), RMS fluctuations (RMSFs), radius of gyration (Rg), solvent accessible surface area (SASA), H-bond profiling of Cag A and its docked complexes with compounds (1–3) as well as antibiotic, amoxicillin. These are represented as Cag Aa, Cag Ab, Cag Ac, Cag Ad and Cag Ae as reported in the methodology.The results from the calculated RMSD, root mean square fluctuation (RMSF) and radius of gyration (Rg) for the backbone Cα atoms show a wide range of variations in the liganded Cag A protein when compared to the unliganded Cag A. The RMSD values of the Cα atoms in Cag Aa with respect to the initial model and during the 10 ns time scale were plotted and show a sharp increase up to 1 ns followed by being at equilibrium at around 2.5 ns with a more moderate increase up to 5 ns. The structure is equilibrated up to 8.2 ns and then there is an immediate increase up to 10 ns of the MDS (Fig. 7A).
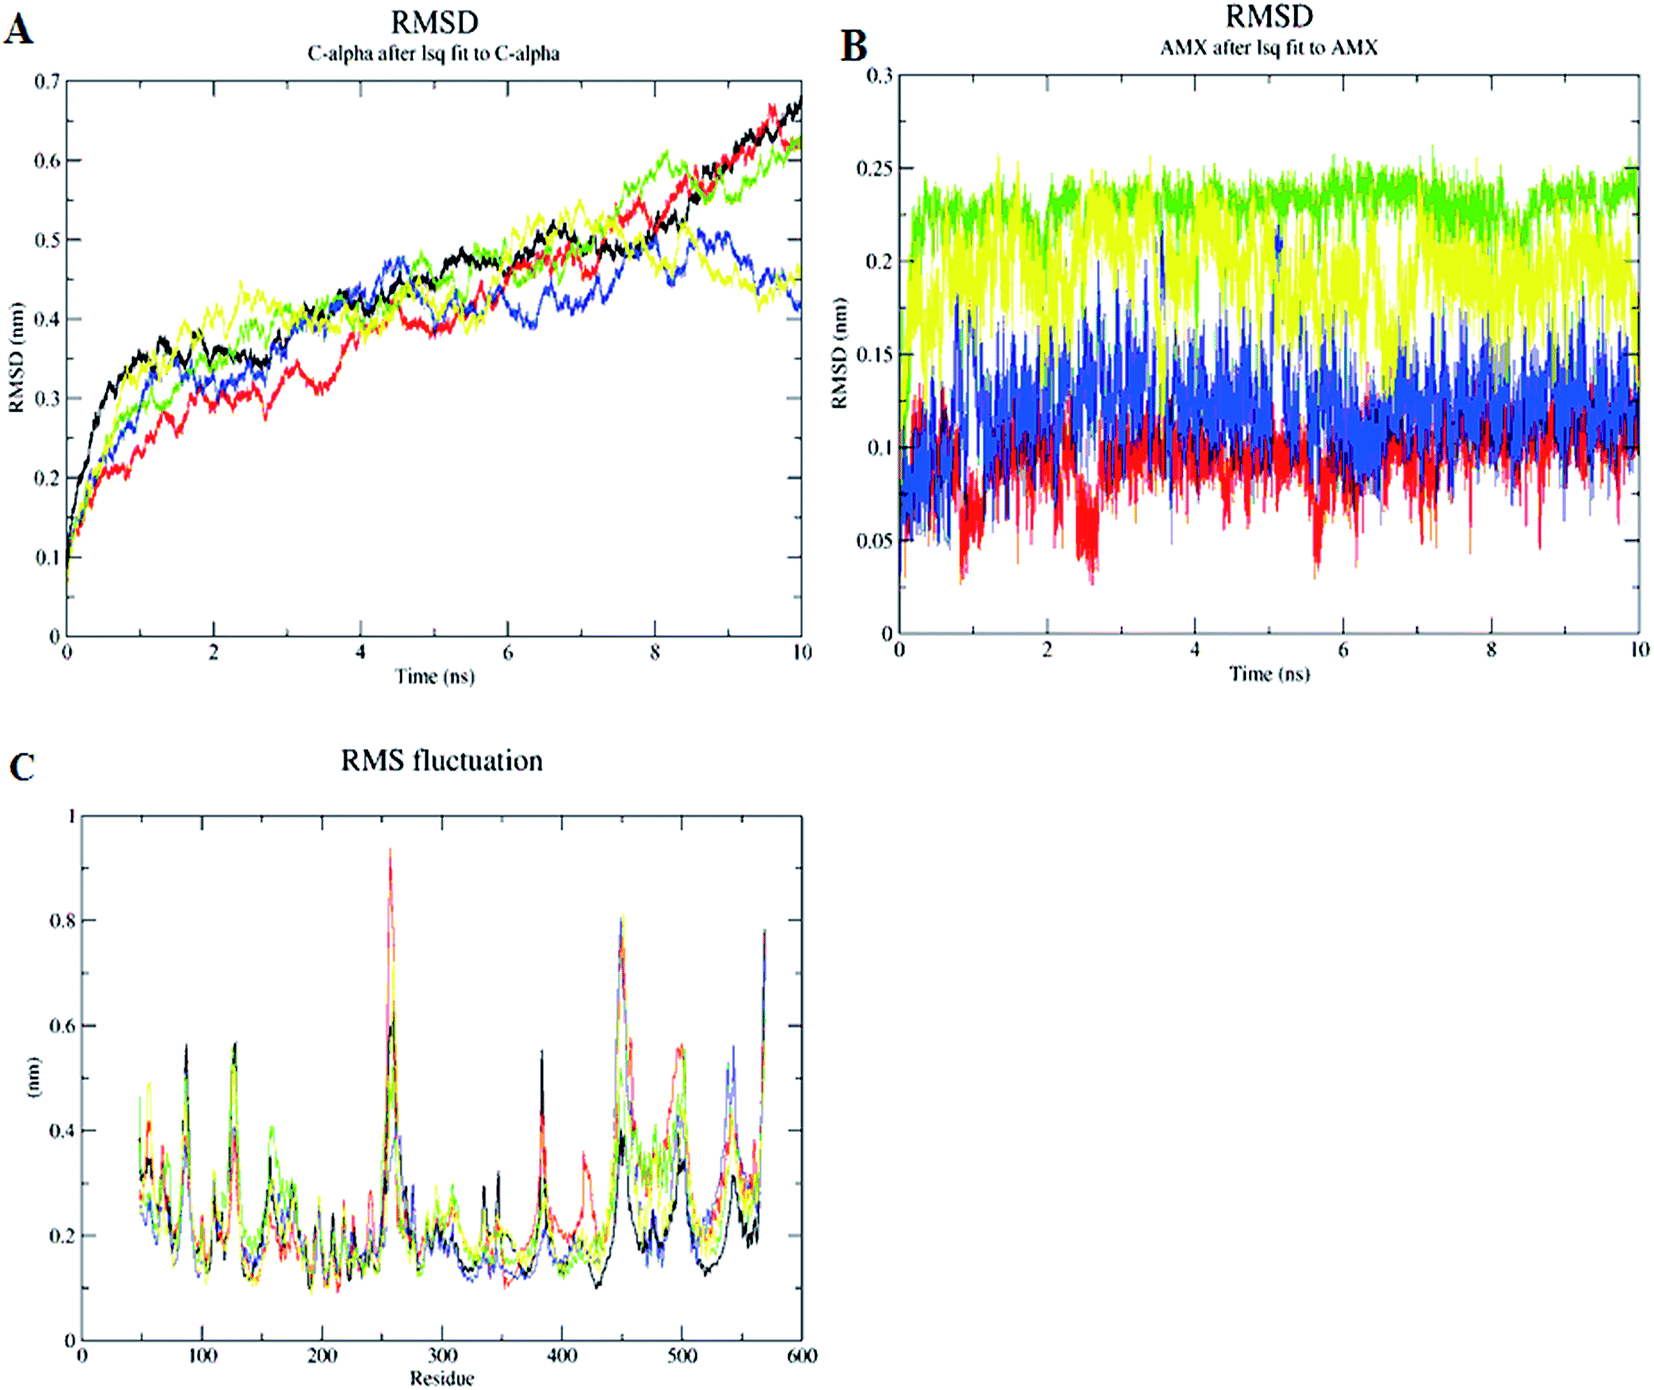 | ||
| Fig. 7 Backbone RMSD values of the Cα atoms of the protein (A), backbone RMSD values of the ligands (B), RMSF of the backbone atoms (C), of Cag Aa, Cag Ab, Cag Ac, Cag Ad and Cag Ae during 10 ns MD simulations. Black: Cag Aa; red: Cag Ab; green: Cag Ac; blue: Cag Ac and yellow: Cag Ae. | ||
The RMSD values of each liganded Cag A were plotted in order to elucidate the effect of the compounds on the structural stability and integrity. From this plot, Cag Ab showed a sharp increase in the RMSD up to 2 ns and was then optimized up to 4 ns at 0.3 nm, then it increased throughout the 10 ns and reached 0.6 nm. Cag Ac shows a sharp increase of the RMSD up to 2.5 ns which is maintained at equilibrium until 6.5 ns and the structure shows a slow increase up to 10 ns. Cag Ad, however, shows a sharp increase of the RMSD up to 0.32 nm at 1 ns, with a sudden decrease towards 0.28 nm and then maintains the equilibrium up to 2.5 ns. Subsequently the structure shows a slow increase of the RMSD and reaches to 0.45 nm at 4.5 ns, followed by a slow decrease towards 0.35 nm and then it maintains the equilibrium up to 10 ns with minor fluctuations.
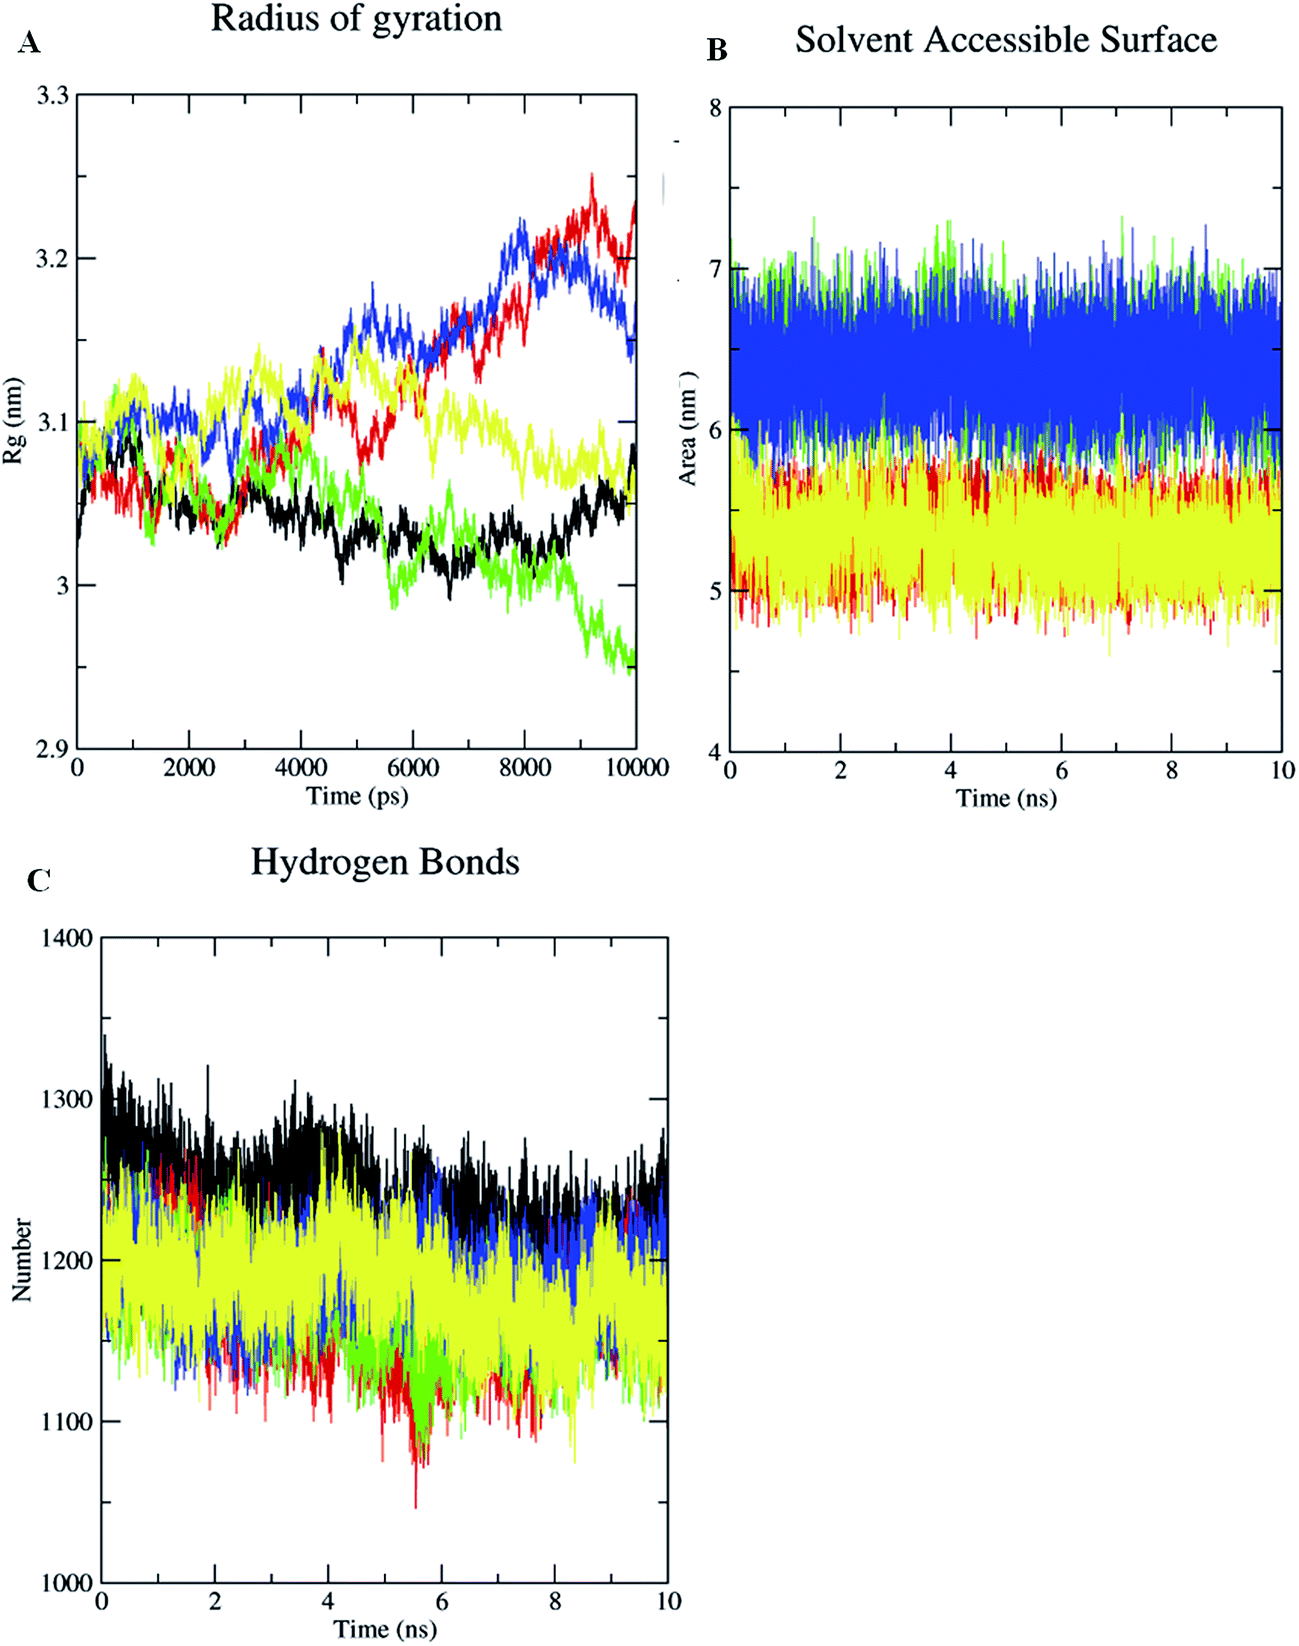
In addition to these complexes, Cag Ae, the protein liganded with the antibiotic amoxicillin, was subjected for a 10 ns MDS. Cag Ae showed a sharp increase of the RMSD up to 0.4 nm at 2.5 ns and structure then maintained equilibrium up to 6 ns, then there was a slow increase towards 0.5 nm followed by a slow decrease of the RMSD up to 10 ns (Fig. 7A). The conformational changes of the ligand molecules in the binding pocket were determined throughout the time period of the MDS. Compounds 1, 2, 3 and amoxicillin showed the conformational changes with average RMSDs of 0.075, 0.22, 0.12 and 1.175 nm respectively (Fig. 7B). The Solvent Accessible Surface Area (SASA) of the docked poses of the ligand molecules were analyzed during the 10 ns MDS. The results from the SASA analysis indicated that compounds 2 and 3 were exposed to the solvent region with an average area of 6.5 nm2. Based on the molecular weight and complexity of the molecules, compound 1 shows an average area of 5.4 nm2, similar to the antibiotic amoxicillin (Fig. 8B).
 | ||
| Fig. 8 Radius of gyration (Rg) of the backbone atoms (A), solvent accessible surface area (SASA) of the ligands (B), solvent–protein interactions (C) of Cag Aa, Cag Ab, Cag Ac, Cag Ad and Cag Ae during 10 ns MD simulations. Black: Cag Aa; red: Cag Ab; green: Cag Ac; blue: Cag Ac and yellow: Cag Ae. | ||
A comprehensive study of the RMSF profile of the unliganded Cag A protein and Cag A bound with the ligand molecule was conducted and the analyzed results demonstrate the fluctuations of amino acids in the catalytic and non-catalytic sites. The resultant RMSF profile showed fluctuations in the range of 0.1 to 0.25 nm at the catalytic site of Cag A protein. In this study no significant fluctuations were observed at the ligand binding site in the protein–ligand complexes when compared with the unliganded Cag A protein. Whereas a high level of mobility with fluctuations ranging between 0.2 to 0.98 nm were observed at the non-catalytic site, this is not being considered as significant for the present study since our major focus is on the dynamic behavior of catalytic site of Cag A (Fig. 7C).
In addition, the radius of gyration (Rg) was also determined for the unliganded Cag A and ligand-bound Cag A. The radius of gyration demonstrates the compactness of the protein with protein folding and unfolding through thermodynamic principals during the 10 ns of the MDS. Rg values for the unliganded protein and the protein–ligand complexes are shown in Fig. 8A. Among them unliganded Cag A has maintained the equilibrium with the average Rg value of 3.12 nm. All the protein–ligand complexes show a huge variation when compared with the unliganded protein.
The Rg values of Cag Ab initially started from 3.05 and was equilibrated up to 2.5 ns, thereafter the structure showed a gradual increase of the Rg value and reached 3.25 nm at 10 ns. Cag Ac showed a sharp increase of Rg up to 3.12 nm at 1.0 ns then an immediate decrease of the Rg value towards 3.02, it increased again towards 3.1 nm at 2.0 ns then the structure showed a gradual decrease of Rg towards 2.85 nm at 10 ns. Cag Ad showed an equilibrium Rg value of 3.12 nm up to 4.0 ns, then the structure showed a gradual increase of Rg, reaching 3.20 nm at 8.0 ns followed by equilibrium towards 10 ns. Whereas for Cag Ae an average Rg value of 3.10 nm was recorded with small fluctuations. The above results demonstrate that the radius of gyration (Rg) values were higher for protein–ligand complexes when compared with unbounded Cag A. Hence, it is evident that the binding of ligands with Cag A might have caused a marked alteration in the microenvironment of the Cag A protein, leading to conformational changes in the protein structure. The results indicate that compound 3 shows significant inhibition of Cag A with a higher Rg value of 3.12 nm when compared with the reference antibiotic amoxicillin which showed an average Rg value of 3.0 nm during the 10 ns of MD simulations (Fig. 8A). Protein and solvent interactions were also quantified for the unliganded Cag A as well as liganded Cag A during 10 ns of MD simulation (Fig. 8C).
Protein–ligand interactions during MD simulations
The ligand interactions with the active site amino acid residues of Cag A, viz. Cag A–compound 1, Cag A–compound 2, Cag A–compound 3 and Cag A–amoxicillin, were analyzed during the 10 ns MD simulations.The H-bond profile of compound 1 exhibits two H-bonds, one is stable and another one is weak throughout the 10 ns MD simulation. It is evident that different amino acid residues, such as Lys, Phe and Asn, have developed H-bond interactions with compound 1. Among these, the carbonyl oxygen of Phe277 forms one stable bond with the hydrogen atom of compound 1 by donating an electron pair with a 1.85 Å bond length. Compound 1 also formed one weak H-bond with the ND of Asn405 by accepting an electron pair with a 3.19 Å bond length.
Compound 2 forms 2–3 H-bonds, among them one is stronger and the other two are weaker. Compound 2 forms one H-bond with the carbonyl oxygen of Ser271 by donating an electron pair with a bond length of 1.56 Å, compound 2 also forms two bonds with ND and NH of Asn405 and Arg413 by donating an electron pair with bond lengths of 2.98 and 2.92 Å, respectively.
Compound 3 forms 2–4 H-bonds with the amino acids histidine, lysine, phenyl alanine, arginine and aspartic acid. Among them 2 bonds are stronger and 2 bonds are weaker during the 10 ns MD simulations (Fig. 9A and B). Compound 3 forms one H-bond with the carbonyl oxygen of His272 by donating an electron pair with a bond length of 1.81 Å, another H-bond with the carbonyl oxygen of Lys729 by donating an electron pair with a bond length of 1.72 Å. Compound 3 also forms one weaker H-bond with the carbonyl oxygen of Phe277 by accepting an electron pair with a bond length of 2.68 Å.
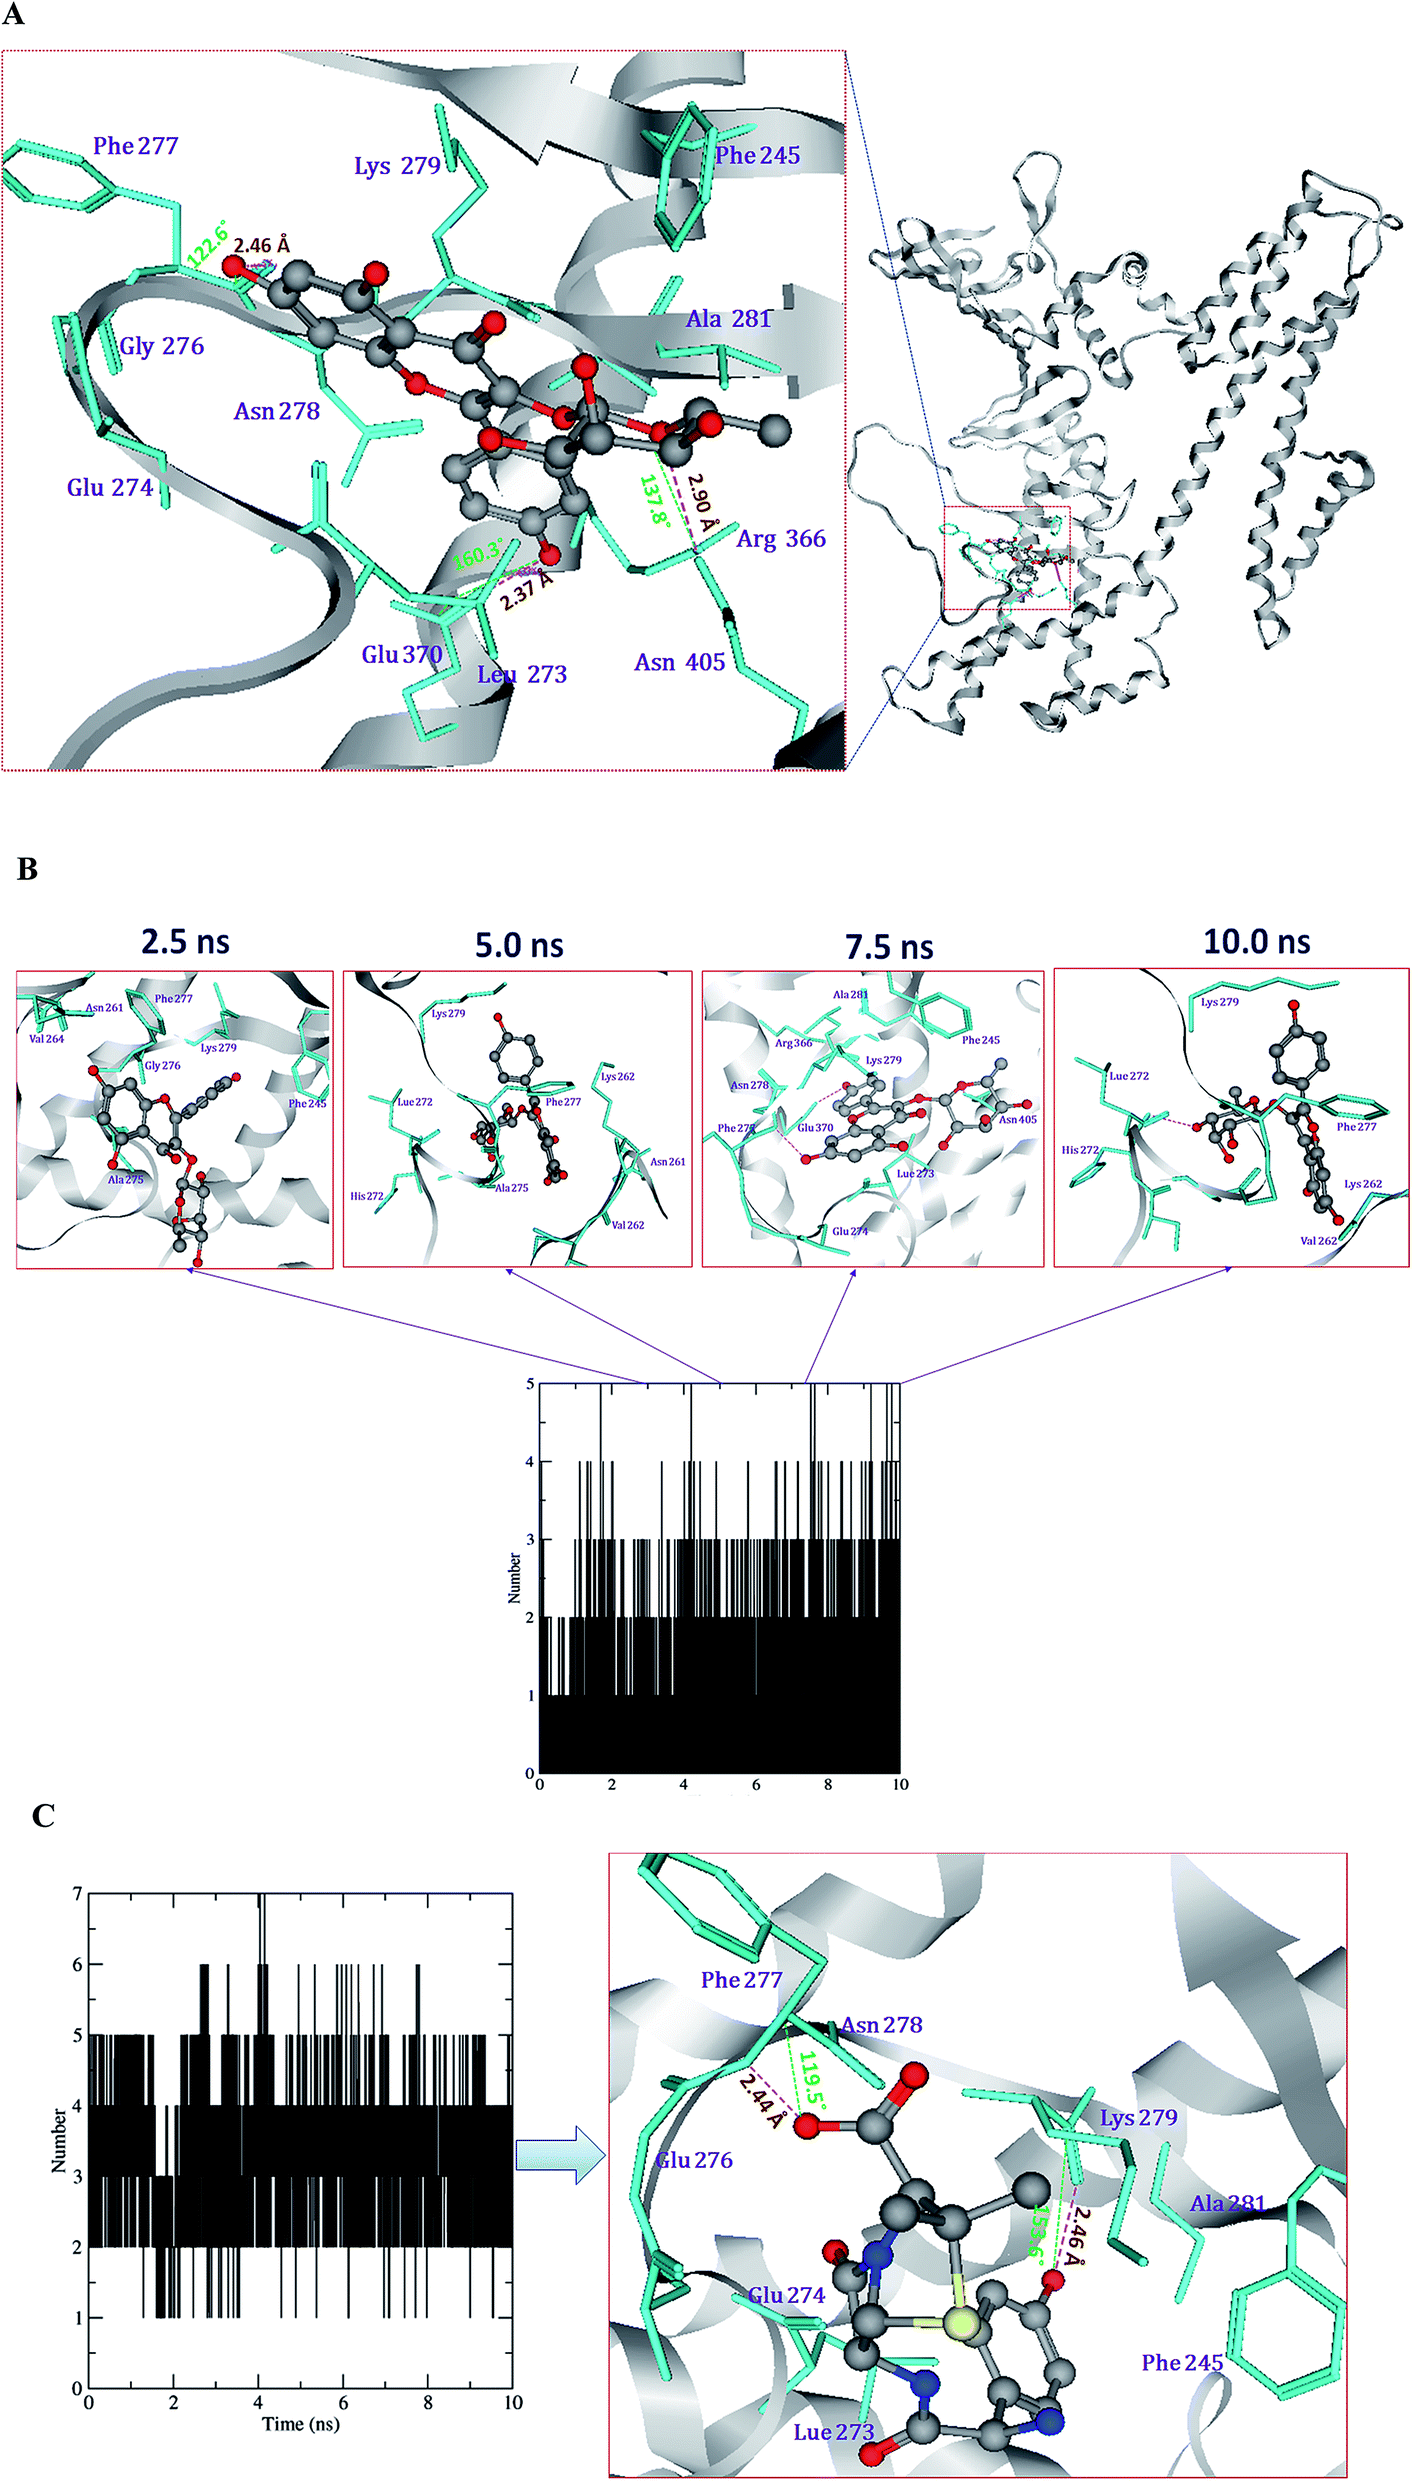 | ||
| Fig. 9 Snapshots of the docking pose of compound 3 (A) and the total H-bond intensity at various time intervals in the 10 ns complex MD simulations with Cag A (B). Docking pose of the reference drug amoxicillin the with H-bond profile plot (C). Black squares indicate the presence of H-bond and white ones correspond to the absence of H-bond throughout the time scale of 10 ns MD simulations. | ||
The reference antibiotic amoxicillin forms 3–5 H-bonds with the amino acids lysine, phenyl alanine, alanine and asparagine. Among them, 2 bonds are stronger and 3 are weaker throughout the 10 ns MD simulations (Fig. 9C). Amoxicillin forms one H-bond with the carbonyl oxygen atom of Lys729 by donating an electron pair with a bond length of 1.49 Å. Another H-bond with the nitrogen atoms of Phe277 by accepting an electron pair with a bond length of 2.44 Å. Based on the present computational experiments on Cag A, we found that the observed binding energies and dock scores of the compounds and the antibiotic amoxicillin towards Cag A have shown significant correlation with the results obtained through bioassays. Hence, the present in silico investigation has demonstrated that the docked conformers of compounds (1–3), the positive drug AHA and amoxicillin were able to adapt a suitable orientation and H-bond interactions with the binding pocket residues, viz., KCx219, Asp223, His274, Arg338 and Asp362 of Hp urease and Ala535, Phe537, Asn538, Lys539, Ala541, Asn625 and Arg625 of Cag A respectively.
4. Conclusions
In conclusion, the flavonoid compounds 1, 2 and 3 from S. alternifolium significantly inhibited the growth of H. pylori by eradicating the colonization with AGS cells during its infection, determined through time dependent kinetic analysis, and also they have also shown marked urease inhibition. Furthermore, we have carried out computational studies using 2D QSAR, molecular docking and MD simulations on these compounds against urease and Cag A which are involved in the pathogenesis.The results of the in vitro experiments reveal that compounds 2 and 3 have exhibited significant anti-H. pylori activity as evidenced by the time dependent kinetic analysis of the urease inhibition. Whereas compound 1 has shown moderate inhibition when compared with amoxicillin. The 2D QSAR studies on these compounds have shown that the predicted pIC50 values of the compounds have acceptable correlation with the experimental values from the generated regression and principal component analysis (PCA) plots. Docking and binding energy calculations on these compounds reveal the highest dock score against target proteins. Furthermore, the MD simulations of these protein–ligand complexes have demonstrated the conformational changes of ligand binding with active site residues and their molecular interactions. These might have been caused by the destabilization of the activity profile, as evidenced by the comprehensive analysis of the dynamic trajectories and H-bond profiles during the 10 ns MD simulations. Hence, the present investigation helps to screen a new class of antibiotics from natural product remedies against H. pylori infections with improved efficacy, specificity and fewer side effects.
Acknowledgements
The authors (TMB) are grateful to the University Grants Commission, New Delhi for financial assistance through a RFSMS-BSR fellowship. The authors are grateful to Dr Niyaz Ahmed, University of Hyderabad, for providing the cell culture facility. The authors are also thankful to Prof. D. Gunasekar (Rtd), Department of Chemistry, S. V University, Tirupati for his valuable suggestions and co-operation.References
- R. M. Peek Jr and M. J. Blaser, Nat. Rev. Cancer, 2002, 2, 28–37 CrossRef PubMed.
- P. Malfertheiner, Am. J. Gastroenterol., 2005, 100, 2100–2115 CrossRef PubMed.
- G. I. Perez-Perez, D. Rothen bacher and H. Brenner, Helicobacter, 2004, 9, 1–16 CrossRef PubMed.
- L. M. Brown, Epidemiol. Rev., 2000, 22, 283–297 CrossRef CAS PubMed.
- J. Torres, Y. Leal-Herrera, G. Perez-Perez, A. Gomez and M. Camorilinga-Ponce, J. Infect. Dis., 1998, 178, 1089–1094 CrossRef CAS PubMed.
- L. N. Meurer and D. J. Brower, Am. Fam. Physician, 2002, 65, 1327–1336 Search PubMed.
- Y. T. Chu, Y. H. Wang, J. J. Wu and H. Y. Lei, Infect. Immun., 2010, 78, 4157–4165 CrossRef CAS PubMed.
- D. Y. Graham and W. A. Qureshi, Curr. Pharm. Des., 2000, 6, 1537–1544 CrossRef CAS PubMed.
- K. R. Jones, J. M. Whitmire and D. S. Merrell, Front Microbiol., 2010, 23, 115 Search PubMed.
- L. Cendron and G. Zanotti, FEBS J., 2011, 278, 1223–1231 CrossRef CAS PubMed.
- E. D. Segal, J. Cha, J. Lo, S. Falkow and L. S. Tompkins, Proc. Natl. Acad. Sci. U. S. A., 1999, 96, 14559–14564 CrossRef CAS.
- S. Odenbreit, J. Püls, B. Sedlmaier, E. Gerland, W. Fischer and R. Haas, Science, 2000, 287, 1497–1500 CrossRef CAS PubMed.
- B. E. Dunn, H. Cohen and M. J. Blaser, Clin. Microbiol. Rev., 1997, 10, 720–741 CAS.
- D. Y. Graham and P. D. Klein, Am. J. Gastroenterol., 1987, 82, 283–286 CAS.
- K. Nagata, T. Mizuta, Y. Tonokatu, Y. Fukuda, H. Okamura, T. Hayashi, T. Shimoyama and T. Tamura, Infect. Immun., 1992, 60, 4826–4831 CAS.
- M. A. Zaheer-ul-Haq, S. S. Lodhi, S. Nawaz, K. M. Iqbal, B. M. Khan, M. I. Attaur-Rahman Rode and M. I. Choudhary, Bioorg. Med. Chem., 2008, 16, 3456–3461 CrossRef CAS PubMed.
- D. Hu, F. Zhang, J. Zhou, B. Xu, H. Zhang, H. Qiang, S. Ren, B. Shan, C. Yin, Z. Zhang, X. Wang, C. Zhao and Z. Shi, J. Transl. Med., 2015, 13, 205 CrossRef PubMed.
- Y. T. Lin, Y. I. Kwon, R. G. Labbe and K. Shetty, Appl. Environ. Microbiol., 2005, 71, 8558–8564 CrossRef CAS PubMed.
- G. P. Amaral, N. S. de Carvalho, R. P. Barcelos, F. Dobrachinski, R. de Lima Portella, M. H. da Silva, T. H. Lugokenski, G. R. Mundstock Dias, S. C. Almeida da Luz, A. A. Boligon, M. L. Athayde, M. A. Villetti, F. A. Antunes Soares and R. Fachinetto, Food Chem. Toxicol., 2013, 55, 48–55 CrossRef CAS PubMed.
- J. C. Brown, G. Huang, V. Haley-Zitlin and X. Jiang, Appl. Environ. Microbiol., 2009, 75, 848–852 CrossRef CAS PubMed.
- B. V. Bhaskar, A. R. Mohan, T. M. Babu, D. Gunasekar and W. Rajendra, Process Biochem., 2016, 51, 2208–2221 CrossRef CAS.
- T. M. Babu, A. Rammohan, V. B. Baki, D. Savita, D. Gunasekar and W. Rajendra, Drug Des., Dev. Ther., 2016, 10, 3611–3632 CrossRef PubMed.
- S. Devi, S. A. Ansari, J. Vadivelu, F. Mégraud, S. Tenguria and N. Ahmed, Helicobacter, 2014, 19, 26–36 CrossRef CAS PubMed.
- M. W. Weatherburn, Anal. Chem., 1967, 39, 971–974 CrossRef CAS.
- Z. P. Xiao, X. D. Wang, Z. Y. Peng, S. Huang, P. Yang, Q. S. Li, L. H. Zhou, X. J. Hu, L. J. Wu, Y. Zhou and H. L. Zhu, J. Agric. Food Chem., 2012, 60, 10572–10577 CrossRef CAS PubMed.
- S. K. Lee, G. S. Chang, I. H. Lee, J. E. Chung, K. Y. Sung and K. T. No, EuroQSAR 2004, 9.5-10, Istanbul, Turkey, 2004 Search PubMed.
- A. Sali and T. L. Blundell, J. Mol. Biol., 1993, 234, 779–815 CrossRef CAS PubMed.
- R. A. Laskoswki, M. W. MacArthur, D. S. Moss and J. M. Thornton, J. Appl. Crystallogr., 1993, 26, 283–291 CrossRef.
- C. Colovos and T. O. Yeates, Protein Sci., 1993, 2, 1511–1519 CrossRef CAS PubMed.
- R. Lüthy, J. U. Bowie and D. Eisenberg, Nature, 1992, 356, 83–85 CrossRef PubMed.
- MOE, Molecular Operating Environment 2011.10, Chemical Computing Group Inc., Montreal, QC, Canada, 2011 Search PubMed.
- P. Labute, J. Comput. Chem., 2008, 29, 1693–1698 CrossRef CAS PubMed.
- H. J. C. Berendsen, D. van der Spoel and R. van Drunen, Comput. Phys. Commun., 1995, 91, 43–56 CrossRef CAS.
- K. Lindorff-Larsen, S. Piana, K. Palmo, P. Maragakis, J. L. Klepeis, R. O. Dror and D. E. Shaw, Proteins: Struct., Funct., Bioinf., 2010, 78, 1950–1958 CAS.
- A. W. Schüttelkopf and D. M. F. van Aalten, Acta Crystallogr., Sect. D: Biol. Crystallogr., 2004, 60, 1355–1363 CrossRef PubMed.
- H. J. C. Berendsen, J. R. Grigera and T. P. Straatsma, J. Phys. Chem., 1987, 91, 6269–6271 CrossRef CAS.
- H. J. C. Berendsen, J. P. M. Postma, W. F. Van Gunsteren, A. Dinola and J. R. Haak, J. Chem. Phys., 1984, 81, 3684–3690 CrossRef CAS.
- M. Parrinello and A. Rahman, J. Appl. Phys., 1981, 52, 7182–7190 CrossRef CAS.
- J. C. Brown, J. Wang, L. Kasman, X. Jiang and V. Haley-Zitlin, J. Appl. Microbiol., 2011, 110, 136–146 Search PubMed.
- C. Bisignano, A. Filocamo, E. La Camera, S. Zummo, M. T. Fera and G. Mandalari, BMC Microbiol., 2013, 13, 103 CrossRef PubMed.
- H. Azizian, F. Nabati, A. Sharifi, F. Siavoshi, M. Mahdavi and M. Amanlou, J. Mol. Model., 2012, 18, 2917–2927 CrossRef CAS PubMed.
- N. C. Ha, S. T. Oh, J. Y. Sung, K. A. Cha, M. H. Lee and B. H. Oh, Nat. Struct. Biol., 2001, 8, 505–509 CrossRef CAS PubMed.
- G. R. Turbett, P. B. Hoj, R. Horne and B. J Mee, Infect. Immun., 1992, 60, 5259–5266 CAS.
- X. D. Yu, R. B. Zheng, J. H. Xie, J. Y. Su, X. Q. Huang, Y. H. Wang, Y. F. Zheng, Z. Z. Mo, X. L. Wu, D. W. Wu, Y. E. Liang, H. F. Zeng, Z. R. Su and P. Huang, J. Ethnopharmacol., 2015, 162, 69–78 CrossRef CAS PubMed.
Footnote |
| † Electronic supplementary information (ESI) available. See DOI: 10.1039/c6ra27872h |
| This journal is © The Royal Society of Chemistry 2017 |