DOI:
10.1039/C6RA27515J
(Paper)
RSC Adv., 2017,
7, 13789-13797
Solar synthesized tin oxide nanoparticles dispersed on graphene wrapped carbon nanotubes as a Li ion battery anode material with improved stability†
Received
29th November 2016
, Accepted 18th February 2017
First published on 28th February 2017
Abstract
Employing high theoretical capacity SnO2 as an anode material for Li ion batteries (LIBs) is still a challenge because of its huge volume change upon lithiation/de-lithiation, leading to instability and a low cycle life of the cell. Herein we report graphene wrapped carbon nanotubes (gC), a one-dimensional monohybrid of multiwalled carbon nanotubes and graphene sheets, which support SnO2 nanoparticles to act as a stable LIB anode. An eco-friendly, solar energy mediated reduction process, instead of hazardous wet chemical methods, was used to decorate SnO2 over the gC support material. The wrinkled surface of gC, with a higher available surface area and favorable Li transfer channels, is explored as a functional preventive measure against the volume change of the metal oxide nanoparticles. This well-connected gC structure with high conductivity also accounts for the semiconducting nature of SnO2, and exhibits less resistance with a highly stable performance, thereby presenting SnO2/gC as a potential anode material for LIBs.
Introduction
The present ecological concerns of civilization demand sustainable, pollution-free, clean and cost-effective renewable energy technologies. Solar, tidal and wind energies are natural energies that need storage systems associated with them for uninterrupted usage. The Li ion battery (LIB) has emerged as an important rechargeable electrochemical conversion and storage device because of its many advantages, such as high energy density, capacity, and cycle life, over the past two decades.1 The commercially used graphite anode in LIBs limits the battery performance owing to its low specific capacity of 372 mA h g−1.2 The high abundance of SnO2 in nature has projected itself as a low cost and favorable material for biosensors,3 capacitors4 and many more applications,5 including as an anode material in LIBs.6 The problem of the huge (∼300%) volume change7 of SnO2 during lithiation/de-lithiation cycles, leading to unavoidable pulverization still demands further structural engineering for it to be to be an efficient and stable anode material. Even after much research over the last few decades, the volume variation of SnO2 still leads to a poor life-cycle and rate performance. The capacity fading is also a result of pulverization of tin oxide, leading to mechanical disintegration and fresh surface exposures of the active material which results in the continuous formation of solid electrolyte interface (SEI) layer. 3 nm SnO2 nanoparticles have been reported to show enhanced performance owing to less aggregation into clusters.8 To prevent the active material loss over mechanical degradation, the design of hollow9 and core–shell10 metal oxide nanostructures, as well as the use of an accommodating and conducting support structure, has been implemented by the research community. 1D carbon nanotubes (CNT),11 2D graphene12,13 and their hybrid14,15 structures have been well investigated as supports for SnO2 nanoparticles. 1D–2D composite structures of a MWNT-graphene support in a nano-3D aerogel form for SnO2 support,16 polypyrrole based carbon nanowire-graphene supported SnO2,17 a one-pot microwave synthesized SnO2/G-CNT composite,18 and a hydrazine reduced hybrid SnO2/G-CNT15 are a few examples of the many investigated anode materials. However a commercially available, stable and high performance tin oxide composite has not been reported until now, as the reported composites have flaws such as complicated synthesis processes, hazardous chemical usage, a demand for wet production processes or uniformity in the structure.20–23
The present report investigates protruded surface 1D monohybrid-graphene wrapped carbon nanotubes (gC) as the support for the tin oxide nanoparticles and the application of the composite as an anode material in a Li ion battery. The unique structural and morphological features of gC have already proved that it is a better anode material than commercial graphite.19 A simple, inexpensive and environmentally benign solar reduction synthesis process has been used for the uniform dispersion of tin oxide nanoparticles over the graphene wrapped carbon nanotubes. The tin oxide nanoparticles, which enable better Li diffusion, and the conducting structure of gC facilitating electron transfer, are expected to raise the minimum stress in the lithiation/delithiation process because of the wrinkled surface and the porous nature of the support, giving sufficient void space for accommodation of the volume variation.
Experimental
Material synthesis
The decoration of tin oxide nanoparticles over gC was performed using a green solar reduction technique, and the material was employed as an anode in a Li ion battery. Pure graphene wrapped carbon nanotubes were synthesized using a modified catalyst assisted chemical vapor deposition (CCVD) technique (S.I.) as reported by us previously.19,24 A tin chloride di-hydrate (SnCl2·2H2O; ≥99.995%; Aldrich) precursor was mechanically mixed in a ratio of 1![[thin space (1/6-em)]](https://www.rsc.org/images/entities/char_2009.gif) :
:![[thin space (1/6-em)]](https://www.rsc.org/images/entities/char_2009.gif) 3 with graphene wrapped carbon nanotubes. Solar energy was focused using a convex lens (90 mm diameter) to act as the energy source for the reduction.26 The previously prepared mixture was uniformly spread on a glass Petri dish and exposed to the focused solar energy using the lens for a few minutes during peak hours of scorching heat on a clear summer day. The exposure was scanned throughout the spread sample in an identical method for uniformity. The temperature of the focused portion increased rapidly to 150–450 °C within a few seconds, resulting in decomposition of the precursor salt and the simultaneous deposition of tin nanoparticles over the support surface.25,26 The release of gaseous by-products was clearly visible during the short time of the synthesis. Tin nanoparticles reacted with atmospheric oxygen and oxygen that was decomposing from the salt, resulting in tin oxide nanoparticles, owing to the chemical reactivity of tin at high temperatures. Finally, the black powder was collected and labeled as SnO2/gC without any further modifications. For comparison, SnO2 nanoparticles were also decorated over the surfaces of purified multiwalled carbon nanotubes27 (MWNT) using a similar process. Without any further treatment, the SnO2/MWNT and SnO2/gC materials were tested as anode materials for LIBs.
3 with graphene wrapped carbon nanotubes. Solar energy was focused using a convex lens (90 mm diameter) to act as the energy source for the reduction.26 The previously prepared mixture was uniformly spread on a glass Petri dish and exposed to the focused solar energy using the lens for a few minutes during peak hours of scorching heat on a clear summer day. The exposure was scanned throughout the spread sample in an identical method for uniformity. The temperature of the focused portion increased rapidly to 150–450 °C within a few seconds, resulting in decomposition of the precursor salt and the simultaneous deposition of tin nanoparticles over the support surface.25,26 The release of gaseous by-products was clearly visible during the short time of the synthesis. Tin nanoparticles reacted with atmospheric oxygen and oxygen that was decomposing from the salt, resulting in tin oxide nanoparticles, owing to the chemical reactivity of tin at high temperatures. Finally, the black powder was collected and labeled as SnO2/gC without any further modifications. For comparison, SnO2 nanoparticles were also decorated over the surfaces of purified multiwalled carbon nanotubes27 (MWNT) using a similar process. Without any further treatment, the SnO2/MWNT and SnO2/gC materials were tested as anode materials for LIBs.
Physical characterization
A PANalytical X’Pert Pro X-ray diffractometer, with nickel filtered Cu-Kα radiation as the X-ray source, was used to record the X-ray diffraction (XRD) measurements over a 2θ range of 5–90° with a step size of 0.016°. The loading of metal oxide on the gC and MWNT support was calculated using the results from a thermogravimetric analysis plot, which was recorded using an SDTQ600 (TA instruments) analyzer in a zero-air atmosphere from room temperature (30 °C) to 1000 °C. A LabRAM HP 800 UV Raman spectrometer was used to study the vibrational modes of the samples, with a 632 nm He–Ne laser used as the excitation source, over the range of 1000–2000 cm−1. An X-ray photoelectron spectroscopy (XPS) study was performed to check the phases of the synthesized materials, using a SPECS instrument with Mg-Kα as the X-ray source and PHOIBOS 100MCD as the analyzer under ultrahigh vacuum (10−10 mbar). CasaXPS software with Shirley background correction was used to deconvolute the data. A field emission scanning electron microscope (FESEM, FEI QUANTA3D) and a transmission electron microscope (FEI Technai G2 20 STWIN, 200 keV) were used to characterize the morphologies of the samples. Elemental mapping analysis measurements were carried out using a FEI Quanta FEG 200 instrument. For the XPS and SEM analysis, the powder sample was uniformly coated on one side of some adhesive carbon tape, while for the TEM analysis, samples were prepared by drop-casting a few drops of the ethanol-dispersed material over a 200-mesh gold coated copper grid.
Electrochemical characterization
The electrode slurry was prepared by mixing the active material (SnO2/gC or SnO2/MWNT) with a polyvinylidene fluoride (PVDF) binder and conductive graphite in a ratio of 75![[thin space (1/6-em)]](https://www.rsc.org/images/entities/char_2009.gif) :
:![[thin space (1/6-em)]](https://www.rsc.org/images/entities/char_2009.gif) 15
15![[thin space (1/6-em)]](https://www.rsc.org/images/entities/char_2009.gif) :
:![[thin space (1/6-em)]](https://www.rsc.org/images/entities/char_2009.gif) 10 in an N-methyl-2-pyrrolidinone solvent. A doctor blade technique was used to uniformly coat the slurry onto the copper foil which was then dried in a vacuum oven at 120 °C for 6 h. 12 mm diameter anode coins were cut from the dried active-material slurry mixture on the copper foil. CR 2032 type coin cells with lithium metal as the counter electrode, Celgard 2400 as the membrane separator, and LiPF6 (1 M) dissolved in a mixture of ethylene carbonate (EC) and dimethyl carbonate (DMC) (EC/DMC, 1
10 in an N-methyl-2-pyrrolidinone solvent. A doctor blade technique was used to uniformly coat the slurry onto the copper foil which was then dried in a vacuum oven at 120 °C for 6 h. 12 mm diameter anode coins were cut from the dried active-material slurry mixture on the copper foil. CR 2032 type coin cells with lithium metal as the counter electrode, Celgard 2400 as the membrane separator, and LiPF6 (1 M) dissolved in a mixture of ethylene carbonate (EC) and dimethyl carbonate (DMC) (EC/DMC, 1![[thin space (1/6-em)]](https://www.rsc.org/images/entities/char_2009.gif) :
:![[thin space (1/6-em)]](https://www.rsc.org/images/entities/char_2009.gif) 1 v/v) as the electrolyte, were employed for testing. The cells were fabricated in a high pure argon (>99.999%) filled glove box (mBRAUN, Unilab) for the electrochemical measurements. A Solartron electrochemical workstation was used to study the galvanostatic charge–discharge measurements between 3 V and 0.01 V at room temperature for the assembled coin cells. An Autolab PGSTAT302 instrument with NOVA software was used to obtain the cyclic voltammograms (CVs) and impedance spectra for the employed materials. CV was recorded at a scan rate of 0.5 mV s−1, while a sine wave with an amplitude of 5 mV over a frequency range from 100 kHz to 0.01 Hz was applied to record the electrochemical ac impedance spectra.
1 v/v) as the electrolyte, were employed for testing. The cells were fabricated in a high pure argon (>99.999%) filled glove box (mBRAUN, Unilab) for the electrochemical measurements. A Solartron electrochemical workstation was used to study the galvanostatic charge–discharge measurements between 3 V and 0.01 V at room temperature for the assembled coin cells. An Autolab PGSTAT302 instrument with NOVA software was used to obtain the cyclic voltammograms (CVs) and impedance spectra for the employed materials. CV was recorded at a scan rate of 0.5 mV s−1, while a sine wave with an amplitude of 5 mV over a frequency range from 100 kHz to 0.01 Hz was applied to record the electrochemical ac impedance spectra.
Result and discussion
Fig. 1 shows a schematic of the SnO2/gC synthesis process and the Li interaction pathways on the composite material. Graphene wrapped carbon nanotubes with wrinkled surface and comparative less length than MWNT was synthesized using CCVD technique as discussed earlier.19 35 mg of tin precursor was mixed with 105 mg of gC and sprinkled over a Petri-dish. Solar energy was concentrated through the lens, and focused uniformly over the sprinkled precursor mixture. The focused solar energy raises the local temperature to ∼450° within a few seconds, thus decomposing the metal salt. As a result, tin nanoparticles attach to the gC support structure with the release of gaseous by-products. The non-noble metal nanoparticles react with atmospheric oxygen in those conditions, thus forming the tin oxide decorated graphene wrapped carbon nanotube structure.
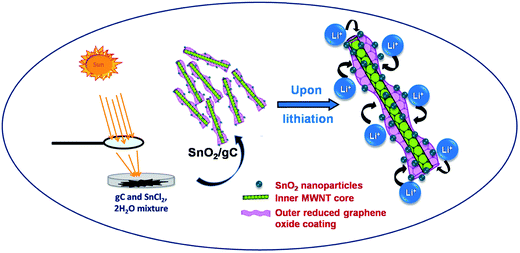 |
| | Fig. 1 Schematic representation of the synthesis of SnO2/gC with the lithium interaction sites on gC. | |
X-ray diffraction patterns were recorded to confirm the formation of the support as well as the composite structure, and are shown in Fig. 2A for (a) MWNT, (b) gC, (c) SnO2/MWNT and (d) SnO2/gC. The characteristic C (002) peak at around 26° in Fig. 2A(a) for MWNT shows the long-range order of the synthesized multiwalled carbon nanotubes. Broadening in the base of C (002) peak in Fig. 2A(b) for gC emphasizes its disorder nature. There is no evidence of any remaining catalyst or graphite oxide in this diffraction pattern, thus highlighting the phase pure gC. Fig. 2A(c and d) shows the presence of a crystalline SnO2 tetragonal phase, with (110), (101), (211) and (301) peaks at around 27°, 34°, 52° and 65.5°, respectively. C (002) of the support MWNT or gC structures is merged with the SnO2 (110) phase. There was no sign of the presence of any other states of Sn in both the solar-synthesized SnO2/MWNT and SnO2/gC. The average crystallite sizes of the SnO2 nanoparticles for SnO2/MWNT and SnO2/gC, calculated using Scherrer’s formula,28 are 3.1 nm and 2.8 nm, respectively. The thermal stability and metal oxide loading of the composite powder samples were assessed using thermo-gravimetric analysis (TGA) which is presented in Fig. 2B. A ∼26% loading of SnO2, in contrast to the desired 30% loading, was observed over the gC support material using the solar reduction method (Fig. 2B(b)). The metal oxide loading was found to be ∼27% for SnO2/MWNT (Fig. 2B(a)). A Raman spectroscopy study was carried out on the materials to further confirm the formation of the desired phases of the materials. Fig. 3A shows the Raman spectra for (a) MWNT, (b) gC, (c) SnO2/MWNT and (d) SnO2/gC. All four samples showed characteristic D and G bands at around 1350 cm−1 and 1582 cm−1, which represent the carbon backbone. The high ID/IG value (Table 1) for gC (Fig. 3A(b)) compared to MWNT (Fig. 3A(a)) is due to the surface defects in terms of wrinkles and protrusions. The decoration of tin oxide nanoparticles over the support increases the ID/IG ratio for SnO2/MWNT (Fig. 3A(c)) while the ratio decreases for SnO2/gC (Fig. 3A(d)). The peaks within the 400 to 700 cm−1 range for Fig. 3A(c and d) show the Raman modes of the tin oxide nanoparticles which are absent in bare MWNT and gC. Fig. 3B presents a zoomed view of these Raman bands within the dotted area of Fig. 3A(c and d). The peaks at around 467 cm−1 and 622 cm−1 are attributed to the Eg and A1g modes of the SnO2 phase.29 The broadened peak at around 565 cm−1 represents the surface defectiveness due to the smaller sizes of the dispersed tin oxide nanoparticles,30 as already confirmed from the crystallite sizes. XPS measurements were performed to obtain information about the Sn phases obtained using the solar reduction technique. Fig. 4 shows (a) a survey spectrum, and deconvoluted (b) C 1s and (c) Sn 3d spectra for the synthesized SnO2/gC material. The survey spectrum of Fig. 4a shows the desired presence of Sn, C and O, and a negligible amount of Cl residue from the reactant. The C 1s spectrum of the gC support exhibits four different contributions, arising from the C![[double bond, length as m-dash]](https://www.rsc.org/images/entities/char_e001.gif) C (284.5 eV), C–OH (286.4 eV), C
C (284.5 eV), C–OH (286.4 eV), C![[double bond, length as m-dash]](https://www.rsc.org/images/entities/char_e001.gif) O (288.5 eV), and O–C
O (288.5 eV), and O–C![[double bond, length as m-dash]](https://www.rsc.org/images/entities/char_e001.gif) O (290.7 eV) groups (Fig. 4b). The Sn 3d spectrum (Fig. 4c) shows two symmetric peaks at around 487.5 eV and 495.8 eV, which are characteristic of Sn 3d5/2 and Sn 3d3/2, respectively. The presence of Sn in the (+4) state confirms the formation of only the SnO2 phase in the solar reduced SnO2/gC composite. Fig. 4d shows the Sn 3d peaks for SnO2/MWNT, with similar features to SnO2/gC, thus confirming the formation of the tin(IV) oxide phase. 40–60 nm average diameter multiwalled carbon nanotubes with lengths of a few μm (Fig. 5a) were synthesized using the CCVD technique. The TEM image in Fig. 5b shows the inner hollowness of the synthesized MWNT. The average number of layers of nanotubes was found to be ∼25–30. Tin oxide nanoparticles decorated over the smooth MWNT surface make the surface rough (Fig. 5c), which correlates with the higher ID/IG value. Distinct particles decorated over the smooth MWNT surface can be seen in the TEM image of SnO2/MWNT (Fig. 5d). The TEM image of the gC structure shows 10–20 nm uniform graphene wrapping over a 50–70 nm diameter nanotube structure (Fig. 6a). The SnO2 nanoparticles that are uniformly dispersed over this composite are visible in the TEM image of SnO2/gC (Fig. 6b). The HRTEM image (Fig. 6c) of the same composite shows spherical nanoparticles with average sizes of 2.9 nm. The EDAX spectrum shown in Fig. 6d shows the desired presence of Sn, oxygen and carbon in the synthesized structure. The homogeneous distribution of a Sn and O lattice over the carbon surface has also been confirmed by the elemental mapping of SnO2/gC (Fig. S1†).
O (290.7 eV) groups (Fig. 4b). The Sn 3d spectrum (Fig. 4c) shows two symmetric peaks at around 487.5 eV and 495.8 eV, which are characteristic of Sn 3d5/2 and Sn 3d3/2, respectively. The presence of Sn in the (+4) state confirms the formation of only the SnO2 phase in the solar reduced SnO2/gC composite. Fig. 4d shows the Sn 3d peaks for SnO2/MWNT, with similar features to SnO2/gC, thus confirming the formation of the tin(IV) oxide phase. 40–60 nm average diameter multiwalled carbon nanotubes with lengths of a few μm (Fig. 5a) were synthesized using the CCVD technique. The TEM image in Fig. 5b shows the inner hollowness of the synthesized MWNT. The average number of layers of nanotubes was found to be ∼25–30. Tin oxide nanoparticles decorated over the smooth MWNT surface make the surface rough (Fig. 5c), which correlates with the higher ID/IG value. Distinct particles decorated over the smooth MWNT surface can be seen in the TEM image of SnO2/MWNT (Fig. 5d). The TEM image of the gC structure shows 10–20 nm uniform graphene wrapping over a 50–70 nm diameter nanotube structure (Fig. 6a). The SnO2 nanoparticles that are uniformly dispersed over this composite are visible in the TEM image of SnO2/gC (Fig. 6b). The HRTEM image (Fig. 6c) of the same composite shows spherical nanoparticles with average sizes of 2.9 nm. The EDAX spectrum shown in Fig. 6d shows the desired presence of Sn, oxygen and carbon in the synthesized structure. The homogeneous distribution of a Sn and O lattice over the carbon surface has also been confirmed by the elemental mapping of SnO2/gC (Fig. S1†).
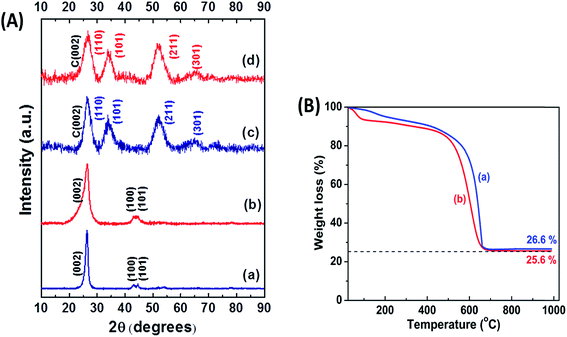 |
| | Fig. 2 (A) XRD patterns for (a) MWNT, (b) gC, (c) SnO2/MWNT and (d) SnO2/gC; (B) thermo-gravimetric analysis for (a) SnO2/MWNT and (b) SnO2/gC. | |
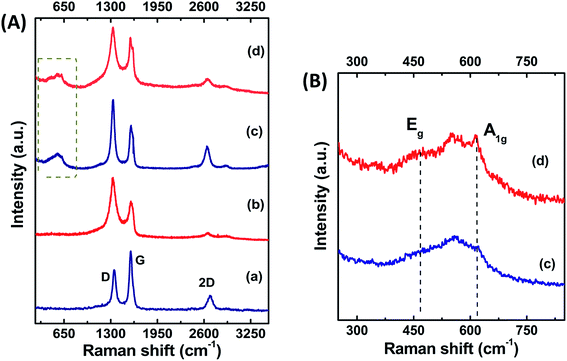 |
| | Fig. 3 (A) Raman spectra for (a) MWNT, (b) gC, (c) SnO2/MWNT and (d) SnO2/gC. The Raman modes of SnO2 are shown in (B) for (c) SnO2/MWNT and (d) SnO2/gC. | |
Table 1 ID/IG ratios of the synthesized materials
| Material |
MWNT |
gC |
SnO2/MWNT |
SnO2/gC |
| ID/IG value |
0.36 |
1.48 |
1.62 |
1.23 |
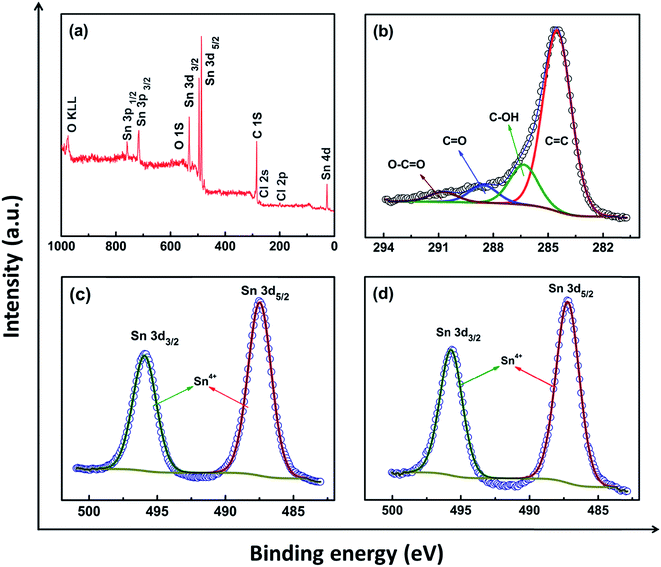 |
| | Fig. 4 XPS study: (a) survey spectrum, deconvoluted spectra for (b) C 1s and (c) Sn 3d for SnO2/gC respectively; (d) deconvoluted spectrum of Sn 3d for SnO2/MWNT. | |
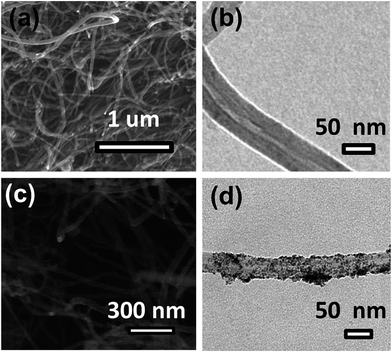 |
| | Fig. 5 SEM and TEM images (a and b, respectively) of MWNT, and (c and d, respectively) SnO2/MWNT. | |
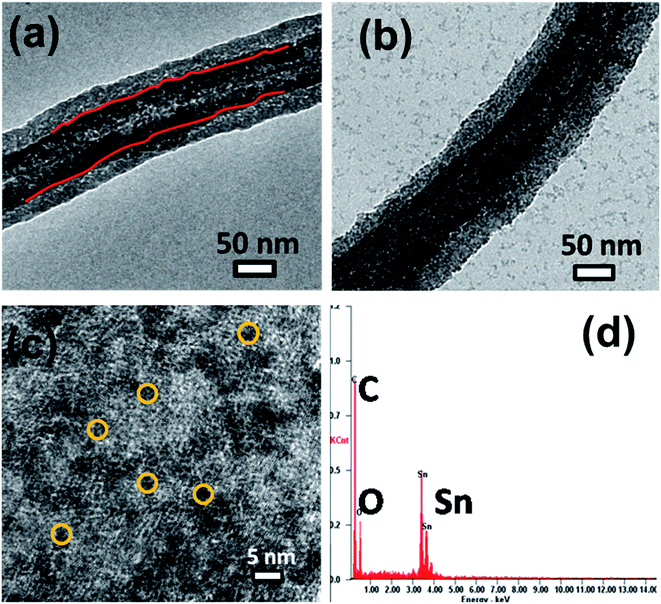 |
| | Fig. 6 (a) SEM image of the employed gC; (b) TEM and (c) HRTEM images and (d) the EDAX spectrum of SnO2/gC. | |
Electrochemical characterization was carried out on the fabricated CR 2032 cells, after confirmation of the phase formation of the desired material, and the results are presented in Fig. 7 and 8. Fig. 7a shows the Li+ insertion and extraction process in the form of cyclic voltammograms (CV) for SnO2/gC over the range of 3–0.01 V (vs. Li/Li+) at a scan rate of 0.5 mV s−1. The material shows two main sets of anodic and cathodic peaks at similar potential positions to those of tin oxide. The slightly shifted oxidation and reduction peaks might be due to the separate polarization as a result of hybridization of the carbon support and tin oxide nanoparticles. The CV for the first cycle is clearly distinct compared to those of the other cycles for the peak at around 0.7–1.3 V. This represents both the well-known solid electrolyte interphase (SEI) formation31 and the reduction of tin oxide to tin, resulting in the formation of Li2O32 (eqn (1)). The lower intensity of this peak in the consequent cycles confirms the low reversibility of SEI layer formation. The broad peak from 0.5 V to 0.01 V represents the alloying of tin (eqn (2)). The cathodic peak at 0.25 V represents the interaction of Li+ with the carbon layers (eqn (3)). The peaks at around 0.7 V and 1.4 V represent the de-alloying and oxidation into SnO2, respectively (backward reactions of eqn (1) and (2)). Though the conventional method of theoretical capacity calculation for SnO2 considers the backward reaction of eqn (1) to be completely irreversible, the present voltammogram shows a prominent and stable peak at 1.42 V, even after 10 cycles, suggesting the enhanced capacity of the investigated material as a Li ion battery anode. The uniform dispersion of SnO2 nanoparticles over the protruding graphene wrapped multiwalled carbon nanotubes, as seen in the TEM image of Fig. 6b and c, can also be confirmed from the consistency of the anodic peak at 0.7 V (backward reaction of eqn (2)). This peak also proves the involvement of Li interaction in the composite from the very first cycle without any activation.33 The repeatability of the voltammogram also suggests high cyclability by possibly confining the formed LixSn and Li2O into the accommodating structure of SnO2/gC.
| | |
SnO2 + 4Li+ + 4e− ↔ Sn + 2Li2O
| (1) |
| | |
Sn + xLi+ + xe− ↔ LixSn (0 ≤ x ≤ 4.4)
| (2) |
| | |
xLi+ + C + xe− ↔ LixC
| (3) |
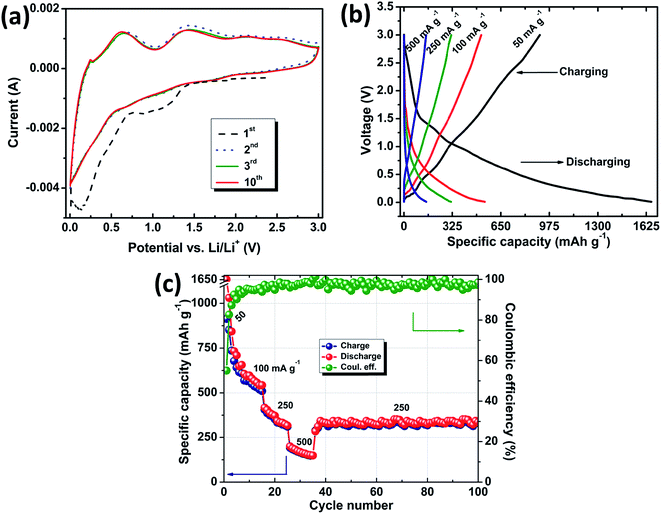 |
| | Fig. 7 Electrochemical studies of SnO2/gC: (a) cyclic voltammograms at a scan rate of 0.5 mV s−1, (b) charge–discharge profiles and (c) rate capability tests at various current densities. | |
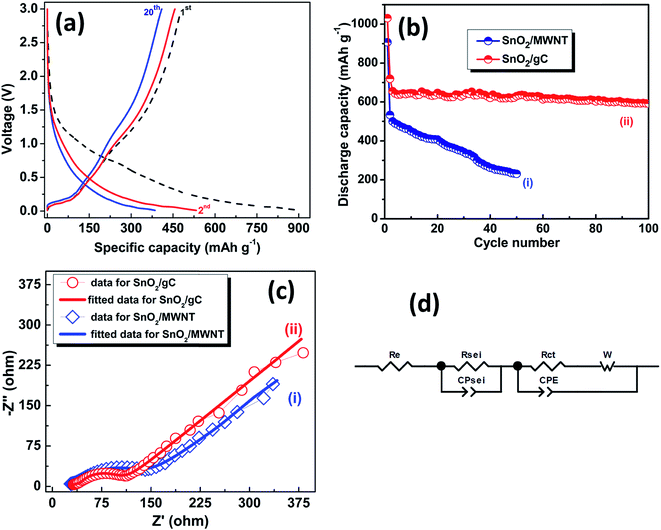 |
| | Fig. 8 (a) Charge–discharge profiles at a 50 mA g−1 current density for SnO2/MWNT, (b) stability tests and (c) electrochemical impedance study for (i) SnO2/MWNT, and (ii) SnO2/gC; (d) equivalent circuit model fitted to the Nyquist plots. | |
Fig. 7b shows galvanostatic charge discharge studies of SnO2/gC as a LIB anode material at different current densities. The first discharging capacity for SnO2/gC at a current density of 50 mA g−1 was 1675 mA h g−1, with 920 mA h g−1 as the charging capacity and a 55% initial coulombic efficiency. SnO2/MWNT shows a 907 mA h g−1 discharge capacity in the first cycle with a 53% coulombic efficiency at the same current density (Fig. 8a). The discharge capacity value goes down to 1025 mA h g−1 for SnO2/gC and 533 mA h g−1 for SnO2/MWNT in the next cycle. This irreversible loss is attributed to the electrolyte decomposition, and SEI layer and Li2O formation32 (Fig. 7c). The coulombic efficiency increases to 87% and 86% in the next cycle for SnO2/gC and SnO2/MWNT, respectively. The rate capability test for SnO2/gC shown in Fig. 7c shows the capacity restoration when the current density is varied, thus confirming the reversibility of the anode. At higher current densities of 100 mA g−1, 250 mA g−1 and 500 mA g−1, the achieved discharge/charge capacities were 543/497 mA h g−1, 325/324 mA h g−1 and 163/161 mA h g−1, respectively for SnO2/gC (Fig. 7c). A constant discharge capacity of 333 mA h g−1 with a 99% coulombic efficiency was achieved after 65 cycles at a current density of 250 mA g−1, emphasizing the superior rate capability. The cyclic stability test at a current density of 50 mA g−1 for SnO2/gC in comparison to SnO2/MWNT is shown in Fig. 8b. For SnO2/MWNT as an anode material, the discharge capacity reduces to 231 mA h g−1 after 50 cycles with a 57% declining capacity, thus suggesting poor cyclability (Fig. 8b(i)). SnO2/gC shows a 592 mA h g−1 capacity at the end of 100 cycles, with only a 16% capacity fading with respect to the second cycle (Fig. 8b(ii)). The electrochemical specific capacity of SnO2/gC is higher than those of the reported microwave reduced SnO2/G-CNT composite18 and flexible SnO2/G-CNT paper.15 Other SnO2 decorated 1D–2D composite materials (Table 2) showed higher performances compared to the present tin oxide decorated graphene wrapped carbon nanotubes. The lower capacity of SnO2/gC can be countered by consideration of the higher loading of metal oxide on the 1D–2D hybrid support and the complicated synthesis processes of the composite materials. The employed SnO2/gC exhibits comparable performance to the reported 649 mA h g−1 for a 2D SnO2/G anode with higher loading of tin oxide.34 Evidently, the 1D SnO2/gC structure shows higher capacity and stability compared to the investigated wrinkle-free 1D SnO2/MWNT. The high conductivity of the inner core of gC leads to a high rate of electron transfer. Wrinkly defects in the gC surface enhance the anchoring sites for SnO2 together with the higher Li storage and interaction probability. The synergistic effect of these two factors suggests that SnO2/gC is a high rate capable and stable anode material for Li ion batteries with a higher specific discharge capacity of 592 mA h g−1.
Table 2 Performance comparisons of SnO2/gC as an anode material for Li ion batteriesa
| Anode material employed |
Dimension of employed support nanostructure |
Current density (mA g−1) |
Specific capacity (mA h g−1) |
| Initial discharge/charge |
Reversible [cycle no.] |
| *Denotes data not available. |
| 80% SnO2–G34 |
2D |
50 |
2140/1080 |
649 [30] |
| 60% SnO2/G-CNT18 |
1D–2D |
100 |
∼1050/* |
502 [50] |
| 83.5% SnO2/G-CNT16 |
3D aerogel |
200 |
∼1806/1200 |
842 [40] |
| 45% SnO2-PG/CNW17 |
1D–2D |
200 |
∼950/* |
943 [50] |
| 63% SnO2/G-CNT15 |
1D–2D |
250 |
∼1600/820 |
635 [80] |
| Flexible SnO2/G-CNT paper15 |
1D–2D |
100 |
∼990/400 |
387 [50] |
| SnO2/MWNT |
1D |
50 |
907/480 |
231 [50] |
| SnO2/gC (present work) |
1D |
50 |
1675/920 |
592 [100] |
Electrochemical impedance spectroscopy (EIS) measurements for SnO2/gC in comparison with SnO2/MWNT are represented in Fig. 8c as Nyquist plots for further investigation. The measurements were carried out by employing a sine wave with an amplitude of 5 mV over a frequency range of 100 kHz to 0.01 Hz. The spectra were recorded after 100 cycles of charge–discharge at a 500 mA g−1 current density, to obtain detailed information about the SEI layer, resistances and diffusion of Li within the cell. An equivalent circuit was modeled to analyze the spectra (Fig. 8d). Z-view software was used to simulate the plot using the equivalent circuit. The simulation shows a depressed semicircle with two partially overlapping contributions and a sloping line. The intercept at the real axis (Z′) at high frequencies is attributed to the overall ohmic resistance, including contributions from the separator, electrolyte and all electrical connections (Re). The high frequency semicircle arises due to Li+ ion migration through the SEI layer and is represented by RSEI and charge phase elements. The low frequency semicircle takes into account the charge transfer resistance (Rct) and the corresponding constant phase element of the electrode/electrolyte. The straight line represents the Warburg impedance (W) of the diffusion of Li ions into the electrode. The perfect fitting of the simulated curve with the experimental spectra is in agreement with the perfectly selected equivalent circuit and parameters. The lower Re values of SnO2/MWNT compared to those of SnO2/gC can be attributed to the higher conductivity of the crystalline and smoother surface backbone of MWNT. The lower RSEI value for SnO2/gC compared to that of SnO2/MWNT points to the probability of restricting the SEI layer thickness and the improved ion pathways for the unique structure of the graphene wrapped carbon nanotubes support (Table 3). Charge transfer resistance, Rct, is also lower for tin oxide nanoparticles supported graphene wrapped carbon nanotubes over SnO2/MWNT resulting improved exchange current density (i0 = RT/nFRct). The lower total cell resistance of SnO2/gC results in enhanced reaction kinetics, thus ensuring a higher rate capability and improved cyclability as an anode material compared to only MWNT, gC19 and SnO2/MWNT for Li ion batteries.
Table 3 Impedance parameters for the investigated anode materials, calculated from the equivalent model
| Material |
Re |
RSEI |
Rct |
| SnO2/MWNT |
17.24 |
36.55 |
86.92 |
| SnO2/gC |
29.31 |
11.91 |
63.9 |
Solar reduction results in optimized 3 nm particles of SnO2 over the graphene wrapped carbon nanotubes. The probability of agglomeration is also less for the gC support due to wrinkled surface defects in comparison with MWNT. This interconnected-porous structure of gC also provides breathing space for the volume expansion of the nanoparticles during lithiation/delithiation (Fig. 1). By compensating for the semiconducting nature of SnO2 and accommodating the strain released due to volume change in the lithiation/delithiation process, the interconnected nano-3D conducting composite structure, SnO2/gC, proved to be a prospective anode material for LIBs with higher stability. Carbon coating over tin oxide nanoparticles to balance the semiconducting nature and heteroatom doping in the gC support for enhanced electrical conductivity can still be employed, and an improved, higher performance for SnO2/carbon composite structures as an anode for Li ion batteries is anticipated.
Conclusions
Tin oxide decorated graphene wrapped carbon nanotube structure was synthesized using a one pot, simple and green solar reduction technique. Graphene wrapping in the form of protrusions acts as an easy and strong anchoring site for nanoparticle decoration, thus preventing the agglomeration of nanoparticles over cycles. The conducting monohybrid structure of the gC support improves the electron transfer, thus compensating for the semiconducting tin oxide. Protruding surface tubes, as individuals as well as bunches, provide better Li+ pathways. The nano-architecture of the SnO2/gC composite with improved reaction kinetics thus shows an improved, stable capacity of 592 mA h g−1 at 50 mA g−1 after 100 cycles by accommodating the volume change in its porous structure.
Acknowledgements
The authors acknowledge the support of SAIF, IIT Madras and IIT Madras, India.
References
- J. B. Goodenough and K. S. Park, J. Am. Chem. Soc., 2013, 135, 1167–1176 CrossRef CAS PubMed.
- C. Wang, A. J. Appleby and F. E. Little, J. Electroanal. Chem., 2001, 497, 33–46 CrossRef CAS.
- Q. Zhou, L. Yang, G. Wang and Y. Yang, Biosens. Bioelectron., 2013, 49, 25–31 CrossRef CAS PubMed.
- S. Byun and B. Shin, J. Mater. Chem. A, 2016, 4, 16175–16183 CAS.
- H. Wang and A. L. Rogach, Chem. Mater., 2014, 26, 123–133 CrossRef CAS.
- L. Liu, F. Xie, J. Lyu, T. Zhao, T. Li and B. G. Choi, J. Power Sources, 2016, 321, 11–35 CrossRef CAS.
- K. Kisu, M. Iijima, E. Iwama, M. Saito, Y. Orikasa, W. Naoi and K. Naoi, J. Mater. Chem. A, 2014, 2, 13058–13068 CAS.
- C. Kim, M. Noh, M. Choi, J. Cho and B. Park, Chem. Mater., 2005, 17, 3297–3301 CrossRef CAS.
- X. W. Lou, Y. Wang, C. Yuan, J. Y. Lee and L. A. Archer, Adv. Mater., 2006, 18, 2325–2329 CrossRef CAS.
- X. L. Wang, M. Feygenson, M. C. Aronson and W. Q. Han, J. Phys. Chem. C, 2010, 114, 14697–14703 CAS.
- Z. Wen, Q. Wang, Q. Zhang and J. Li, Adv. Funct. Mater., 2007, 17, 2772–2778 CrossRef CAS.
- L. S. Zhang, L. Y. Jiang, H. J. Yan, W. D. Wang, W. Wang, W.-G. Song, Y.-G. Guo and L. J. Wan, J. Mater. Chem., 2010, 20, 5462–5467 RSC.
- S. Ding, D. Luan, F. Y. C. Boey, J. S. Chen and X. W. Lou, Chem. Commun., 2011, 47, 7155–7157 RSC.
- M. Sahoo and S. Ramaprabhu, Graphene, 2014, 2, 88–94 CrossRef.
- B. Zhang, Q. B. Zheng, Z. D. Huang, S. W. Oh and J. K. Kim, Carbon, 2011, 49, 4524–4534 CrossRef CAS.
- Z. Zhang, L. Wang, J. Xiao, F. Xiao and S. Wang, ACS Appl. Mater. Interfaces, 2015, 7, 17963–17968 CAS.
- J. Tang, J. Yang, X. Zhou, H. Yao and L. Zhou, J. Mater. Chem. A, 2015, 3, 23844–23851 CAS.
- T. Chen, L. Pan, X. Liu, K. Yu and Z. Sun, RSC Adv., 2012, 2, 11719–11724 RSC.
- M. Sahoo and S. Ramaprabhu, Electrochim. Acta, 2015, 186, 142–150 CrossRef CAS.
- S. Venkateswarlu, D. Lee and M. Yoon, ACS Appl. Mater. Interfaces, 2016, 8, 23876–23885 CAS.
- K. R. Reddy, B. C. Sin, C. H. Yoo, W. Park, K. S. Ryu, J.-S. Lee, D. Sohn and Y. Lee, Scr. Mater., 2008, 58, 1010–1013 CrossRef CAS.
- K. R. Reddy, M. Hassan and V. G. Gomes, Appl. Catal., A, 2015, 489, 1–16 CrossRef CAS.
- K. R. Reddy, B. C. Sin, C. H. Yoo, D. Sohn and Y. Lee, J. Colloid Interface Sci., 2009, 340, 160–165 CrossRef CAS PubMed.
- S. S. Jyothirmayee Aravind, V. Eswaraiah and S. Ramaprabhu, J. Mater. Chem., 2011, 21, 15179–15182 RSC.
- P. Nayak, P. N. Santhosh and S. Ramaprabhu, J. Phys. Chem. C, 2014, 118, 5172–5179 CAS.
- M. Baro, P. Nayak, T. T. Baby and S. Ramaprabhu, J. Mater. Chem. A, 2013, 1, 482–486 CAS.
- A. L. M. Reddy, M. M. Shaijumon and S. Ramaprabhu, Nanotechnology, 2006, 17, 5299 CrossRef CAS.
- A. L. Patterson, Physical Review, 1939, 56, 978–982 CrossRef CAS.
- A. Diéguez, A. Romano-Rodrıíguez, A. Vilà and J. R. Morante, J. Appl. Phys., 2001, 90, 1550–1557 CrossRef.
- J. Xu, Y. Li, H. Huang, Y. Zhu, Z. Wang, Z. Xie, X. Wang, D. Chen and G. Shen, J. Mater. Chem., 2011, 21, 19086–19092 RSC.
- Z. Wang, G. Chen and D. Xia, J. Power Sources, 2008, 184, 432–436 CrossRef CAS.
- H. J. Ahn, H. C. Choi, K. W. Park, S. B. Kim and Y. E. Sung, J. Phys. Chem. B, 2004, 108, 9815–9820 CrossRef CAS.
- G. Du, C. Zhong, P. Zhang, Z. Guo, Z. Chen and H. Liu, Electrochim. Acta, 2010, 55, 2582–2586 CrossRef CAS.
- X. Zhu, Y. Zhu, S. Murali, M. D. Stoller and R. S. Ruoff, J. Power Sources, 2011, 196, 6473–6477 CrossRef CAS.
Footnote |
| † Electronic supplementary information (ESI) available. See DOI: 10.1039/c6ra27515j |
|
| This journal is © The Royal Society of Chemistry 2017 |
Click here to see how this site uses Cookies. View our privacy policy here.  Open Access Article
 *
*
![[thin space (1/6-em)]](https://www.rsc.org/images/entities/char_2009.gif) :
:![[thin space (1/6-em)]](https://www.rsc.org/images/entities/char_2009.gif) 3 with graphene wrapped carbon nanotubes. Solar energy was focused using a convex lens (90 mm diameter) to act as the energy source for the reduction.26 The previously prepared mixture was uniformly spread on a glass Petri dish and exposed to the focused solar energy using the lens for a few minutes during peak hours of scorching heat on a clear summer day. The exposure was scanned throughout the spread sample in an identical method for uniformity. The temperature of the focused portion increased rapidly to 150–450 °C within a few seconds, resulting in decomposition of the precursor salt and the simultaneous deposition of tin nanoparticles over the support surface.25,26 The release of gaseous by-products was clearly visible during the short time of the synthesis. Tin nanoparticles reacted with atmospheric oxygen and oxygen that was decomposing from the salt, resulting in tin oxide nanoparticles, owing to the chemical reactivity of tin at high temperatures. Finally, the black powder was collected and labeled as SnO2/gC without any further modifications. For comparison, SnO2 nanoparticles were also decorated over the surfaces of purified multiwalled carbon nanotubes27 (MWNT) using a similar process. Without any further treatment, the SnO2/MWNT and SnO2/gC materials were tested as anode materials for LIBs.
3 with graphene wrapped carbon nanotubes. Solar energy was focused using a convex lens (90 mm diameter) to act as the energy source for the reduction.26 The previously prepared mixture was uniformly spread on a glass Petri dish and exposed to the focused solar energy using the lens for a few minutes during peak hours of scorching heat on a clear summer day. The exposure was scanned throughout the spread sample in an identical method for uniformity. The temperature of the focused portion increased rapidly to 150–450 °C within a few seconds, resulting in decomposition of the precursor salt and the simultaneous deposition of tin nanoparticles over the support surface.25,26 The release of gaseous by-products was clearly visible during the short time of the synthesis. Tin nanoparticles reacted with atmospheric oxygen and oxygen that was decomposing from the salt, resulting in tin oxide nanoparticles, owing to the chemical reactivity of tin at high temperatures. Finally, the black powder was collected and labeled as SnO2/gC without any further modifications. For comparison, SnO2 nanoparticles were also decorated over the surfaces of purified multiwalled carbon nanotubes27 (MWNT) using a similar process. Without any further treatment, the SnO2/MWNT and SnO2/gC materials were tested as anode materials for LIBs.
![[thin space (1/6-em)]](https://www.rsc.org/images/entities/char_2009.gif) :
:![[thin space (1/6-em)]](https://www.rsc.org/images/entities/char_2009.gif) 15
15![[thin space (1/6-em)]](https://www.rsc.org/images/entities/char_2009.gif) :
:![[thin space (1/6-em)]](https://www.rsc.org/images/entities/char_2009.gif) 10 in an N-methyl-2-pyrrolidinone solvent. A doctor blade technique was used to uniformly coat the slurry onto the copper foil which was then dried in a vacuum oven at 120 °C for 6 h. 12 mm diameter anode coins were cut from the dried active-material slurry mixture on the copper foil. CR 2032 type coin cells with lithium metal as the counter electrode, Celgard 2400 as the membrane separator, and LiPF6 (1 M) dissolved in a mixture of ethylene carbonate (EC) and dimethyl carbonate (DMC) (EC/DMC, 1
10 in an N-methyl-2-pyrrolidinone solvent. A doctor blade technique was used to uniformly coat the slurry onto the copper foil which was then dried in a vacuum oven at 120 °C for 6 h. 12 mm diameter anode coins were cut from the dried active-material slurry mixture on the copper foil. CR 2032 type coin cells with lithium metal as the counter electrode, Celgard 2400 as the membrane separator, and LiPF6 (1 M) dissolved in a mixture of ethylene carbonate (EC) and dimethyl carbonate (DMC) (EC/DMC, 1![[thin space (1/6-em)]](https://www.rsc.org/images/entities/char_2009.gif) :
:![[thin space (1/6-em)]](https://www.rsc.org/images/entities/char_2009.gif) 1 v/v) as the electrolyte, were employed for testing. The cells were fabricated in a high pure argon (>99.999%) filled glove box (mBRAUN, Unilab) for the electrochemical measurements. A Solartron electrochemical workstation was used to study the galvanostatic charge–discharge measurements between 3 V and 0.01 V at room temperature for the assembled coin cells. An Autolab PGSTAT302 instrument with NOVA software was used to obtain the cyclic voltammograms (CVs) and impedance spectra for the employed materials. CV was recorded at a scan rate of 0.5 mV s−1, while a sine wave with an amplitude of 5 mV over a frequency range from 100 kHz to 0.01 Hz was applied to record the electrochemical ac impedance spectra.
1 v/v) as the electrolyte, were employed for testing. The cells were fabricated in a high pure argon (>99.999%) filled glove box (mBRAUN, Unilab) for the electrochemical measurements. A Solartron electrochemical workstation was used to study the galvanostatic charge–discharge measurements between 3 V and 0.01 V at room temperature for the assembled coin cells. An Autolab PGSTAT302 instrument with NOVA software was used to obtain the cyclic voltammograms (CVs) and impedance spectra for the employed materials. CV was recorded at a scan rate of 0.5 mV s−1, while a sine wave with an amplitude of 5 mV over a frequency range from 100 kHz to 0.01 Hz was applied to record the electrochemical ac impedance spectra.

![[double bond, length as m-dash]](https://www.rsc.org/images/entities/char_e001.gif) C (284.5 eV), C–OH (286.4 eV), C
C (284.5 eV), C–OH (286.4 eV), C![[double bond, length as m-dash]](https://www.rsc.org/images/entities/char_e001.gif) O (288.5 eV), and O–C
O (288.5 eV), and O–C![[double bond, length as m-dash]](https://www.rsc.org/images/entities/char_e001.gif) O (290.7 eV) groups (Fig. 4b). The Sn 3d spectrum (Fig. 4c) shows two symmetric peaks at around 487.5 eV and 495.8 eV, which are characteristic of Sn 3d5/2 and Sn 3d3/2, respectively. The presence of Sn in the (+4) state confirms the formation of only the SnO2 phase in the solar reduced SnO2/gC composite. Fig. 4d shows the Sn 3d peaks for SnO2/MWNT, with similar features to SnO2/gC, thus confirming the formation of the tin(IV) oxide phase. 40–60 nm average diameter multiwalled carbon nanotubes with lengths of a few μm (Fig. 5a) were synthesized using the CCVD technique. The TEM image in Fig. 5b shows the inner hollowness of the synthesized MWNT. The average number of layers of nanotubes was found to be ∼25–30. Tin oxide nanoparticles decorated over the smooth MWNT surface make the surface rough (Fig. 5c), which correlates with the higher ID/IG value. Distinct particles decorated over the smooth MWNT surface can be seen in the TEM image of SnO2/MWNT (Fig. 5d). The TEM image of the gC structure shows 10–20 nm uniform graphene wrapping over a 50–70 nm diameter nanotube structure (Fig. 6a). The SnO2 nanoparticles that are uniformly dispersed over this composite are visible in the TEM image of SnO2/gC (Fig. 6b). The HRTEM image (Fig. 6c) of the same composite shows spherical nanoparticles with average sizes of 2.9 nm. The EDAX spectrum shown in Fig. 6d shows the desired presence of Sn, oxygen and carbon in the synthesized structure. The homogeneous distribution of a Sn and O lattice over the carbon surface has also been confirmed by the elemental mapping of SnO2/gC (Fig. S1†).
O (290.7 eV) groups (Fig. 4b). The Sn 3d spectrum (Fig. 4c) shows two symmetric peaks at around 487.5 eV and 495.8 eV, which are characteristic of Sn 3d5/2 and Sn 3d3/2, respectively. The presence of Sn in the (+4) state confirms the formation of only the SnO2 phase in the solar reduced SnO2/gC composite. Fig. 4d shows the Sn 3d peaks for SnO2/MWNT, with similar features to SnO2/gC, thus confirming the formation of the tin(IV) oxide phase. 40–60 nm average diameter multiwalled carbon nanotubes with lengths of a few μm (Fig. 5a) were synthesized using the CCVD technique. The TEM image in Fig. 5b shows the inner hollowness of the synthesized MWNT. The average number of layers of nanotubes was found to be ∼25–30. Tin oxide nanoparticles decorated over the smooth MWNT surface make the surface rough (Fig. 5c), which correlates with the higher ID/IG value. Distinct particles decorated over the smooth MWNT surface can be seen in the TEM image of SnO2/MWNT (Fig. 5d). The TEM image of the gC structure shows 10–20 nm uniform graphene wrapping over a 50–70 nm diameter nanotube structure (Fig. 6a). The SnO2 nanoparticles that are uniformly dispersed over this composite are visible in the TEM image of SnO2/gC (Fig. 6b). The HRTEM image (Fig. 6c) of the same composite shows spherical nanoparticles with average sizes of 2.9 nm. The EDAX spectrum shown in Fig. 6d shows the desired presence of Sn, oxygen and carbon in the synthesized structure. The homogeneous distribution of a Sn and O lattice over the carbon surface has also been confirmed by the elemental mapping of SnO2/gC (Fig. S1†).


